Feb 25, 2010
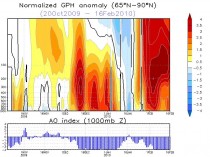
Most Negative AO Index Winter since 1950
By Joseph D’Aleo
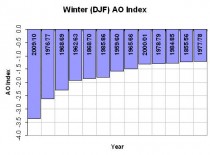
Enlarged here.
This was the result of major stratospheric warming for most of the winter, related to solar and high latitude volcanoes.
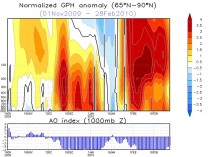
Look how well AO correlated with Cleveland temperatures since November (analysis by Scott Sabol, FOX8, Cleveland) here.
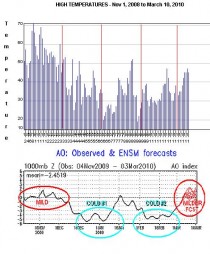
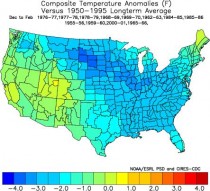
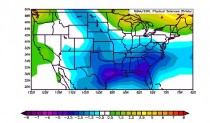
Here was the result in the US:
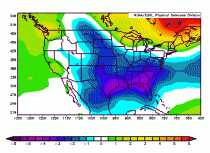
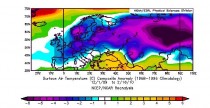
and here also for Eurasia

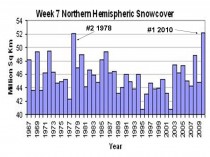
Here was the effect on Northern Hemispheric snowcover. 2010 in week 7 had the greatest snowcover since records began in the late 1960s, ahead of week 7 in 1978, another top ten most negative AO winters.
See an analysis of the factors here and another here. More to come on the results this amazing winter this week.
--------------------
The Warning in the Stars
By David Archibald
If climate is not a random walk, then we can predict climate if we understand what drives it. The energy that stops the Earth from looking like Pluto comes from the Sun, and the level and type of that energy does change. So the Sun is a good place to start if we want to be able to predict climate. To put that into context, let’s look at what the Sun has done recently. This is a figure from “Century to millenial-scale temperature variations for the last two thousand years indicated from glacial geologic records of Southern Alaska” G.C.Wiles, D.J.Barclay, P.E.Calkin and T.V.Lowell 2007:

The red line is the C14 production rate, inverted. C14 production is inversely related to solar activity, so we see more C14 production during solar minima. The black line is the percentage of ice-rafted debris in seabed cores of the North Atlantic, also plotted inversely. The higher the black line, the warmer the North Atlantic was. The grey vertical stripes are solar minima. As the authors say, “Previous analyses of the glacial record showed a 200- year rhythm to glacial activity in Alaska and its possible link to the de Vries 208-year solar (Wiles et al., 2004). Similarly, high-resolution analyses of lake sediments in southwestern Alaska suggests that century-scale shifts in Holocene climate were modulated by solar activity (Hu et al., 2003). It seems that the only period in the last two thousand years that missed a de Vries cycle cooling was the Medieval Warm Period.”
The same periodicity over the last 1,000 years is also evident in this graphic of the advance/retreat of the Great Aletsch Glacier in Switzerland (below enlarged here):

The solar control over climate is also shown in this graphic of Be10 in the Dye 3 ice core from central Greenland (below enlarged here)::
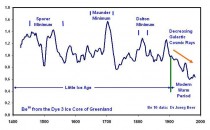
The modern retreat of the world’s glaciers, which started in 1860, correlates with a decrease in Be10, indicating a more active Sun that is pushing galactic cosmic rays out from the inner planets of the solar system.
The above graphs show a correlation between solar activity and climate in the broad, but we can achieve much finer detail, as shown in this graphic from a 1996 paper by Butler and Johnson (below enlarged here)::
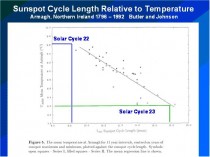
Butler and Johnson applied Friis-Christensen and Lassen theory to one temperature record - the three hundred years of data from Armagh in Northern Ireland. There isn’t much scatter around their line of best fit, so it can be used as a fairly accurate predictive tool. The Solar Cycle 22/23 transition happened in the year of that paper’s publication, so I have added the lengths of Solar Cycles 22 and 23 to the figure to update it. The result is a prediction that the average annual temperature at Armagh over Solar Cycle 24 will be 1.4C cooler than over Solar Cycle 23. This is twice the assumed temperature rise of the 20th Century of 0.7 C, but in the opposite direction.
To sum up, let’s paraphrase Dante: The darkest recesses of Hell are reserved for those who deny the solar control of climate. See PDF.
------------------------------
Wind power is a complete disaster
By Michael J. Trebilcock, Financial Post
There is no evidence that industrial wind power is likely to have a significant impact on carbon emissions. The European experience is instructive. Denmark, the world’s most wind-intensive nation, with more than 6,000 turbines generating 19% of its electricity, has yet to close a single fossil-fuel plant. It requires 50% more coal-generated electricity to cover wind power’s unpredictability, and pollution and carbon dioxide emissions have risen (by 36% in 2006 alone).
Flemming Nissen, the head of development at West Danish generating company ELSAM (one of Denmark’s largest energy utilities) tells us that “wind turbines do not reduce carbon dioxide emissions.” The German experience is no different. Der Spiegel reports that “Germany’s CO2 emissions haven’t been reduced by even a single gram,” and additional coal- and gas-fired plants have been constructed to ensure reliable delivery.

Indeed, recent academic research shows that wind power may actually increase greenhouse gas emissions in some cases, depending on the carbon-intensity of back-up generation required because of its intermittent character. On the negative side of the environmental ledger are adverse impacts of industrial wind turbines on birdlife and other forms of wildlife, farm animals, wetlands and viewsheds.
Industrial wind power is not a viable economic alternative to other energy conservation options. Again, the Danish experience is instructive. Its electricity generation costs are the highest in Europe (15 cents/kwh compared to Ontario’s current rate of about 6 cents). Niels Gram of the Danish Federation of Industries says, “windmills are a mistake and economically make no sense.” Aase Madsen , the Chair of Energy Policy in the Danish Parliament, calls it “a terribly expensive disaster.”
The U.S. Energy Information Administration reported in 2008, on a dollar per MWh basis, the U.S. government subsidizes wind at $23.34 - compared to reliable energy sources: natural gas at 25 cents; coal at 44 cents; hydro at 67 cents; and nuclear at $1.59, leading to what some U.S. commentators call “a huge corporate welfare feeding frenzy.” The Wall Street Journal advises that “wind generation is the prime example of what can go wrong when the government decides to pick winners.”
The Economist magazine notes in a recent editorial, “Wasting Money on Climate Change,” that each tonne of emissions avoided due to subsidies to renewable energy such as wind power would cost somewhere between $69 and $137, whereas under a cap-and-trade scheme the price would be less than $15.
Either a carbon tax or a cap-and-trade system creates incentives for consumers and producers on a myriad of margins to reduce energy use and emissions that, as these numbers show, completely overwhelm subsidies to renewables in terms of cost effectiveness.
The Ontario Power Authority advises that wind producers will be paid 13.5 cents/kwh (more than twice what consumers are currently paying), even without accounting for the additional costs of interconnection, transmission and back-up generation. As the European experience confirms, this will inevitably lead to a dramatic increase in electricity costs with consequent detrimental effects on business and employment. From this perspective, the government’s promise of 55,000 new jobs is a cruel delusion.
A recent detailed analysis (focusing mainly on Spain) finds that for every job created by state-funded support of renewables, particularly wind energy, 2.2 jobs are lost. Each wind industry job created cost almost $2-million in subsidies. Why will the Ontario experience be different?
In debates over climate change, and in particular subsidies to renewable energy, there are two kinds of green. First there are some environmental greens who view the problem as so urgent that all measures that may have some impact on greenhouse gas emissions, whatever their cost or their impact on the economy and employment, should be undertaken immediately.
Then there are the fiscal greens, who, being cool to carbon taxes and cap-and-trade systems that make polluters pay, favour massive public subsidies to themselves for renewable energy projects, whatever their relative impact on greenhouse gas emissions. These two groups are motivated by different kinds of green. The only point of convergence between them is their support for massive subsidies to renewable energy (such as wind turbines).
This unholy alliance of these two kinds of greens (doomsdayers and rent seekers) makes for very effective, if opportunistic, politics (as reflected in the Ontario government’s Green Energy Act), just as it makes for lousy public policy: Politicians attempt to pick winners at our expense in a fast-moving technological landscape, instead of creating a socially efficient set of incentives to which we can all respond.
Michael J. Trebilcock is Professor of Law and Economics, University of Toronto. These comments were excerpted from a submission last night to the Ontario government’s legislative committee On Bill 150.
Read more here.
Feb 23, 2010
There’s no business like snow business
Anthony Watts, Watts Up With That
Headlines yesterday mentioned yet another new snowfall record: Moscow Covered by More Than Half Meter of Snow, Most Since 1966

Feb. 21 (Bloomberg) - Moscow’s streets were covered by 53 centimeters (20.9 inches) of snow this morning after 15 centimeters fell in 24 hours, putting Russia’s capital on course for its snowiest February since at least 1966.
Workers cleared a record 392,000 cubic meters (13.8 million cubic feet) of snow over the 24-hour period that ended this morning as precipitation exceeded the average February amount by 50 percent, according to state television station Rossiya 24. The city had 64 centimeters of snow cover on Feb. 23, 1966, the previous record, Rossiya 24 said.
In a story from Russia’s news agency, TASS, they mention that:
This year’s February is quite unique from the meteorological point of view. Not a single thaw has been registered so far and the temperature remains way below the average throughout the month.
I guess the Mayor of Moscow’s “Canute like” promise back in October didn’t work out so well. From Time magazine:
Moscow Mayor Promises a Winter Without Snow
Pigs still can’t fly, but this winter, the mayor of Moscow promises to keep it from snowing. For just a few million dollars, the mayor’s office will hire the Russian Air Force to spray a fine chemical mist over the clouds before they reach the capital, forcing them to dump their snow outside the city. Authorities say this will be a boon for Moscow, which is typically covered with a blanket of snow from November to March. Road crews won’t need to constantly clear the streets, and traffic - and quality of life - will undoubtedly improve.
So this winter’s heavy snow and cold in the NH is not just a US problem. It is interesting though to note that snow spin seems to span continents.
Before they were saying that increased winter snow is due to global warming, climate scientists were saying that decreased winter snow was due to global warming. As discussed already on WUWT, climate models predict declining winter snow cover. And a senior climate scientist predicted ten years ago :
According to Dr David Viner, a senior research scientist at the climatic research unit (CRU) of the University of East Anglia,within a few years winter snowfall will become “a very rare and exciting event”. “Children just aren’t going to know what snow is,” he said.
There is no shortage of similar claims:
Decline in Snowpack Is Blamed On Warming Using data collected over the past 50 years, the scientists confirmed that the mountains are getting more rain and less snow
Many Ski Resorts Heading Downhill as a Result of Global Warming
The prediction below was particularly entertaining, given that it was made during Aspen’s all time snowiest winter.
Tuesday, December 16, 2008
DENVER - A study of two Rocky Mountain ski resorts says climate change will mean shorter seasons and less snow on lower slopes. The study by two Colorado researchers says Aspen Mountain in Colorado and Park City in Utah will see dramatic changes even with a reduction in carbon emissions, which fuel climate change. Skiing at Aspen, with an average temperature 8.6 degrees higher than now, will be marginal.
Global Warming Poses Threat to Ski Resorts in the Alps Climatologists say the warming trend will become dramatic by 2020
Global Warming Poses Threat to Ski Resorts in the Alps - New York Times
Himalayan snow melting in winter too, say scientists Himalayan snow melting in winter too, say scientists - SciDev.Net
Global warming ‘past the point of no return’ Friday, 16 September 2005 Global warming ‘past the point of no return’ - Science, News - The Independent
So what are they saying now?
Global Warming could equal massive snow storms Great Lakes and Global Warming could equal massive snow storms
Snow is consistent with global warming, say scientists Britain may be in the grip of the coldest winter for 30 years and grappling with up to a foot of snow in some places but the extreme weather is entirely consistent with global warming, claim scientists. Snow is consistent with global warming, say scientists - Telegraph
Climate Scientist: Record-Setting Mid-Atlantic Snowfall Linked to Global Warming
The Blizzard of 1996 does indeed qualify as one type of extreme weather to be expected in a warmer climate Blame Global Warming for the Blizzard - NYTimes.com
The great thing about global warming is that you can blame anything on it, and then deny it later. See post and comments here.
See recent account of Snowmagedden here.
Feb 23, 2010
Record Setting AO and SOI combo creates a wild winter
By Joseph D’Aleo
In April 2009, we talked about Mt Redoubt’s eruption (and later Russia’s Sarychev) and the effect it might have on high latitude blocking and cooler summer and winter.

Climatologists may disagree on how much the recent global warming is natural or manmade but there is general agreement that volcanism constitutes a wildcard in climate, producing significant global scale cooling for at least a few years following a major eruption. However, there are some interesting seasonal and regional variations of the effects.
Oman et al (2005) and others have shown that though major volcanic eruptions seem to have their greatest cooling effect in the summer months, the location of the volcano determines whether the winters are colder or warmer over large parts of North America and Eurasia. According to their modeling, tropical region volcanoes like El Chichon and Pinatubo actually produce a warming in winter due to a tendency for a more positive North Atlantic Oscillation (NAO) and Arctic Oscillation (AO). In the positive phase of these large scale pressure oscillations, low pressure and cold air is trapped in high latitudes and the resulting more westerly jet stream winds drives milder maritime air into the continents.
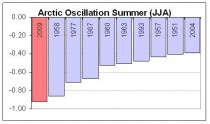
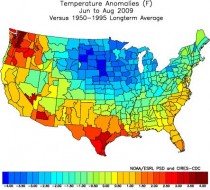
The summer of 2009 had the most negative AO since 1950. Which explains the cold summer (especially July) (below, enlarged here).
.
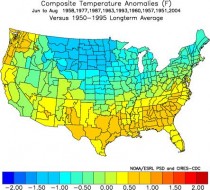
Summers with a very negative AO above have a cold anomaly centered in the nation’s midsection (below, enlarged here).
Last summer saw that pattern (below, enlarged here).
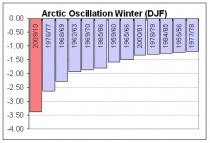
The AO has stayed very negative this winter. In fact again the most negative of any winter since 2009/10. It has averaged almost 3.5 standard deviations negative. In both December and February, it has reached more then 5 STD (below, enlarged here).
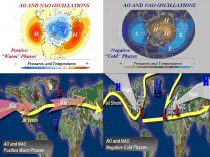
Negative AO/NAO winters are cold and often snowy in the US and Europe (below, enlarged here).
The strongest blocking years have a warm polar stratosphere and mid troposphere. Certainly that has been the case this year. (below, enlarged here).
The most negative years when composited show widespread cold (below, enlarged here).
This winter has been cold especially in the central and southeast through February 16th (below, enlarged here).
And certainly also all across Asia into Europe (below, enlarged here).
It also has been an El Nino year, the case in about half the top ten most negative AO years. The Southern Oscillation Index has dropped on a daily basis to an amazing 8 STD negative in early February. For the first 19 days, it has been most negative February since 1870.
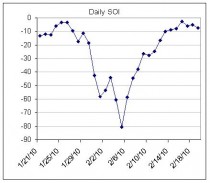
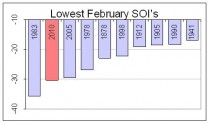
(Most negative SOI Februarys enlarged here).
The pattern show a good match this year to El Nino negative AO years (bottom right below, enlarged here).
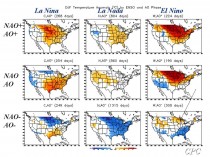
See more here. Listen to this PODCAST (episodes on left #21) on November 10 on WeatherJazz which I did with fellow meteorologist Andre Bernier on long range forecasting and the upcoming winter where we predicted east coast storms and a negative AO/NAO based on natural factors.
Feb 23, 2010
Brrrr, the thinking on climate is frozen solid
By Dominic Lawson, Times Online
Here’s how it is down our way. The oil tank that powers our central heating is running worryingly low, but for days fuel lorries have been unable to navigate the frozen track that links us to the nearest main road. We would have gained much welcome heat from incandescent light bulbs, but as those have been banned by the government as part of the “fight against climate change”, no such luck.
On the good side, the absence of delivered newspapers - even the faithful paperboy has given up the unequal struggle to reach us - means I won’t be getting any more headaches from attempting to read newsprint under the inadequate light shed by “low-energy” bulbs. Nevertheless, the news has reached our Sussex farmhouse that the Conservatives have already begun the general election campaign, covering hoardings nationwide with pictures of David Cameron looking serious.
Many will be appalled by the promise of months of being force-fed with party political argument. There is something much worse than being confronted with non-stop debate, however: it is the prospect of being offered no choice and no debate when all three main parties have the same policy. This is what happened in the general election of 1992, when the Conservative government and its Labour and Liberal Democrat opponents were united in the view that sterling should remain linked to the deutschmark via the exchange-rate mechanism (ERM). This had been forcing the unnecessary closure of thousands of businesses as Bank of England interest rates went up and up to maintain an exchange rate deemed morally virtuous by the entire political establishment - and, indeed, by every national newspaper.
As everyone now knows (and as we deeply unfashionable “ERM deniers” warned at the time), it would all end in tears. A few months after that general election, the re-elected Conservative government was compelled by the forces of reality to abandon this discredited bulwark of its economic policy, a humiliation that destroyed the Tories’ reputation for competence or even common sense.
Now, almost a generation later, we face another election in which the main parties are united in a single masochistic view: that the nation must cut its carbon emissions by 80% - this is what all but five MPs voted for in the Climate Change Act - to save not just ourselves but also the entire planet from global warming. For this to happen - to meet the terms of the act, I mean, not to “save the world” - the typical British family will have to pay thousands of pounds a year more in bills, since the cost of renewable energy is so much higher than that of oil, gas and coal.
The vast programme of wind turbines for which the bills are now coming in will not, by the way, avert the energy cut-offs declared last week by the national grid. Quite the opposite: as is often the case, the recent icy temperatures have been accompanied by negligible amounts of wind. If we had already decommissioned any of our fossil-fuel power stations and replaced them with wind power, we would now be facing a genuine civil emergency rather than merely inconvenience.

There are other portents of impending crisis caused entirely by the political fetish of carbon reduction. As noted in this column three weeks ago, the owners of the Corus steel company stand to gain up to $375m in European Union carbon credits for closing their plant in Redcar, only to be rewarded on a similar scale by the United Nations’ Clean Development Mechanism fund for switching such production to a new “clean” Indian steel plant. That’s right: the three main British political parties - under the mistaken impression that CO2 is itself a pollutant - are asking us to vote for them on the promise that they are committed to subsidise the closure of what is left of our own industrial base.
The collapse of the UN’s climate change summit in Copenhagen makes such a debacle all the more likely. Countries such as India, China and Brazil have made it clear they have not the slightest intention of rejecting the path to prosperity that the developed world has already taken: to use the cheapest sources of energy available to lift their peoples out of hardship, extreme poverty and isolation. Britons may be forced by their own government to cut their carbon emissions - equivalent to less than 2% of the world’s total; but we can forget about the idea that this will encourage any of those much bigger countries to defer their own rapid industrialisation.
Just as the British public never shared the politicians’ unanimous worship of the ERM totem (which is why the voters’ subsequent vengeance upon the governing Tories was implacable), so the public as a whole is much less convinced by the doctrine of man-made global warming than the Palace of Westminster affects to be: the most recent polls suggest only a minority of the population is convinced by the argument. This has caused some of the more passionate climate change catastrophists to question the virtues of democracy and to hanker after a dictatorial government that would treat such dissent as treason. As Professors Nico Stehr and Hans von Storch warned in Der Spiegel last month: “Climate policy must be compatible with democracy; otherwise the threat to civilisation will be much more than just changes to our physical environment.”
The threat of a gulf between a sceptical public and a political class determined - as it would see it - on saving us from the consequences of our own stupidity can have only been increased by the Arctic freeze that has enveloped not just Britain but also the rest of northern Europe, China and the United States. Of course one winter’s unexpected savagery does not in itself disprove any theories of man-made global warming, as the climate change gurus are hastily pointing out. Steve Dorling, of the University of East Anglia’s school of environmental sciences - yes, the UEA of “climategate” email fame - warns that it is “wrong to focus on single events, which are the product of natural variability”.
Quite so; but it would be easier to accept the point that a particular episode of extreme and unexpected cold was entirely due to “natural variations” if the UEA’s chaps had not been so adept at publicising every recent drought or heatwave as possible evidence of “man’s impact”, and if David Viner (then a senior climate scientist at UEA) had not made a headline in The Independent a decade ago by warning that in a few years “British children just aren’t going to know what snow is”.

A period of humility and even silence would be particularly welcome from the Met Office, our leading institutional advocate of the perils of man-made global warming, which had promised a “barbecue summer” in 2009 and one of the “warmest winters on record”. In fact, the Met still asserts we are in the midst of an unusually warm winter - as one of its staffers sniffily protested in an internet posting to a newspaper last week: “This will be the warmest winter in living memory, the data has already been recorded. For your information, we take the highest 15 readings between November and March and then produce an average. As November was a very seasonally warm month, then all the data will come from those readings.”
After reading this I printed it off and ran out into the snow to show it to my wife, who for some minutes had been unavailingly pounding up and down on our animals’ trough to break the ice. She seemed a bit miserable and, I thought, needed cheering up. “Darling,” I said, “the Met Office still insists that we are enjoying an unseasonably warm winter.”
“Well, why don’t you tell the animals, too?” she said. “Because that would mean they are drinking water instead of staring at a block of ice and I am not jumping up and down on it in front of them like an idiot.” See post here.
-------------------------
Bleak winter partly caused by El Nino could be worst for 31 years
By Paul Simons, Time Online Weatherman
The long, hard winter looks like dragging on into March. And if the bitter winds carry on for the next two weeks, there is a very good chance that this winter will turn out to be the coldest across the UK since 1979.
The National Trust reports that spring flowers have been set back by up to four weeks compared with recent years, although they expect that when some decent warmth arrives it could unleash a huge burst of flowering.
In the latest outbreak of wintry weather, heavy snow swamped much of the South West, Wales, the Midlands and parts of East Anglia, with the threat of ice on those roads not covered with snow. There’s a risk of a similar snowfall returning on Monday, stretching from the M4 corridor across Wales, the Midlands, East Anglia and parts of the North.

These snowfalls have come from a collision of wet, mild, Atlantic air smashing into freezing colder air stuck over northern parts of Britain. This stems from a problem that has plagued much of this winter - the weather patterns have become blocked and sent the jet stream running south.
Predicting weather ahead is in its infancy
This wind runs a few miles high and marks the battlefront between Arctic air and tropical air, and usually lies close to the UK during winter, delivering mild but wet weather. This winter, though, bitterly cold air from the Arctic thrust down into Europe and sent the jet stream off-course.
And the same happened in the eastern US, where the bitter cold has produced monster-sized snowfalls that have set new records in many places.
While much of Europe, North America and Asia have shivered, other places have been ridiculously warm. Just like squeezing a balloon, mild air has shifted to other regions such as Vancouver, where the Winter Olympics are in dire trouble with incredibly warm weather, heavy rains and fog.
The blame for this mess is partly thanks to El Nino, the warming of the tropical seas of the Pacific, which causes a huge upheaval in weather patterns across much of the globe.
This current El Nino is fairly powerful, and has swept warm air across Alaska and the West Coast of Canada, which is why Vancouver broke its record for the warmest January. Even the UK has caught the turmoil from El Niño, despite being thousands of miles away. Warm air from El Niño shot up into the stratosphere and shunted a surge of cold air from the Arctic down across the Continent and the UK this month.
Despite the snow and recent rain, this winter could turn out to be one of the driest on record, based on Met Office figures up to February 15. Although snowfalls through January and February were often heavy, they did not amount to much in terms of rainfall. Even showers forecast next week will not substantially change the average rainfall for the whole winter. Read post here.
Feb 17, 2010
IPCC’s latest great source: a newsletter than doesn’t even back its scare
Andrew Bolt, Herald Sun
The Air Vent discovers another supposedly impeccable, peer-reviewed source for the IPCC’s alarmist claims in its 2007 report. The claim in question:
Climate variability affects many segments of this growing economic sector [Tourism]. For example, wildfires in Colorado (2002) and British Columbia (2003) caused tens of millions of dollars in tourism losses by reducing visitation and destroying infrastructure (Associated Press, 2002; Butler, 2002; BC Stats, 2003).
The Air Vent:
That’s two newspaper articles and one tourism statistics newsletter. I can’t find the first two articles, one is an old AP story and the other was in a newspaper that folded last year.
That doesn’t sound very scientific. And, in fact, the one source able to be checked - and the only one dealing with the impact of fires in British Columbia - shows no evidence for the IPCC claim. Here is the relevant passage from BC Stats, 2003: Tourism Sector Monitor - November 2003, British Columbia Ministry of Management Services, Victoria, 11 pp. [Accessed 09.02.07]:

Tourism is a seasonal phenomenon. The wildfires unfortunately burned mostly during July, August and September, the three months of the year when most room revenues are typically generated. More precisely, establishments generated 38% of their annual room revenues in these three months between 1995 and 2001. Moreover, the forest fires were at their peak in August, also the peak month for tourism. Despite this bad timing, the peak of the 2003 season does not appear to be lower than the peak of previous years.
The Air Vent rightly concludes:
Once again, I am not saying that their claim is wrong. I am only underlining that their sources don’t match their claims. This shows that the IPCC already had a point of view, and they simply wanted a source to back up their claims. They found this BC Stats, probably didn’t read it because they figured it must show that fires reduce tourism, and cited it as the source of their claim. The IPCC makes a conclusion, then looks for evidence that supports their claims, and cite it. Sometimes they even cite evidence that doesn’t support their claims. Since no one read it for 2 years, they almost got away with it. This isn’t how a reputable scientific organization works.
Read Andrew’s post here.
|


