We are in the midst of history’s greatest wealth transfer. Government subsidized support for wind systems, solar arrays, and electric vehicles overwhelmingly benefits the wealthy members of society and rich nations. The poor and middle class pay for green energy programs with higher taxes and higher electricity and energy costs. Developing nations suffer environmental damage to deliver mined materials needed for renewables in rich nations.
Since 2000, the world has spent more than $5 trillion on green energy. More than 300,000 wind turbines have been erected, millions of solar arrays were installed, more than 25 million electric vehicles (EVs) have been sold, hundreds of thousands of acres of forest were cut down to produce biomass fuel, and about three percent of agricultural land is now used to produce biofuel for vehicles. The world spends about $1 trillion per year on green energy. Government subsidies run about $200 billion annually, with more than $1 trillion in subsidies spent over the last 20 years.
World leaders obsess over the need for a renewable energy transition to save the planet from human-caused global warming. Governments deliver an endless river of cash to promote adoption of green energy. The Inflation Reduction Act of 2022 provided $370 billion in subsidies and loans for renewables and EVs. But renewable subsidies and mandates overwhelmingly favor the rich members of society at the expense of the poor.
Wind systems receive production tax credits, property tax exemptions, and sometimes receive payments even when not generating electricity. Landowners receive as much as $8,000 per turbine each year from leases for wind systems on their land. Lease income can be quite high for a landowner with many turbines. In England, ordinary taxpayers pay hundreds of millions of pounds per year in taxes that are funneled as subsidies to wind companies and wealthy land owners.
In the US, 39 states currently have net metering laws. Net metering provides a credit for electricity generated by rooftop solar systems that is fed back into the grid. Solar generators typically get credits at the retail electricity rate, about 14 cents per kilowatt-hour. This is a subsidized rate, which is more than double the roughly five cents per kilowatt-hour earned by power plants. Apartment residents and homeowners that cannot afford to install rooftop solar pay higher electricity bills to subsidize homes that receive net metering credits. Rooftop solar owners also receive federal and state tax incentives, another wealth transfer from ordinary citizens.
US federal subsidies of up to $7,500 for each electric car purchased, along additional state subsidies, directly benefit EV buyers. The average price of an EV in the US last year was $66,000, which is out of reach for most drivers. A 2021 University of Chicago study found that California EV owners only drive 5,300 miles per year, less than half the mileage for a typical car. Most electric cars in the US are second cars for the rich.
A mid-size electric car needs a battery that weighs about a 1,000 pounds to provide acceptable driving range. Because of battery weight, EVs tend to be about 50 percent heavier than gasoline cars, which causes increased road damage. But EVs don’t pay the road tax included in the price of every gallon of gasoline. EVs should pay higher road taxes than traditional cars, but today this cost is borne by everyday gasoline car drivers.
Renewable systems require huge amounts of special metals. Electric car batteries need cobalt, nickel, and lithium to achieve high energy density and performance. Magnets in wind turbines require rare earth metals, such as neodymium and dysprosium. Large quantities of copper are essential for EV engines, batteries, wind and solar arrays, and electricity transmission systems to connect to remote wind and solar sites. According to the International Energy Agency, an EV requires about six times the special metals of a gasoline or diesel car. A wind array requires more than ten times the metals of a natural gas power plant on a delivered-electricity basis. The majority of these metals are mined in developing countries.
Almost 70 percent of cobalt is mined in the Democratic Republic of the Congo. Indonesia produces more than 30 percent of the world’s nickel. Chile produces 28 percent of the copper. China produces 60 percent of the rare earth metals. These nations struggle with serious air and water pollution from mining operations. Workers in mines also suffer from poor working conditions and the use of forced labor and child labor practices. But apparently no cost is too great so that rich people in developed nations can drive a Tesla.
To top it off, the European Union recently approved a Carbon Border Adjustment Mechanism (CBAM). The CBAM will tax goods coming from poor nations which aren’t manufactured using low-carbon processes. CBAM revenues will be a great source of funds for Europe’s green energy programs that benefit the wealthy.
In January, California, Connecticut, Hawaii, Illinois, Maryland, New York, and Washington proposed a wealth tax on billionaires. It’s interesting to note that all seven of these states mandate and heavily subsidize wind and solar arrays and electric vehicles, which transfer wealth from poor and middle-class residents to those same billionaires.
Steve Goreham is a speaker on energy, the environment, and public policy and author of the book Outside the Green Box: Rethinking Sustainable Development.
Since 2016, when acoustic sonar surveys required for construction of 1,500 wind turbines began on the U.S. Atlantic coast, 174 Humpback whales have washed ashore dead. This represents a 400 percent increase in mortalities from previous years. And then there are the highly endangered North Atlantic right whales, of which less than 400 individuals exist today. They recovered somewhat after being hunted to near extinction in the 1930’s, but now they are thought to be declining.
Federal government agencies such as the National Oceanic and Atmospheric Administration (NOAA) are authorizing the sonar surveys. Greenpeace, the organization I helped found in 1971, has sided with the wind turbines over the whales, stating there is no “proof” that sonar is involved in this tragedy. Here is a quote from a Greenpeace spokesperson:
“At this time, due to the lack of evidence suggesting harm from offshore wind development, Greenpeace’s position remains that the best way to protect whales is to create ocean sanctuaries, eliminate single-use plastics at the source, and stop our dependency on oil and gas.”
Perhaps it would be a good idea to put the “ocean sanctuaries” where the whales live.
It is a fact that mortalities among whales in this region are often caused by entanglement in fishnets and by vessel strikes. But a 400 percent increase in whale deaths, coincident with the sonar program, should cause environmentalists like Greenpeace to swing into action and spend some of their hundreds of millions on a thorough research program. Instead, they are doing nothing. Well, they do cruise around in their $30 million yacht which they call a “sailing vessel” even though there is an 1,850-horsepower diesel engine in the hold which provides the main propulsion.
It is understandable that federal agencies like NOAA would downplay the concern for the whales. The Biden administration is dead set on building all these contraptions even though they will be much more expensive and far less reliable than nuclear, hydroelectric, or fossil fuel generators.
Whales are acoustic species that use sonar to see the world around them. They have eyes for close-up recognition, but their sonar is how they navigate and speak to each other.
It is not only the sonar surveys that may pose a real problem for the whales. Depending on their size, each one of the 1,500 turbines will require a concrete base excavated into the ocean sediment up to 150 feet deep and 30-40 feet wide. This will clearly cause a huge amount of mud to be dispersed into the water column. Both these species of whales are of the baleen type. They are filter-feeders using their baleen to strain their food into their stomachs. The mud from these many excavations may interfere with their feeding and may also affect the species they depend on for food.
I sailed variously as navigator, first-mate and leader on all four Greenpeace campaigns to save the whales from 1975-1978. We went into the deep-sea Pacific for months at a time during the whaling season, sometimes 1,000 miles from land. We put ourselves in front of harpoons to protect the fleeing whales. When we arrived in San Francisco in early July 1975 with film footage of a harpoon going over the heads of our crew members in a small inflatable boat, and then into a Sperm Whale’s back, the images went around the world in a matter of hours. Greenpeace had arrived as a major player in the global ‘environmental movement’.
At the time we intervened in the Pacific whale slaughter, the Russian and Japanese whaling fleets together were killing about 30,000 whales annually. Many species - including blue whales, sei whales, fin whales and right whales - had been slaughtered to commercial extinction. Among the most commercially valuable whales, only the sperm whales, the largest toothed animals ever to exist on Earth, survived in large numbers. But they were certain to be all but wiped out if the hunts continued. The much smaller minke whales, which were never considered optimum by the big fleets, are still present in reasonable numbers
In 1979, the International Whaling Commission (IWC) banned the hunting of all species - except minke whales - by factory ships and declared the Indian Ocean a whale sanctuary. In 1982, the IWC adopted an indefinite global moratorium on all commercial whaling. Except for the right whales of the North Atlantic and North Pacific, all whale species are either fully recovered or well along in recovery.
I left Greenpeace when they began to refer to humans as “the enemies of the Earth,” a bit too much like “original sin” for me. To top it off, my fellow directors, none of whom had any formal science education, decided we should campaign to “ban chlorine worldwide.” They nicknamed chlorine “The Devil’s Element,” conveniently dismissing that chlorine is the most important of all the 90-plus naturally occurring elements for public health and medicine. I guess this doesn’t count for those who don’t like humankind.
Today, Greenpeace executives work in cushy offices and sail around like a bunch of college kids on a summer cruise. By siding with machines over living, endangered whales they have betrayed their founders and everyone who really cares about the natural world. Now more than ever, I am glad I left them behind in 1986, after 15 years of service. When it had its priorities right, Greenpeace was made up of voluntary crusaders for peace and nature. It has become a big business focused on fundraising, a backroom racket peddling junk science.
This commentary was first published at Washington Times, February 14, 2023, and can be accessed here.
Patrick Moore, Ph.D., ecology, is a co-founder of Greenpeace and was a director of Greenpeace from 1971 - 1986. He is a director of the CO2 Coalition, Arlington, Virginia, and author of several books, including “Fake Invisible Catastrophes and Threats of Doom,” which debunks scare stories used to instill fear.
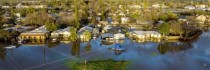
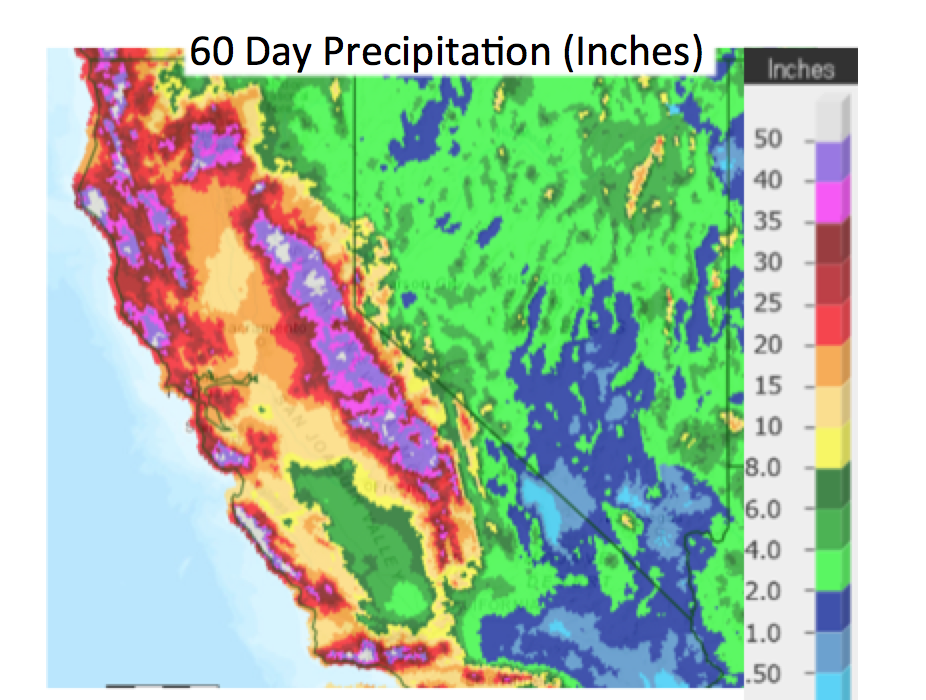
For more than three weeks, California has been pummeled by a series of storms arriving one after another from the Pacific Ocean. Torrential rains, mudslides, power outages, and floods plague state residents from north of San Francisco down to Los Angeles, 400 miles to the south. Scientists attribute this event to an “atmospheric river” condition in the Pacific Ocean. Many also claim that this phenomenon is due to human-caused climate change.
Following days of rain, floodwaters surround homes and vehicles in the Planada community of Merced County, Calif., on Tuesday, Jan. 10, 2023.
Enlarged
According to the National Oceanic and Atmospheric Administration, an atmospheric river is a long, narrow region in the atmosphere that can transport large amounts of water vapor, roughly equivalent to the average flow of water at the mouth of the Mississippi River. When atmospheric rivers make landfall, they release this water vapor in the form of rain or snow. An atmospheric river that forms in the tropics near Hawaii, sometimes called the Pineapple Express, can deliver large amounts of water to the U.S. West Coast.
This winter’s atmospheric river has been catastrophic. Ten different storms have stuck the California coast in the last three weeks. More than 20 people have died, thousands have been forced to evacuate their homes, and 25 million people are under a flood watch. The state averaged more than 11 inches of rain from late December to mid-January. The series of flooding storms were unexpected, following several years of severe drought in California.
Government leaders and some scientists blame human carbon dioxide emissions and climate change. In commenting on the flood damage, Gov. Gavin Newsom said California was “proof that the climate crisis was real and that we have to take it seriously.” When touring damaged areas last week, President Joe Biden stated, “If anybody doubts the climate is changing, they must have been asleep for the past couple of years.”
But this has happened before. Geologic evidence shows that massive floods occur in California every century or two. A historic cataclysmic event was the great flood of the winter of 1861-1862. During December and January of that winter, a series of massive storms slammed, one after another, into the west coast of the state. This occurred after two decades of drought during 1840-1860. The event would also be called an atmospheric river by today’s scientists.
During the great flood of 1861-1862, a train of storms dumped record amounts of rain on California. Sixty-six inches of rain fell on Los Angeles, more than four times the yearly average. In early January, the capital city of Sacramento was submerged under ten feet of water. Gov. Leland Stanford moved the legislature to San Francisco on Jan. 22 to wait for the floods to subside. Sacramento remained flooded for months.
William Brewer toured California’s Central Valley at the end of January 1862 by boat. He wrote that the entire valley was a lake from the mountains in the east to the coast range hills on the west up to the tops of the 20-foot-high telegraph poles. One-quarter of the state’s estimated 800,000 cattle drowned during the flood.
Of course, the 1861-1862 event could not have been caused by to human-made global warming. There were no coal-fired power plants or Sport Utility Vehicles and only a few wood- or coal-burning locomotives. Most transportation was by horse and horse-drawn wagon. World carbon dioxide emissions at that time were less than a million times smaller than today’s emissions from industry. The flood of 1861-1862 demonstrated the power of natural weather events in Earth’s chaotic climate.
The Merriam-Webster dictionary provides one definition of superstition as “a false conception of causation.” The current California atmospheric river event is very similar to the 1861-1862 occurrence, which could not have been caused by human emissions. There is no evidence that the current atmospheric river event is caused by human emissions either, but those afraid of human-caused climate change are claiming that this is the case.
It’s remarkable that so many intelligent people profess that the current California disaster is due to human-caused climate change. University professors, government officials, and the news media are among the believers. They seem to call every noteworthy weather event “extreme.” They may also tell you that if we all drive electric cars and build wind turbines everywhere, we can eliminate atmospheric river events. This can best be described as modern superstition, on the level of past beliefs that witches caused crop failures.
Instead, Californians must adapt to weather, as they have throughout history.
Steve Goreham is a speaker on the environment, business, and public policy and author of the book Outside the Green Box: Rethinking Sustainable Development.
"Last winter in England the weather was so pleasant, sweet and warm that people fancied the season was changed. There was no frost or snow the whole winter. Folks threw off their cloaks and went in the thinnest, lightest summer dress”. Sounds something like the non-winter that is being experienced in the northeast this year, only warmer! Those words are from an amazing publication by James A. Marusek “A chronological listing of early weather events”.
The excerpt from the publication describes the winter in England back in 1249. That’s right, 774 years ago. One can only imagine what would be written would such a warm and pleasant winter occur in current times. If you really want to read about the incredible natural variability that earth’s atmosphere can conjure up, I suggest you do a search of the above titled publication and read on. It’s truly an education not only about weather and its impact on humanity through the last 2,000 years but a lesson in climate as well.
The quote above “Everyone complains about the weather but nobody does anything about it” is almost universally attributed to Mark Twain. My research says it is not. The man that actually uttered those words was Charles Dudley Warner, a friend of Twain and a pallbearer at Twains funeral in 1910.
During Twains life, which began in 1835, there was a steady if not painstakingly slow advancement of the field of meteorology. On February 9th, 1870 Congress established what is now the National Weather Service. Twain was 35 years old.
A man by the name of Cleveland Abbe, born three years after Twain was appointed the first head of the new United States Weather Bureau on January 3rd, 1871. Abbe had a long and storied career as one of the most prominent early American meteorologists. In 1901 he proposed that the atmosphere in governed by the laws of hydrodynamics and thermodynamics, essentially the physics of fluid flow and heat transfer. He was fundamentally correct.
Another prominent early meteorologist that wanted to do something about the weather other than talk about it was and Englishman by the name of Lewis Fry Richardson. In 1922 he published Weather Prediction by Numerical Process. The publication advocated the solving of differential equations to predict the future of the weather. Essentially that is the method used to make todays weather forecasts.
The one giant inhibitor to accomplishing Richardson’s dream of numerical weather prediction was that he needed to make a massive number of computations in an era when only adding machines existed. There actually were computers in existence but the word “computer” back then was defined as a person that made calculations by hand!
Sometime, probably in the early 1920s he remarked “Perhaps some day in the dim future it will be possible to advance the computations faster than the weather advances and at a cost less than the saving to mankind due to the information gained. But that is a dream”.
That dream has become a reality and we live in it today. If only Dr. Richardson could see what we have accomplished in using his method of solving the differential equations with our extraordinary computing power. I’m sure his jaw would drop in absolute total amazement!
It was with the fulfillment of his remarkable insight into the future that the waves of storms impacting the state of California right now was accurately predicted up to a week in advance.
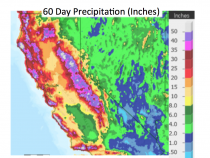
Back on December 29th, 2022 I wrote this. “Over the next 10 days the weather simulations are forecasting about 6 individual storm systems to impact California. The storms will come rolling in from the Pacific with large amounts of moisture and occasional strong winds. With this many storms indicated there’s the chance of 15 to 25 inches of precipitation in the Sierra Nevada mountains by the end of the first week of January! That much water would equate to 15 to 25 feet of snow, possibly more! And the parade of storms may not be done as we move into mid-January.”
Additionally, I wrote “The storms will be portrayed as destructive with mud slides, floods, blocked roads due to too much snow, avalanches death and mayhem caused by climate change (of course). Some of these events may take place but the benefits of all that water far outweighs any negative outcomes.”
Without the forward thinking of people like Professor Abbe and Dr. Richardson such a prediction would not have been possible. Today there is yet another one of these storms striking California with heavy rains, strong winds and heavy mountain snows. There is one more storm in the pipeline for Monday then it all comes to an end by Tuesday the 17th, at least for the foreseeable future!
The weather simulations that Dr. Richardson dreamed about one hundred years ago are envisioning a major change in the weather pattern over and around North America next week. The Jetstream that’s been generating storm after storm in the central Pacific Ocean then blowing them into the West Coast will be replaced next week. By next Thursday January 19th, the Jetstream that’s been soaking the west coast will shift and blow from west of Hawaii all the way up to British Columbia Canada then bend to the east and down into the Rocky Mountains region, cutting off the flow of moisture into California and ending the tumultuous period of stormy weather there.
Here in the east there will be reproductions of the change as well. Although it appears the principle storm track will continue to be to our west putting us on the warmer side of the storms the tracks of the storms may shift a little to the east. This could result in some of the storms weakening as they approach the eastern Great Lakes with a new center forming near the east coast over the water. This may result in what is known as coastal re-development.
If this is the pattern that results from the fundamental changes out west, there could be a trend to colder and more typical January weather for the second half of the month in New England. One only has to go back to the winter of 2014/15 to see what can happen almost overnight when a major weather patter shift takes place. This is an evolving situation so caution is advised before trying to read too much into what weather may be for the second half of January and into February.
So, remember the next time you hear “Everyone complains about the weather but nobody does anything about it” tell whoever said it to do a little research into the evolution of modern weather forecasting and they’ll discover that someone has done something about it!
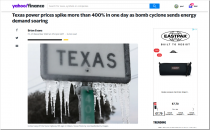
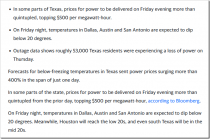
The emergency order from the US Energy Department allowed the state’s grid operator to exceed certain air pollution limits to boost generation amid record power demand in the state. The Electric Reliability Council of Texas, whose service area includes 90% of electric customers in Texas, requested the emergency order Friday, warning it may need to resort to blackouts. TRANSLATION - fire up more coal and gas plants!
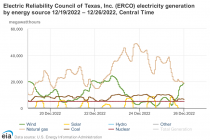
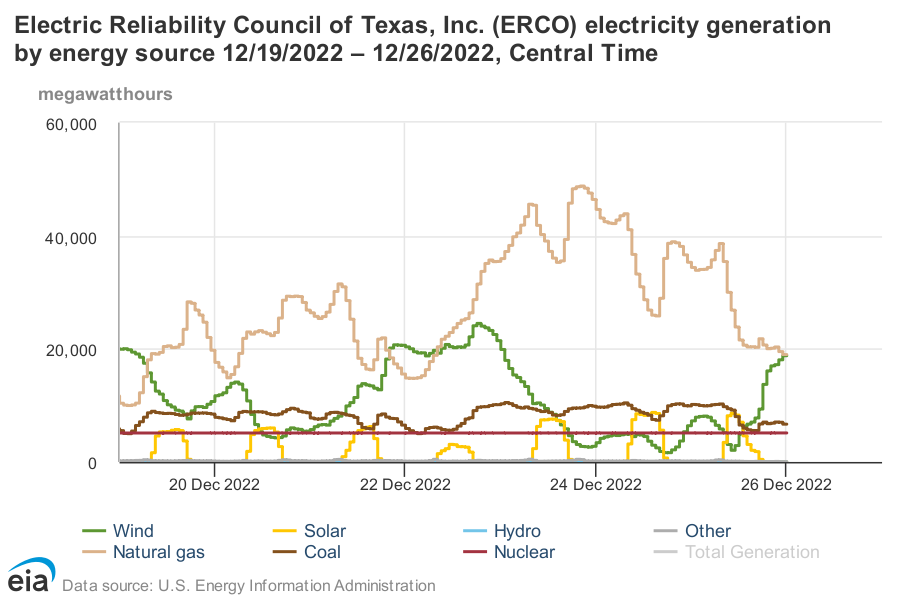
Fortunately a repetition of the blackouts last year was avoided. But as we can see, it was gas power which came to the rescue, as wind power collapsed to virtually nothing at the same time as demand surged:
Texas has 35 GW of wind capacity, but output was running below 5 GW throughout Saturday, and down to 2 GW for much of the day. This certainly was not due to lack of wind, quite the opposite in fact. Whether wind power collapsed because of the winds being too strong, or because of freezing up, I do not know. But either way it was a weather related issue.
Thankfully ERCOT was able to call on ample gas power capacity, both to replace the loss of wind power and meet surging demand, which peaked at 74 GW, about 15 GW more than normal.
Without that gas power, Texas would have faced a catastrophe.
You can forget about importing power from other regions as well, because the Arctic weather covered about two thirds of the country, so there would have been no surplus renewable power anywhere.
Joe Biden still wants carbon-free electricity by 2035. How many millions of Americans will freeze to death if he gets his way?
-----------------
WE DO NOT HAVE A POLLUTANT PROBLEM
America’s clean air might seem like a Christmas Miracle but it’s largely thanks to the innovation of America’s energy producers.
IER highlights, using EPA data, that between 1970 and 2021:
* U.S. gross domestic product (GDP) increased 292%.
* Vehicle miles traveled increased 191%.
* Energy consumption increased 59%.
* U.S. population increased by 46%.
“During the same period, total emissions of the six principal air pollutants dropped by 73%. Even with the increased use of our natural resources in almost every sector, U.S. air pollutant measurements are lower today than 50 years ago. It might very well be the greatest energy, economic and environmental success story you’ve never heard.”


