

By David Archibald
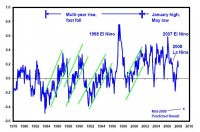
There are now 30 years of satellite data on global temperature. The graph below shows the University of Alabama Huntsville Microwave Sounding Unit (UAH MSU) results for the period 1978 to 2008.
See larger image here.
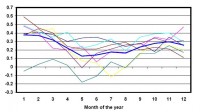
Examination of the record shows a change in character in 2001. Prior to that year, global temperatures tended to rise in a narrow band for a couple of years then have a relatively rapid fall. After 2001, temperatures tended to peak in January and then have a much wider annual range than previously. This is shown in the following graph:
See larger image here.
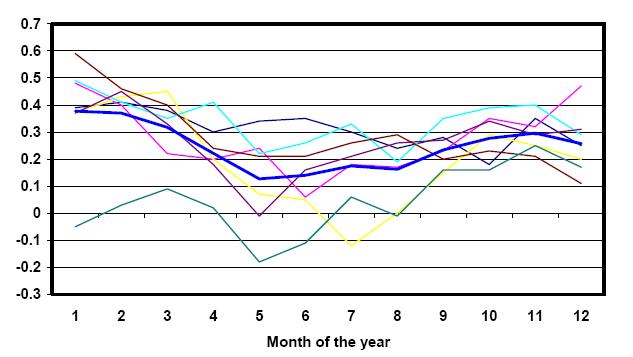
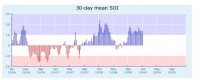
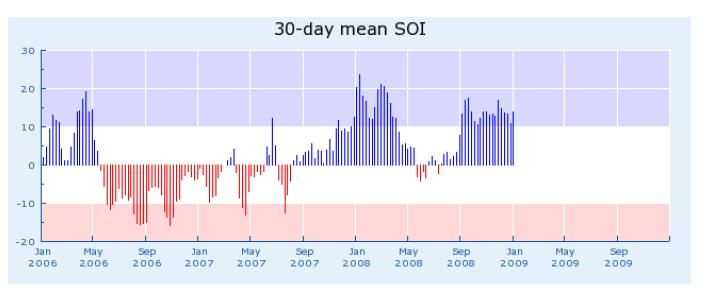
The above graph overlays the month to month results for the period 2002 to 2008, a total of seven years. The larger blue line is the average. For the last seven years, global temperature has tended to fall 0.3 of a degree between January and May, and then rise again to December. Departures from this are caused by El Nino and La Nina events. Just as the 2007 El Nino added 0.2C to the January 2007 result, the 2008 La Nina reduced temperatures in the first half of 2008 by 0.3C. The following figure shows the strength of the Southern Oscillation Index (SOI) which drives the formation of El Nino and La Nina events.
See larger image here.
Another large La Nina formed in late 2008. The combination of the annual pattern of temperature change and the current La Nina enables a short term forecast of the UAH MSU result to be made. The combination of a 0.3c response to the current La Nina and the usual 0.3C decline from January to May will result in a 0.6C decline to May 2009 to a result of -0.4C (0.4C below the long term average). See PDF here.
Let’s see if David can do better than the UKMO has done in recent years. UKMO is already talking a top 5 warmest 2009.