

Stephen Strum, Frontier Weather, Inc.
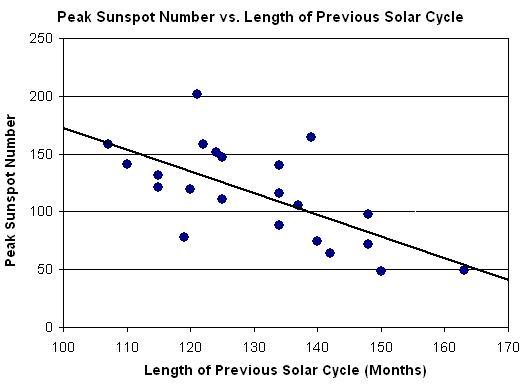
The most recent solar cycle, currently estimated to have reached a minimum in December 2008 based on a 12 month centered moving average of monthly sunspot numbers, was the longest solar cycle since 1798-1810, measured trough to trough. The cycle lasted approximately 150 months or 12.5 years, two full years longer than the 20th century average of 10.5 years. The impact of a long solar cycle is two-fold. First of all, there is a definite correlation between the length of one solar cycle and the peak sunspot number during the following cycle as the graph below (enlarged here) shows.
Only two solar cycles since 1750 have lasted as long as or longer than the most recent cycle, and both were followed by the weakest solar maximums of the past 250 years, a period during the early 1800s known as the Dalton Minimum. Given the length of the previous cycle, the upcoming solar cycle could be among the weakest on record since 1750 if the relationship holds. Additionally, of the last five solar cycles that persisted twelve or more months longer than average, four were followed by another cycle lasting longer than average. In every instance, however, the next solar cycle was somewhat shorter in length than the previous cycle.
Since net solar radiation is slightly higher during periods of heightened sunspot activity (and lower during periods of little sunspot activity), the combination of long solar cycles and low sunspot numbers results in cumulatively more months on a decadal time scale with below average net solar radiation. The result is that weak and long solar cycles lead to cooling on a global basis while short and intense solar cycles tend to result in warming on a global basis.
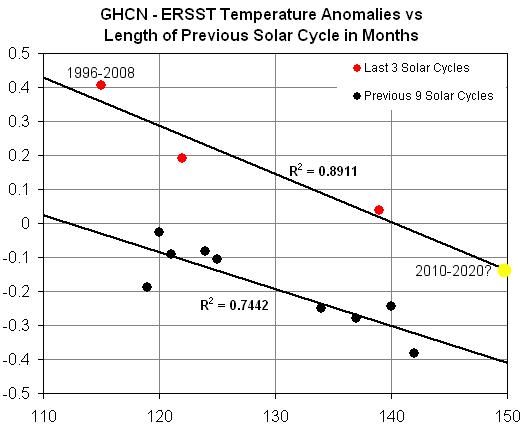
The following plot illustrates the relationship between the length of a given solar cycle and the average temperatures during the following solar cycle. Average global temperatures were calculated for each solar cycle (measured trough to trough) based on the GHCN-ERSST dataset (though the results are similar for the Hadley Center global temperature dataset) and compared to the length of the previous solar cycle. As can be seen, there is a solid relationship between solar cycle length and average global temperatures during the following solar cycle. This in turn leads to the possibility of using the solar cycle length as a means to at least partially predict temperature trends during the upcoming decade (enlarged here).
Besides the notable trend of cooler global temperatures following longer solar cycles and warmer global temperatures following shorter solar cycles, the other notable feature of the data is the distinctly higher temperature anomalies observed during the most recent three solar cycles. A trend line fitted through the most recent three solar cycles is nearly parallel to a trend line through the previous nine solar cycles, but is displaced 0.3-0.4°C higher. If the difference was purely the result of CO2 increases, a steadily increasing departure from the previous trend would be expected, and not a distinct jump and then a continuation of the old trend at a warmer temperature level. The timing of the data jump happens to be the mid-to-late 1970s, at a time of a noted global climate shift. The Pacific Decadal Oscillation changed from a negative to a positive phase at that time, and could explain part of the discrepancy. Improved ocean temperature estimates began during that time period as a result of satellite measurements, while at the same time a reduction in the number of land-based observation stations has occurred. Both of those factors, along with issues such as urban heat island growth could also play a role in the observed differences. There is also some chance that the apparent shift is simply an artifact of the limited number of data points. Finally, note that the warm 1996-2008 period followed the shortest solar cycle during the last 150 years. With the most recent solar cycle being the longest cycle of the past 200 or so years, the potential exists for significant global cooling during the upcoming decade. Even if the warmer trends of the past 30 years are utilized, below average global temperatures would still be possible during the next decade if the past trends hold.
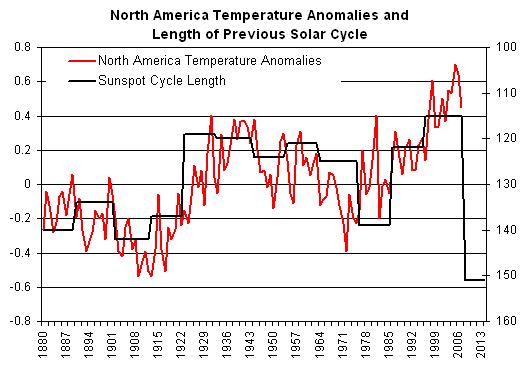
While not quite as distinct as on a global scale, temperature trends for North America also have closely followed trends in solar cycle length as the plot below demonstrates. While temperature anomalies will likely not decline as much as might be suggested by the solar cycle length curve, the long solar cycle could at least help to drive North America temperature anomalies back down towards the long-term average (enlarged here).

In conclusion, the upcoming decade will provide key data for research into both solar impacts on global climate and human-induced global warming. Since CO2 levels have been rising during a time of increasing solar activity, untangling the impacts of each on the global climate system is difficult. But, with rising CO2 levels and decreasing solar activity during the upcoming decade, the impacts of both should become more evident. See PDF here.
Data Sources:
Global and North America Temperature Anomaly Data.
Monthly Sunspot Number data.