

By Phillip F. Schewe
Glaciers are retreating and parts of the ice sheets on Greenland and Antarctica are melting into the ocean. This must result in a rise in sea level, but by how much? A new measurement of the gravity everywhere around the globe with a pair of orbiting satellites provides the first ever map detailing the rises across different parts of the globe.
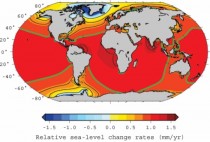
According to the new results, the annual world average sea level rise is about 1 millimeter, or about 0.04 of an inch. In some areas, such as the Pacific Ocean near the equator and the waters offshore from India and north of the Amazon River, the rise is larger. In some areas, such as the east coast of the United States, the sea level has actually dropped a bit over the past decade.
See enlarged here.
The surface of the sea is a constantly shifting fabric. To achieve a truer sense of how much the sea is changing in any one place, scientists measure the strength of gravity in that place. Measuring gravity over a patch of ocean or dry land provides an estimate of how much mass lies in that region. The measured mass depends on the presence of such things as mountains, glaciers, mineral deposits, and oceans.
If the gravity measurement for a place is changing, this could mean that the place is losing mass because of a retreating glacier or gaining mass if, as in the ocean surrounding Antarctica, new melt water is streaming in.
The Gravity Recovery and Climate Experiment, or GRACE for short, consists of a pair of satellites moving in an orbit that takes them over the South and North Poles. The two craft, nicknamed Tom and Jerry after the television cartoon characters, send constant signals to each other to determine their relative spacing to about 10 microns—one-tenth the width of a human hair—over a distance of 130 miles. If the first craft flies above a slightly more weighty area of the Earths’ surface—like a mountain range—it will be tugged a bit out of place, an effect picked up by a change in the relative spacing of the craft.
In these way monthly gravity maps of pieces of land or ocean about 180 miles wide can be made with high precision. The new report for the years of 2003-09 looks at how much mass has been lost from land areas and how much mass has been gained by ocean areas.
One of the authors of the report, Riccardo Riva from the Delft University of Technology in the Netherlands, said that average annual rise in sea level rise due to meltwater entering the ocean is about 1 millimeter, but that an additional rise will come from that fact that as the average temperature rises so does the ocean temperature, which in turn causes the volume of the ocean to increase.
“The most important result of the new report is the measurement of the sea level changes for specific regions of the Earth that are based on direct and global measurements of mass change,” Riva said.
Mark Tamisiea, who works at the National Oceanography Centre in Southampton, England, and was not involved in the GRACE work, believes the new report represents good research.
“As coastal sea level changes impact society, it is important for us to understand as much about the local differences from the global average as possible,” Tamisiea said. “These results are one piece in that puzzle.”
“GRACE is definitely the ‘real deal’ when it comes from measuring climate change from space,” said Joshua Willis, an ocean expert at the Jet Propulsion Laboratory in Pasadena, Calif. “This work by Dr. Riva and company reminds us that the world’s oceans don’t behave like a giant bathtub. As the ice melts and the water finds its way back to the ocean, the resulting sea level rise won’t be the same all over the world.”
“These effects are still small in today’s rising ocean, but as we look out over the next century, the patterns of sea level change due to melting ice will be magnified many times over as the ice sheets thin and melt,” Willis said.
Looking at the actual map of sea level rises presents an ironic twist. Offshore the areas where melting ice is most rapidly falling into the ocean—such as Greenland and Antarctica—the sea level appears to be falling.
“The main reason for this is the rebound of the solid Earth,” explained Riva. “Less ice causes the continents go up, and therefore sea level drops. Meltwater distributes around quite quickly, in most cases, so there is no accumulation due to that.”
More information: The new GRACE results appear in the journal Geophysical Research Letters.
Icecap Note: This is the equivalent of 4 inches per century well under the IPCC range of 7.5 to 23 inches. This is despite the fact that alarmists like Hansen and Gore claim sea levels are rising much faster than the IPCC projects.
Steve Goddard adds in Real Science:
For the period 1993 to 2003, the rate of sea level rise is estimated from observations with satellite altimetry as 3.1 plus/minus 0.7 mm yr–1, significantly higher than the average rate. The tide gauge record indicates that similar large rates have occurred in previous 10-year periods since 1950. It is unknown whether the higher rate in 1993 to 2003 is due to decadal variability or an increase in the longer-term trend.
That last sentence is a classic. They avoided the obvious answer that the higher rate from 1993-2003 was due to using a different methodology to generate the numbers. The older measurements are from tide gauges, and the newer ones are from satellite altimetry.
They failed to mention that tide gauges don’t agree with the satellite altimetry. They failed to mention that we don’t see much if any increase in rates from tide gauge data. They failed to provide any justification for the switch. They failed to provide any evidence that tide gauges are less reliable now than they were in the last century. They failed to do any verification of the accuracy of altimetry measurements.
This is just another IPCC nature trick - switching measurement systems to create an increase where there is none.