

Joseph D’Aleo, CCM
Most every area of the mid-latitudes will see summer heat during the high sun angle summer months. Some years the extremes are greater and more persistent. Ocean temperature patterns, solar drivers and local factors including soil moisture, and foehn wind events play a key role in extreme temperatures in summer.
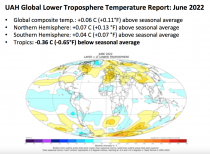
The summer this year June started out on the cool side in many areas including the tropics which averaged -0.65F colder than the 30 year average as measured by satellites. Some warmth was starting to show in the south central U.S and western Europe.
Enlarged
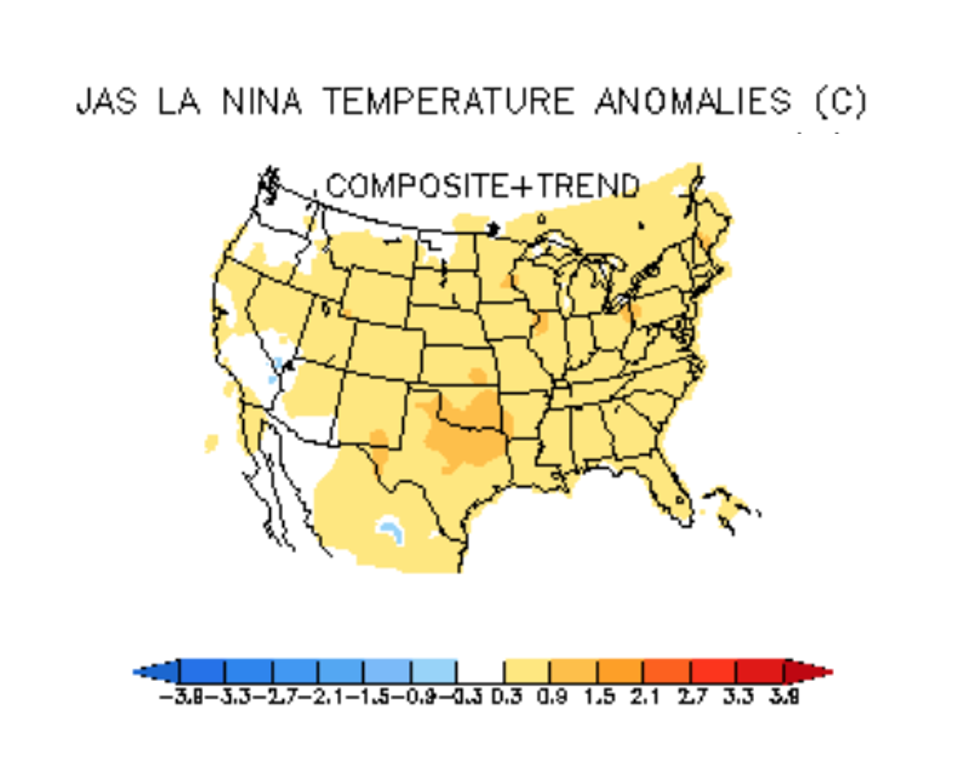
LA NINA SUMMERS
We are in the third year of ‘La Nina’. It is the strongest year of the event. Strong La Ninas have historically been hot and dry in the central states into the east. They produce more tornadoes in the spring and when the Atlantic is warm, more landfalling hurricanes in the east.
Enlarged
Indeed, the heat is augmented where the springs and early summers are drier than normal. The July to September mean temperature anomalies for La Ninas are shown here (CPC).

Enlarged
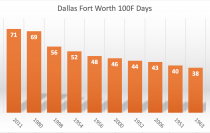
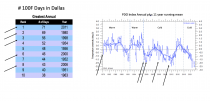
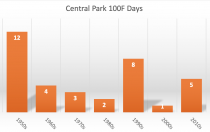
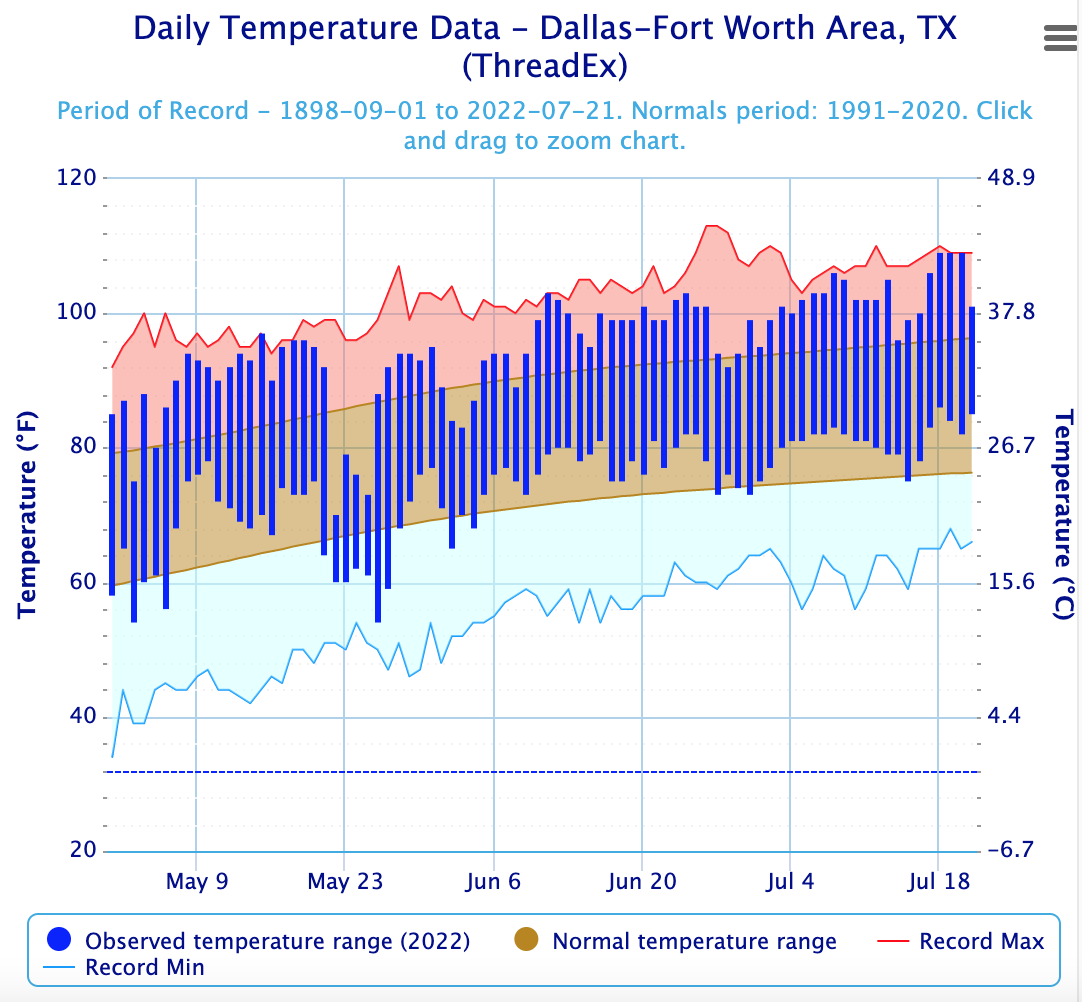
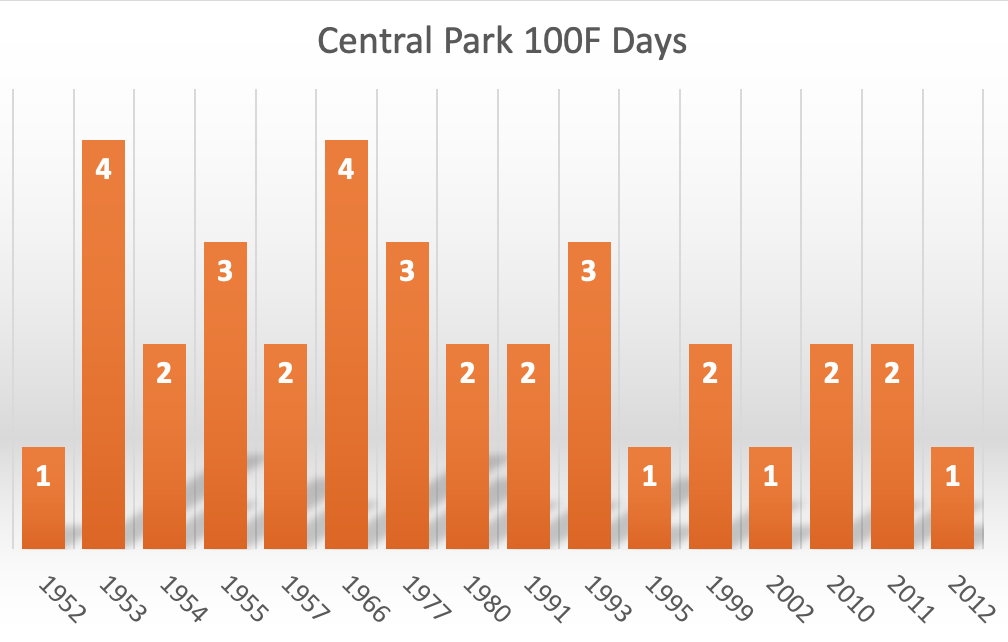
The Southern plains often see the most persistent heat in La Ninas. So far, there have been 26 100F days in Dallas, TX in 2022. No end is in sight until heavy rains develop and put out the fire. Some showers and storms yesterday lowered maximums a bit yesterday.
See how after a cold spell in May, it has been increasingly hot in Dallas.

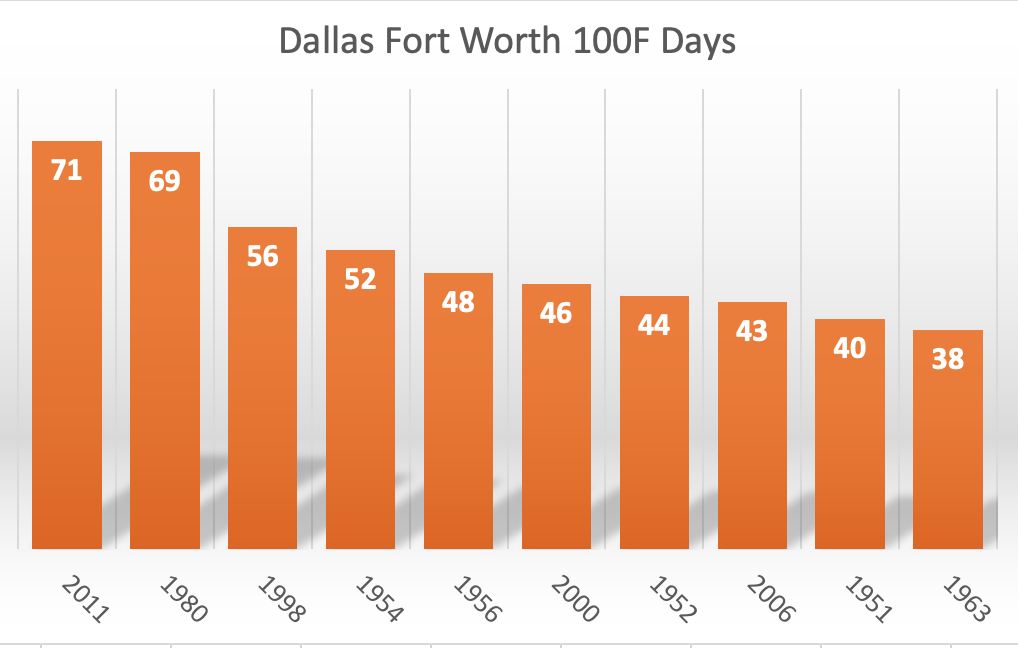
Models have more showers the next two weeks. But without an organized event (like a tropical event), it is difficult to get enough rains to suppress highs in mid-summer for longer periods. Dallas since 1950 has had as many as 71 days over 100F.
NUMBER OF 100F DAYS IN DALLAS SINCE 1950
All are La Nina years.
Enlarged
We can see below the hot summers were indeed in strong, multi-year La Ninas (negative MEI v2 (Multivariate ENSO Index) usually found in periods of a negative PDO (Pacific Decadal Oscillation).
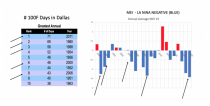
You can the MEI and the negative PDO are both the strongest since 1979 right side of the above graph). This was a strong event.
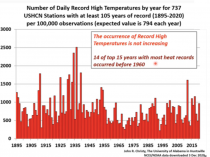
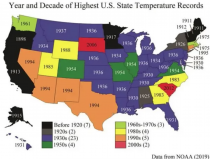
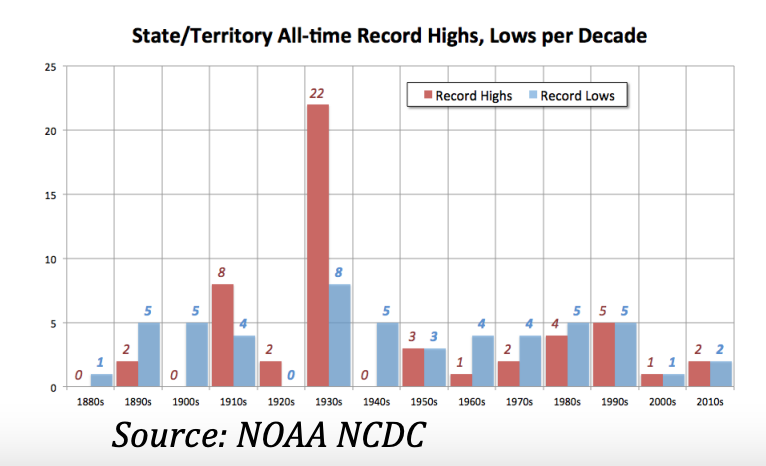
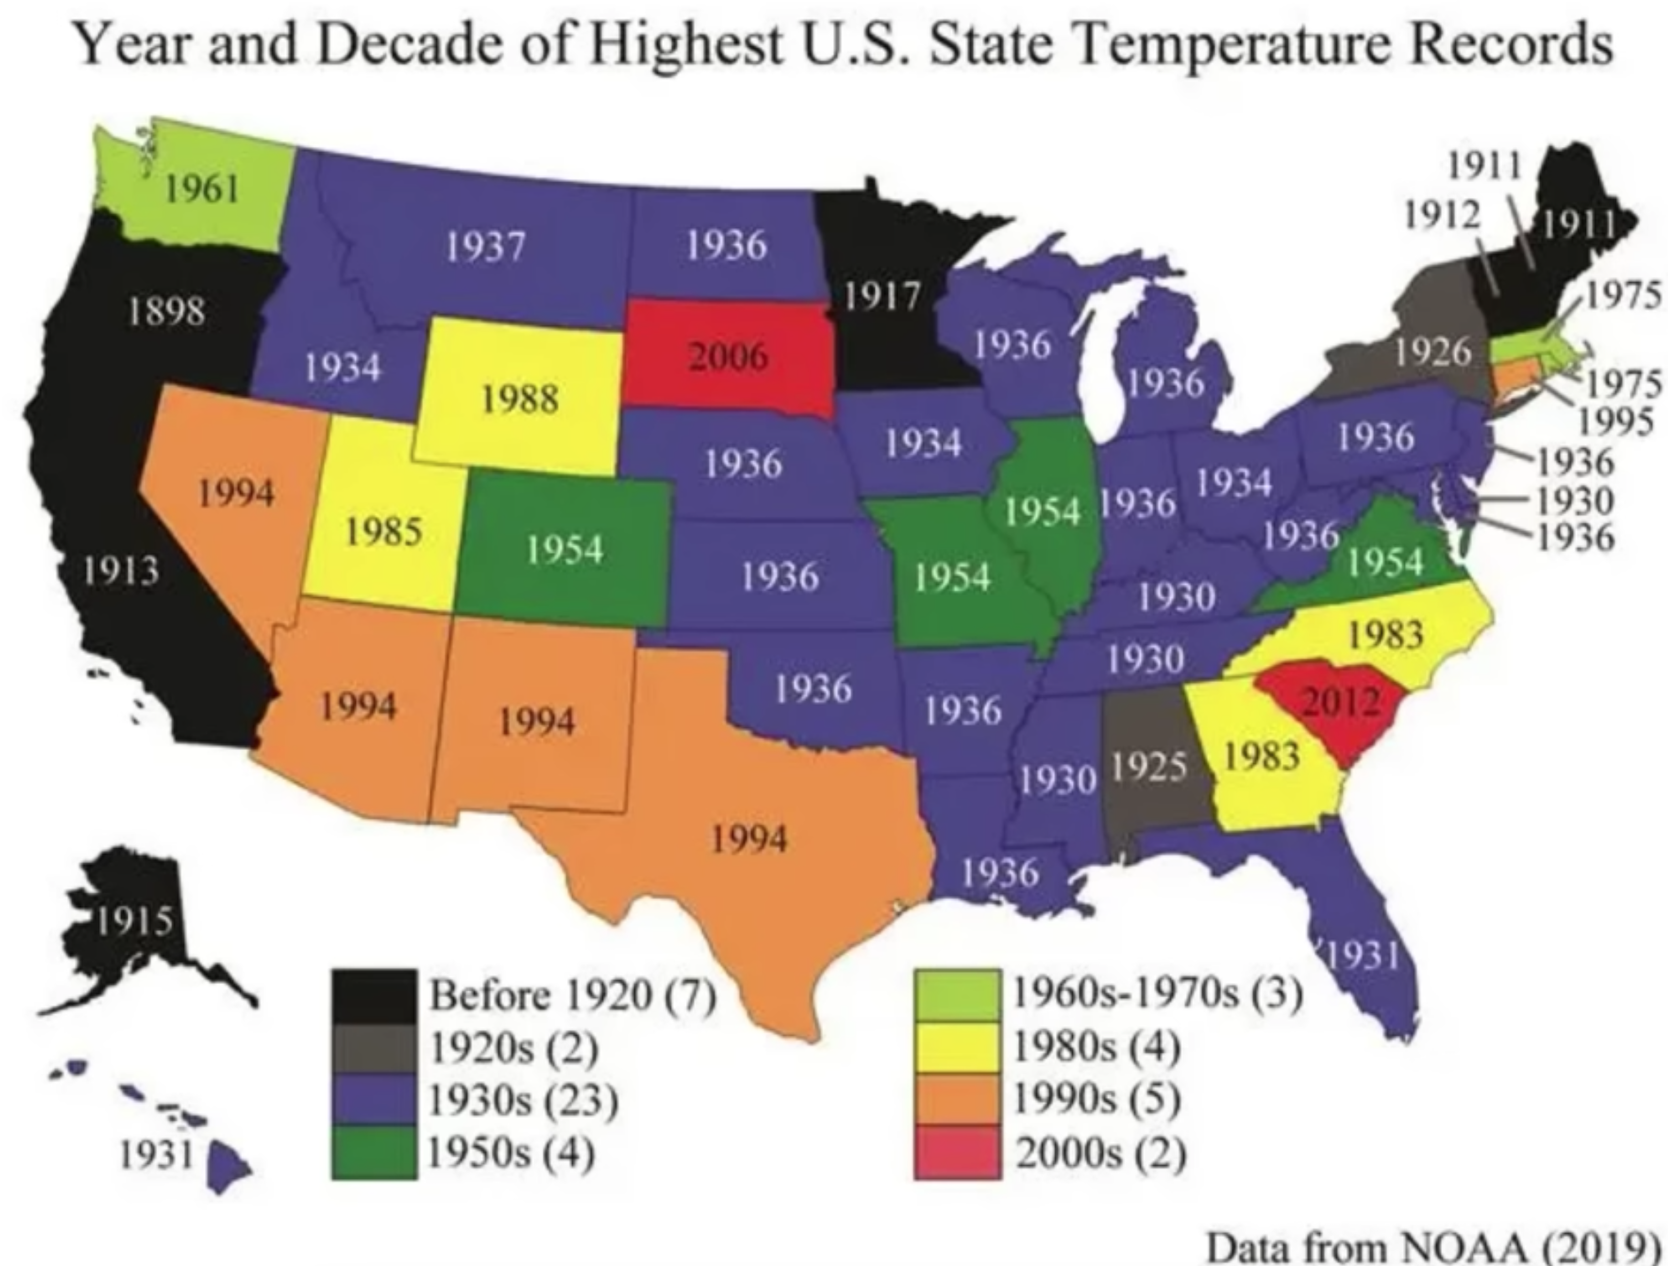
As the Dallas data showed, heat is not a new phenomenon nor getting more frequent. In fact, the warmest decade for Texas and the entire U.S. by far was the 1930s. 22 state/territory all-time heat records still reside in the record books in the 1930s. There have been more record lows since the 1940s than record highs.

The 1930s were extreme for the heat and the ‘dust bowl’. 14 of the 15 years with the most heat records occurred before 1960.
Even the EPA shows the heat of the 1930s.
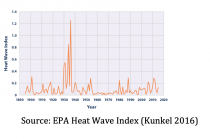
Enlarged
The mid 1930s were especially hot (and record cold in winter). Dryness accentuates both heat and cold.
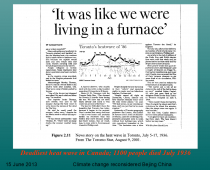
The Washington Post this week talked about the amazing heat of the summer of 1936 (following the coldest winter).
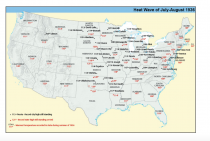
Enlarged
The summer of 1936 produced triple digit heat in 45 of the 48 CONUS states, most records that are still standing. 8 states saw highs over 120F!
The central heat in La Ninas often plumes north and east in mid-summer into the eastern U.S. and southeast Canada.
BAKED APPLE
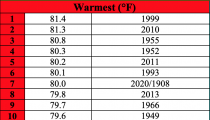
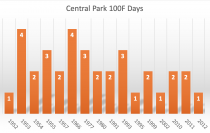
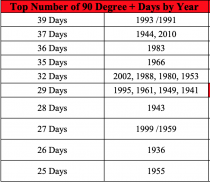
In NYC, 7 of the top 10 warmest Julys in Central Park occurred in La Nina summers. The other 3 were in years where ENSO was neutral and/or transitioning to La Nina. As of July 21, CPK has averaged 78.6F. 5 more hot days are forecast before temperature ease.
Central Park Warmest Julys
Enlarged
In Central Park, the 1950s was the hottest decade by far.
The current heat wave in the Big Apple in what had been a mostly moderate summer in the first half, will continue to Monday before the typical summer weather returns.
Central Park has had nine 90F days as of July 22, 2022. As many as 39 days have reached that level in the record.
LACK OF SOIL MOISTURE ACCENTUATES WARMING
The soil moisture is a key factor in summer. When the soil is dry, the sun’s energy warms the ground and is not consumed in evaporating moisture back into the air. It amplifies any heat building in an amplified pattern.
See the La Nina induced dryness effect on vegetation in the southern plains. Europe like the central US, has found itself in a part of the global wave pattern that has limited rainfall and enhanced the summer temperatures.
Enlarged
The UK is surrounded by water and often that limits the heat. However, the winds turned from off the warm continent into Britain for a few days last week and the temperatures spiked for two days until the maritime influence returned.
Enlarged
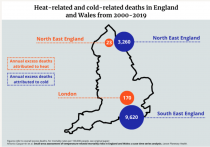
Even with the high heat, nights brought some relief. More seasonable air returned. In the UK, cold is a greater danger than heat especially as blackouts threaten in the winter when solar energy is limited given the latitude and cold often comes with little winds at night. Over 20% of the population are in energy poverty, often having to chose between heating and eating. Britain and most countries find 10 to 20 times more people die from cold than heat.
Enlarged
DOWNSLOPE WINDS IN THE WEST
The west U.S. west of the Cascades and to the south the Sierra Nevada normally has natural air conditioner working with the cool waters of the eastern Pacific. Only when a pressure pattern strong enough to force downslope winds does the heat develop to the coast. The air is warmed by compression of the air as it descends into higher pressure near the surface. These episodes are usually brief.
In late June 2021, a three-day heat wave besieged the near coastal areas of the droughty Pacific Northwest as a heat ridge set up in British Colombia on position to cause intermountain heat to sink down to the lower elevations with compression producing all-time record heat. See the brief heat burst in Seattle in late June.
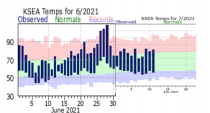
Enlarged
These local heat events are not uncommon and often are found in urban areas near mountains and especially in dry years.
This event led to new record highs in the coastal cities as downslope winds kept the ocean cooling at bay. Triple digit heat is common in summer in the intermountain away from the ocean influence. But occasionally some of that heat makes its way to the coast and is superheated by compression as it sinks downslope.
This event was similar to Sundowner, dubbed a “poison wind,” was reported June 17, 1859, by the Coastal Pilot of California. According to the report, the morning air temperature of 75 to 80 degrees rose steadily until about 1 p.m., when a series of superheated waves of wind blasted the Santa Barbara area.
By 2 p.m., the air temperature reached 133 degrees and hovered there for three hours, killing small animals, destroying fruit, ruining gardens and heavily damaging trees the newspaper reported. That year a similar powerful heat ridge likely forced the wind to sink off the mountains to the north and superheat just as we saw this June.
These events are usually brief and these local oddities not signs of man-made changes.
Many heat records occurred in locations where downslope winds add heat to transitory very warm air masses - found in the east coastal states of the United States, Canada, Europe, Asia, Africa, Australia and even the Antarctic Peninsula.
The metropolitan areas of the Mid-Atlantic and Northeast U.S., when heat ridges build east from the central in summer experience this compressional warming from downslope winds which also block any sea breezes. Most of the triple digit readings and high records here occur with west to northwest winds.
-----
Share this with those who need to hear the truth. Help us if you can.