Nov 16, 2008
An Energy Strategy for America
By Allan M.R. MacRae
The USA has two daunting problems - the greatest financial crisis since the Great Depression; and President-Elect Obama’s energy policies, which will severely deepen the economic crisis. Obama stated in a San Francisco Chronicle television interview that he wants to implement an aggressive CO2 cap-and-trade system that could bankrupt coal companies. He further stated that energy prices will necessarily skyrocket. Obama believes that global warming is a critical issue, and he supports the use of solar energy, wind power and biodiesel. To his credit, Obama also supports a market approach and technological development.
In 2007, US primary energy consumption consisted of oil (40%), natural gas (25%), coal (24%), nuclear (8%) and hydroelectricity (2%). As a percentage of total proved reserves of fossil fuels, the US holds just over 2% of the world’s oil, 3% of natural gas, but almost 29% of global coal. See this.
Energy projects have been constrained due to fears of catastrophic global warming, allegedly caused by increased atmospheric CO2 from burning fossil fuels. However, global warming is just not happening anymore. For the last decade, average global temperatures have not increased. Since January 2007 all global warming has disappeared, as average temperatures plummeted to 1979 levels - when accurate satellite measurements began.
Global cooling is now occurring and is expected to continue for the next twenty to thirty years, due to the recent shift in the Pacific Decadal Oscillation from its warm to cool phase. See here and here.
Despite shrill claims of ice cap melting, Arctic sea-ice extent is now at its highest seasonal level since modern satellite measurements began in 2002 – more evidence of global cooling. For decades, the US has experienced a huge balance of trade deficit, due primarily to high oil imports. Energy self-sufficiency has been the goal of recent US Presidents, without success. There is now an opportunity to address both these serious challenges, by rejecting global warming myths and creating an energy strategy based on true, verifiable facts. Here is the outline of a responsible and economic Energy Strategy for America:
1. Reject CO2 taxes and cap-and-trade measures used to “fight global warming”. Examine the satellite data, the only accurate global temperature measurements in existence. Climate Dyslexics please note: The Earth is cooling, not warming. Global cooling should last for twenty to thirty years and could be severe.
2. Generate much more electrical energy from abundant US coal reserves. Use existing technologies to control real atmospheric pollution from SOx, NOx and particulates, but do not control CO2. In the future, if CO2 sequestration becomes economically attractive (for enhanced oil recovery) or is proved necessary (in the unlikely event that global warming becomes a real problem), retrofit the coal plants with expensive CO2 recovery equipment at that time.
3. As rechargeable battery technology continues to improve, electric and gasoline-electric light vehicles will become commonplace. The power infrastructure already exists to fuel this fleet, and refueling can be done during off-peak periods, when power plants are underutilized. This major change in the light vehicle fleet will shift energy consumption from foreign oil to domestic coal.
4. Re-examine corn ethanol and wind power, which do not work economically or effectively. Corn ethanol for motor fuel requires huge ongoing subsidies and severely distorts food prices. Wind power also requires big subsidies, and almost 100% backup with conventional power generation. Wind power can also cause critical instabilities in the electric power grid. Conduct a full-life-cycle energy balance on corn ethanol, wind power, biodiesel and solar energy, and also examine the environmental demands and pollution associated with these so-called “green” technologies.
5. Re-examine hydrogen. It is an energy medium, like electricity, but if implemented would require a huge new hydrogen infrastructure to be built at great cost, for no environmental or energy gain.
6. Avoid energy subsidies, especially ongoing operating subsidies, which distort economic decisions and create expensive industrial and environmental boondoggles. Wind power and corn ethanol may prove to be two such costly mistakes.
Instead of skyrocketing energy prices, this Energy Strategy for America will result in lower costs, improved balance of trade, and in time could even provide energy self-sufficiency for the USA. Read more here.
Allan M.R. MacRae is a Professional Engineer and writer on energy and the environment. In 2002 he predicted in a newspaper article that global cooling would recur. He does not work in the coal industry, accepts no compensation for his writing and holds no coal investments
Nov 14, 2008
Sunspots Spell End of Climate Myth
The Dominion Post
It is disturbing that many recent statements on climate change by influential people are not supported by hard evidence. For instance, Professor Ralph Chapman’s statement that the globe risks a tipping point if emissions are not reduced by 2015 is unsupported by hard evidence, as is David Parker’s claim that if we do nothing to reduce emissions, New Zealand could be up to $500 million worse off by 2012. This is not true because, if we adopt the Emissions Trading Scheme, electricity bills alone will increase by more than $500 million each year.
These statements and government policies on greenhouse gases, carbon trading and promoting renewable energy are based on the beliefs that the world is warming due to man-made greenhouse gases; that promoting renewable energy will make a substantial difference to New Zealand’s greenhouse gas emissions; and that if New Zealand reduces its greenhouse gas emissions it would affect the world climate. All these beliefs are not true.
The evidence is unequivocal. Measurable, let alone dangerous, manmade global warming is not happening, and is not likely to happen in the future. The major cause for concern is the possibility of severe cooling. Global climate has always changed and recent climate changes are not unusual. The world was warmer in the mediaeval warm period, in the Roman warm period and on many occasions before then. During these periods agriculture and civilisations flourished. During cold periods like the little ice age there was famine, plague and war.
Both surface temperature records and the much more accurate records from satellite observations show there was a brief warming period from 1975-98. Since then, the world has cooled and is now at the same temperature it was in 1995. Nobody knows when, or if, world temperatures might increase. Since the research for the 2007 Intergovernmental Panel on Climate Change report was completed in mid 2006, researchers have discovered that warming since 1975 is not caused by greenhouse gases. Greenhouse gas warming would be at a maximum 10,000m above the tropics.
Observations from balloons and satellites have shown that warming is not happening. Therefore greenhouse gases such as carbon dioxide are not a major factor in the world climate. This fact alone is sufficient to sink the manmade global warming hypothesis. Computer-based climate models provide the only “evidence” supporting claims that the world is warming, that it will be dangerous, that there will be rapid rises in sea levels and the like, yet these same models failed to predict the temperature peak in 1998 and the steady cooling trend that set in from 2002. It is obvious that the models have failed to predict major climatic events such as El Nino (1998) and La Nina (2007-08). The models are not an accurate representation of the world climate system and their input data is inaccurate, therefore their outputs are worthless. This fact alone is sufficient to sink the manmade global warming hypothesis. Read more here.
Nov 14, 2008
Global Warning: We are Actually Heading Towards a New Ice Age, Claim Scientists!
The reactions below are to new study in journal Nature: Global warning: We are actually heading towards a new Ice Age, claim scientists! as reported in the UK Daily Mail on November 13, 2008.
In Andrew Revkin’s Dot.earth blog, a few predictable responses: Hansen’s Bold Claim: ‘Another ice age cannot occur unless humans go extinct’ and MIT’s Wunsch says study is ‘science fiction’
1) NASA’s James Hansen: “Another ice age cannot occur unless humans go extinct.”
2) Carl Wunsch of the Massachusetts Institute of Technology has fired quite a broadside: “Surely this isn’t science in any conventional sense. Taking a toy model and using it to make a “prediction” about something nearly a million years into the future, is a form of science fiction-maybe interesting in the same way a novel is, but it isn’t science. The prediction itself is untestable-except a million years from now, and the model “tests” that quoted are carefully chosen to be those things that the model has been tuned to get “right,” with no mention of the huge number of things it gets wrong. How many times do “if”, and “may” get used in the paper?
If I make a four-box model of the world economy, and predict the US stock market level 500 years from now, who would pay any attention? Climate is far more complicated than the world economy, yet supposedly reputable journals are publishing papers that superficially look like science, but which are the sort of thing scientists will speculate about late at night over a few beers. It doesn’t deserve the light of day except as the somewhat interesting mathematical behavior of a grossly over-simplified set of differential equations. Why should anyone take it seriously? The wider credibility of the science is ultimately undermined by such exercises.”
Hansen’s comments don’t merit a response. Wunsch though is a solid scientist and his comments have merit but as Dr. Roy Spencer so aptly put it “If you read Wunsch’s comments and replace “million years” with “hundred years”, his comments are a perfect description of the IPCC climate modeling process.
Nov 11, 2008
Hadley’s Phil Jones Whistling Past the Graveyard
Comments by Joe D’Aleo on Reuter’s story
2008 Set to be About 10th Warmest Year
By Alister Doyle, Reuters Environment Correspondent
This year is on track to be about the 10th warmest globally since records began in 1850 but gaps in Arctic data mean the world may be slightly underestimating global warming, a leading scientist said on Tuesday. A natural cooling of the Pacific Ocean known as La Nina kept a lid on temperatures in 2008 despite an underlying warming trend, said Phil Jones, director of the Climatic Research Unit at the University of East Anglia in England.
“This year is about 10th,” he told Reuters in a telephone interview. “La Nina in the Pacific lasted longer than we envisaged.” Jones’s unit is one of the main sources of global climate data for the United Nations. The warmest year on record was 1998, followed by 2005 and 2003, with other years this century closely bunched. Tenth place would make 2008 the least warm since 1999. The update marginally cools an estimate from January, when Jones’s unit and the British Met Office (Britain’s meteorological service) estimated that 2008 would be “another top 10 year,” near the bottom of the ranking.
The U.N. Climate Panel says human emissions of greenhouse gases, mainly from burning fossil fuels, are blanketing the planet. Rising temperatures will bring more floods, heatwaves, more powerful storms and rising sea levels, it says.
Jones said temperature records may fractionally underestimate warming because of gaps in measurements in the Arctic for 1961-90, the benchmark years for judging change, and problems in verifying ocean temperatures. “The world is probably a little warmer than we are measuring,” he said. Read more here of Jones spinning more tales.
Icecap Note: Recall it was Jones early in January 2007 who warned 2007 would be the warmest year on record and 2008 would surely end up top ten. At the risk of sounding like Andy Rooney, did you ever notice how they are always trying to find more warmth by finding proof that the high tropical atmosphere or ocean temperatures were measured wrong or find surrogates that prove it was cooler before and warmer now. How about looking at the known warm biases that dwarf these adjustments like a 66% station dropout, tenfold increase in missing data, little or no urbanization or land use change adjustment based on flawed science, no adjustments for changing from whitewash to latex paints for shelters or to new hygrometers with a known warm bias and bad siting. Even here in the US, recall Anthony Watts’ band of volunteers have found only 4% of the nearly 600 stations surveyed thus far met the government’s standards for ideal siting and 69% were poorly or very poorly sited. Why isn’t the same kind of attention paid to finding and correcting those errors.
The answer to that rhetorical question is that like at least half a dozen peer reviewed papers have shown, that would show that the warming is up to 50% exaggerated and that this might only be a top 20 or 30 warmest year. NOAA and NASA GISS are no better. Only the satellite data can be trusted but unfortunately it only goes back to 1979. NOAA (Karl and Petersen), NASA (Hansen and Schmidt), Hadley (Jones) have thrived on budgets fattened by the global warming issue. They have won the lottery and will do whatever it takes to keep the annuity checks coming.
Jones blamed El Nino and La Nina and a quiet sun for the cooling. A big step forward. But what he doesn’t realize that given the switch to a cool PDO, there will be more cooling La Ninas which with a sun going into a 200 year Dalton Minimum like slumber, will ensure the cooling continues. Download post here.
Nov 11, 2008
Year Thus Far Cold, Hansen Up to Old Shenanigans in October
By Joseph D’Aleo
NOAA shows the first ten months of the year were cold over many areas of the country from the Northwest to the Central States. Above normal temperatures were confined to sections of the east and southwest.
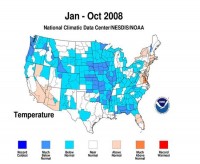
See larger image here
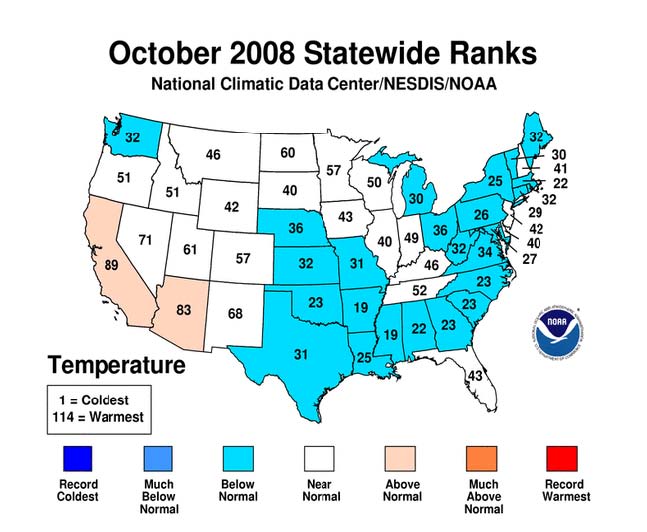
October was a cold month in many areas of the east and central states. For the nation as a whole, the average October temperature of 54.5 degrees F was 0.3 degree F below the 20th Century average, based on preliminary data.

See larger image here
Globally October in most data bases maintained about the same level as September with one glaring exception, Hansen’s NASA GISS. There may be a second high value in the next few weeks, NOAA GHCN shares many of the same data points and adjustments or lack thereof will probably come in on the high side. Hadley Centre also will not report also for another week. It has remained more in line with the satellite in recent years.
The data bases all have different base periods, which contribute to the relative differences. NASA uses the coldest base period 1951 to 1980, Hadley the second coldest 1961 to 1990, UAH and RSS MSU the warmest 1979 to 1998.
It was mild in parts of southeast Europe and Asia in October. The arctic ice developed at a record pace in October, but snowcover was slow to increase until the last week. It has now quickly expanded to just above the normal for the hemisphere for the date. See latest plots of FSU snow data for the date here.
The plot of temperatures since 2002 is remarkable for the departures shown. NASA GISS is a full degree F warmer than the satellite measurements, which continue the downtrend of 0.2C since 2002. Even with the bogus warmth, GISS depicts a small downtrend.
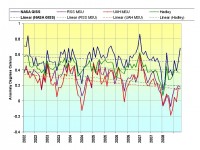
See larger image here
See this Watts Up With That guest post by John Goetz and read the interesting comments on Hansen’s folly. He provides the following update:
Update: Thanks to an email from John S. - a patron of climateaudit.org - we have learned that the Russian data in NOAA’s GHCN v2.mean dataset is corrupted. For most (if not all) stations in Russia, the September data has been replicated as October data, artificially raising the October temperature many degrees. GISS has corrected that data but meanwhile found more compensating warmth in the arctic, Canada and Australia (late data arrival). The reduction was only to +0.68C See more here. See also coverage of this NOAA/NASA error at Climate Audit here.
|

