Jan 18, 2014
An Admission: Nature in Control
Joe Bastardi, Patriot Post
This article caught my eye. Its authors examine reasons for the pause in global warming, and coincidentally, the sun, the oceans and stochastic events show up. I say coincidentally because that’s exactly what I opined would cause cooling, and got roundly trashed for by global warming proponents, seven years ago on The O’Reilly Factor in what I termed the triple crown of cooling.
This article on the matter is from May 2010. The idea was first presented in 2007. The factors contributing to the triple crown of cooling : 1.) oceanic cycles; 2.) solar cycles; and 3.) a wild card: volcanic activity.
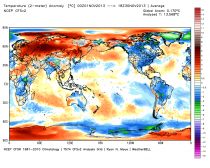
Since 2005, temperatures have done this:

Enlarged
How do you deny this? The aforementioned article doesn’t; its authors simply try to say the heat is “hiding in the ocean.” Yet we see Dr. Bill Gray from the 1970s opining that this is what happens naturally in his ideas on the Meridional Overturning Circulation, which is summed up nicely in this latest paper. (Translated: When it cools in one part of the ocean, it warms in another, and vice versa). I guess the authors of the above study have not read, or dismissed, Dr. Gray’s ideas. - odd given what Dr. Gray predicted in the ‘70s turned out to be right.
All these are perfectly logical, natural and, most importantly, scientifically sound explanations that are being passed off as AGW-induced. So why is the “come to God moment” of the National Center for Atmospheric Research (NCAR) immediately accepted, but the ideas of one who was right from 40 years ago is not?
I was hammered by the Left when I took a stand on this. Basically, they are admitting we are right. By acknowledging the sun, the oceans and other non-human based events are causing this, they are simply admitting that these control whatever CO2 is purported to do. No one denies the climate is fluid. No one denies CO2 does play some role in the magnificent setup that makes life possible on Earth and its contribution to the estimated 33 degree Celsius of warming greenhouse gasses add to the temperature of the planet. (99Water vapor being 100 times more prominent than CO2, carbon dioxide’s part varies from .4 to .7 of the warming.) But there is no tipping point, nor is one even truly possible given the nature of the entire system. But in showing the explanation for why the warming has paused, and deflecting it to other areas, they are: a.) now telling us something they did not tell us before, which of course means we have spent 17 years taking precautions against a dire forecast they issued that has not materialized; b.) they are admitting that nature can control what input man has; and c.) they are listing the very reasons I brought up seven years ago, and became an object of targeted attacks by many, as the reason the pause has taken place.
So what happens when we continue to be right? Where will the blame be placed then? When does the statue of limitations run out on what has been a huge anchor on our nation?
My forecast remains the same: That as measured by objective satellite, the global temperature by 2030 will return to where it was in 1978. It’s intuitive that the sun, oceans and stochastic events all have much more influence than a gas increasing at 1.8 parts per million a year, with the increase yearly a smaller percentage of the total (as the total grows, its percentage does not unless the increase grows). The fact is, it’s boxed in by all that is natural around it, and that’s the message of the so-called pause (and of late, the reversal).
Notes and asides: This cold winter was loudly forecasted by Weatherbell along with the major cold shots well in advance, and the ones to follow in the coming couple of weeks which I believe will cause a great deal of economic impact, as well as take its toll in other areas. I want to assure you, I used no CO2 in the preparation of the forecast, nor was CO2 involved in any of the considerations that lead to the forecast. See? I am trying to keep my carbon footprint small.
Joe Bastardi is chief forecaster at WeatherBELL Analytics, a meteorological consulting firm.
Jan 09, 2014
Are we weather wimps?
Seth Borenstein
Icecap Note: The United States has cooled for what will be 18 years this winter. Every one of the 9 climate regions has a downtrend. We have broken all snow records. See the story on how this decade is already the snowiest ever for high impact east coast snows. The cooling will accelerate as the Atlantic joins the Pacific and as the German and Russian scientists predict, the sun continues its dive into a Maunder or at least Dalton like Minimum. This cooling is related entirely to the cooling Pacific and occurring despite the fact we have not had major volcanic activity since Pinatubo in 1991.As the other dominos fall and if a major volcano occurs, the cold we saw this past week will be commonplace and even more severe. The government’s energy policy threatens to create great pain as we found in the EU where the renewable energy push has been much greater and energy prices skyrocketed. They have had more severe winters the past 5 years with many pushed into energy poverty and a heavy death toll. The elderly living on a fixed budget and the poor will suffer the most. Seth, you and Jeff Masters, Andrew Dessler, Katharine Hayhoe and Jennifer Francis can take the blame when that happens.
It’s time for hibernate
Posted on January 10, 2014 by Harold Ambler
If one thing became clear during the recent cold snap, it was that people would sort of, kind of like to learn more about meteorology. Even Al Roker seemed interested, with his (fully inaccurate, but whatever) talk of winter hurricanes. In other words, while the weather itself wasn’t new, the urge to put labels on it, in the era of perceived climate change, was suddenly epic.
For those who may have cringed through the labeling mayhem and rather conventional outbreak of winter weather, I hope the polar vortex rap video above will salve the wounds. I know it did mine.
If you need further assistance feeling better, you could always read a book about climate cycles and the chances of global cooling in the next few decades.
WASHINGTON (AP) - We’ve become weather wimps.
As the world warms, the United States is getting fewer bitter cold spells like the one that gripped much of the nation this week. So when a deep freeze strikes, scientists say, it seems more unprecedented than it really is. An Associated Press analysis of the daily national winter temperature shows that cold extremes have happened about once every four years since 1900.
Until recently.
When computer models estimated that the national average daily temperature for the Lower 48 states dropped to 17.9 degrees on Monday, it was the first deep freeze of that magnitude in 17 years, according to Greg Carbin, warning meteorologist for the National Oceanic and Atmospheric Administration.
That stretch - from Jan. 13, 1997 to Monday - is by far the longest the U.S. has gone without the national average plunging below 18 degrees, according to a database of daytime winter temperatures starting in January 1900.
In the past 115 years, there have been 58 days when the national average temperature dropped below 18. Carbin said those occurrences often happen in periods that last several days so it makes more sense to talk about cold outbreaks instead of cold days. There have been 27 distinct cold snaps.
Between 1970 and 1989, a dozen such events occurred, but there were only two in the 1990s and then none until Monday.
“These types of events have actually become more infrequent than they were in the past,” said Carbin, who works at the Storm Prediction Center in Norman, Okla. “This is why there was such a big buzz because people have such short memories.”
Said Jeff Masters, meteorology director of the private firm Weather Underground: “It’s become a lot harder to get these extreme (cold) outbreaks in a planet that’s warming.”
And Monday’s breathtaking chill? It was merely the 55th coldest day - averaged for the continental United States - since 1900.
The coldest day for the Lower 48 since 1900 - as calculated by the computer models - was 12 degrees on Christmas Eve 1983, nearly 6 degrees chillier than Monday.
The average daytime winter temperature is about 33 degrees, according to Carbin’s database.
There have been far more unusually warm winter days in the U.S. than unusually cold ones.
Since Jan. 1, 2000, only two days have ranked in the top 100 coldest: Monday and Tuesday. But there have been 13 in the top 100 warmest winter days, including the warmest since 1900: Dec. 3, 2012. And that pattern is exactly what climate scientists have been saying for years, that the world will get more warm extremes and fewer cold extremes.
Nine of 11 outside climate scientists and meteorologists who reviewed the data for the AP said it showed that as the world warms from heat-trapping gas spewed by the burning of fossil fuels, winters are becoming milder. The world is getting more warm extremes and fewer cold extremes, they said.
“We expect to see a lengthening of time between cold air outbreaks due to a warming climate, but 17 years between outbreaks is probably partially due to an unusual amount of natural variability,” or luck, Masters said in an email. “I expect we’ll go far fewer than 17 years before seeing the next cold air outbreak of this intensity.”
And the scientists dismiss global warming skeptics who claim one or two cold days somehow disproves climate change.
“When your hands are freezing off trying to scrape the ice off your car, it can be all too tempting to say, “Where’s global warming now? I could use a little of that!’ But you know what? It’s not as cold as it used to be anymore,” Texas Tech University climate scientist Katharine Hayhoe said in an email.
The recent cold spell, which was triggered by a frigid air mass known as the polar vortex that wandered way south of normal, could also be related to a relatively new theory that may prove a weather wild card, said Rutgers University climate scientist Jennifer Francis. Her theory, which has divided mainstream climate scientists, says that melting Arctic sea ice is changing polar weather, moving the jet stream and causing “more weirdness.”
Ryan Maue, a meteorologist with the private firm Weather Bell Analytics who is skeptical about blaming global warming for weather extremes, dismisses Francis’ theory and said he has concerns about the accuracy of Carbin’s database. Maue has his own daily U.S. average temperature showing that Monday was colder than Carbin’s calculations.
Still, he acknowledged that cold nationwide temperatures “occurred with more regularity in the past.”
Many climate scientists say Americans are weather weenies who forgot what a truly cold winter is like.
“I think that people’s memory about climate is really terrible,” Texas A&M University climate scientist Andrew Dessler wrote in an email. “So I think this cold event feels more extreme than it actually is because we’re just not used to really cold winters anymore.”
Better get used to it Andrew, Katharine, Jennifer, Jeff and Seth.
--------
Today the White House joined in - after all they have been behind the big lie:
What’s a polar vortex?
Want to know more about the frigid blast of air that’s been sweeping the country this week?
Dr. John Holdren, Director of the White House Office of Science and Technology Policy, has got answers for you—including what all of this has to do with global warming. (You’re going to want to see this one.)
Holdren is one of the least qualified science advisors ever, not surprising for the most scientific illiterate, ideologically driven administration in history.
Find out more about the polar vortex—in under two minutes.
Watch: What’s a polar vortex?
Still have questions? Make sure you join us tomorrow, January 10 at 2 p.m. ET for We the Geeks: “Polar Vortex” and Extreme Weather.
We’ll be joined by leading meteorologists, climate scientists, and weather experts to chat about why temperatures dipped to such frigid lows this week, how weather experts turn raw data into useful forecasts, and what we know about extreme weather events in the context of a changing climate. Join us tomorrow at 2 p.m. ET at WhiteHouse.gov/We-the-Geeks. Mostly very light weights playing expert. Clueless or ruthless administration and clueless ‘scientists’.
This message was blasted out by the administration to many scientists, infuriating those I heard from.
Jan 07, 2014
Expedition Fiasco Leader Professor Chris Turney Fibs Yet Again
By P Gosselin on 6. Januar 2014
Journal Nature can no longer be bothered to check facts anymore. Bad enough that they rarely subject global warming climate papers to real, rigorous peer-review, and so now even the most obvious rubbish gets by.
In a Nature comment, Professor Turney seems to be responding in part to harsh articles published by Cambridge University News and the The Mail on Sunday. Both these media outlets cited veteran polar explorer Robert Headland, who said “an ice-strengthened ship was totally unsuitable for the area where Turney conducted his expedition”.
Headland also accused Turney of carrying out the expedition “on the cheap” and that he had “needlessly taken many risks”.
In Turney’s Nature reaction to all the criticism, This was no pleasure cruise, Turney writes the following (my emphasis):
“For the past six weeks on board the Russian icebreaker MV Akademik Shokalskiy, my colleague Chris Fogwill and I have led a team of scientists, science communicators and volunteers on a voyage from the New Zealand subantarctic islands to the East Antarctic Ice Sheet.”
Turney claims that the ship is an icebreaker when clearly it is not. That’s a falsehood, if not an outright lie. The fact is that the Akademik Shokalskiy is simply reinforced for travel in icy areas and has only the lowly UL rating, meaning it is suitable for “independent navigation in the Arctic in summer and autumn in light ice conditions and in the non-arctic freezing seas all the year round”, see www.globalsecurity.org.
In the Nature comment Turney also writes
“That is the reality of polar science. It is difficult. Almost every season, ships get caught in sea ice, teams lose communications and planes are sometimes tragically lost.”
All the more reason for taking a real icebreaker, which he didn’t. Gee, the whole time I thought it was an icebreaker!
Turney is proving to be a basket-case
The Turney story is becoming ever more comical. What we have here is a humiliated scientist who wants everyone to believe the Antarctic is melting away, yet claims he went down there in what he thinks is an ice breaker to break through ice; says he knew that conditions there were treacherous, yet took his family and tourists along anyway; says that conditions there are unpredictable, but claims that the sea ice and wind unpredictability caught him by surprise; says the expedition was no pleasure cruise, yet had a fully-stocked bar and we saw pictures of partying almost daily.
Even funnier is that Turney is now trying to fool himself and others into believing that he has done the whole world a huge favor in that he created a “remarkable rekindling of public interest in science and exploration” and that he will wow the world with “the quality of the research”.
After this fiasco (even Andy Revkin of the New York Times calls it just that) it’s clear that Turney is someone who is incapable of acknowledging errors. Worse, and even scarier, he and Nature seem to be telling us that he deserves a medal for what he has done.
----------
CLIMATE CHANGE GROUPS SEEK NEW LEADERSHIP AS GREEN MOVEMENT LOSES MOMENTUM
It is unclear exactly why many climate change organizations are installing new executives, but it appears they are following the professional sports paradigm: When a team loses more than it wins, you can’t fire all the players, but you can fire the coach.
In the last decade the environmentalist have peddled harsh laws to install climate change strategies. However, many of these laws don’t pass, and new regulations fail to get traction. With global warming at a standstill for most of the last two decades and - much to Al Gor’’s chagrin - plenty of ice still on the polar caps, more green groups are firing their CEO’s.
Next to go is Maggie Fox, president and CEO of the Al Gore-founded Climate Reality Project, who will be gone in the Spring. The group was previously called the Alliance for Climate Protection and was part of the unsuccessful environmental movement’s drive to enact cap-and-trade legislation in 2009-10.
Two other large U.S. environmental companies are giving the boot to their leaders. National Wildlife Federation President and CEO Larry Schweiger is leaving in May, and Natural Resources Defense Council President Frances Beinecke is also parting ways with her group in 2014.
Frank O’Donnell, president of Clean Air Watch, defended the changing of the guard. “It happens in every profession,” he said; “An older generation gives way to a new one. In this case, a new generation of leaders needs to step up.” However, this logic doesn’t fully explain why Greenpeace USA is canning Executive Director Phil Radford who is only in his late 30s, a clear member of that younger generation.
Dec 29, 2013
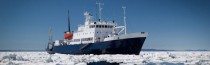
Research ship to study climate change trapped in near record summer icecover
Update: See Warmists trapped by irony off Antarctica by Andrew Bolt So who are the real denialists? See how a boat was shown in ice free Commonwealth Bay in 1912!!!
WUWT and WeatherBell help KUSI-TV with a weather forecasting request from ice-trapped ship in Antarctica Akademik Shokalskiy
Also in the UK Guardian today they report the latest rescue attempt was twarted by an Antarctic blizzard.
See how the UK Mail relished the story and enjoy the comments.
--------------
After nearly a week trapped by deep Antarctic ice, the 74 passengers aboard an expedition vessel could soon be freed.
But based on the troubles of the last few days, no one’s sure exactly when that might happen.
An Australian icebreaker ship Aurora Australis is headed toward the Russian-flagged vessel and is expected to arrive around midnight (8 a.m. ET) Sunday, the Australian Maritime Safety Authority said.
It follows the Chinese icebreaker Xue Long, or Snow Dragon, which was just six nautical miles away from the trapped vessel when it couldn’t get any closer due to unusually thick ice.
The Snow Dragon went back to open water but remains in the area to provide support, said Andrea Hayward Maher, spokeswoman for the AMSA. The Chinese ship has a helicopter on board that could assist in evacuation.
The plan is to see if the Aurora Australis can break through the ice further than the Chinese ship could.
“If not, the aerial transfer of passengers on board maybe a possibility,” Hayward Maher said.
A French icebreaker was also en route to assist, but AMSA called off that vessel’s mission Saturday after it became clear that ship wouldn’t get farther than the Chinese boat. Also, the French and Chinese ships can break ice only about 1 meter thick, where as the Australian ship can pierce through floe about 1.35 meters thick.
“Some reports say that the ice is at least 2 meters deep. It’s a possibility that the Aurora Australis might not be able to break through that type of ice,” Hayward Maher said.
Extreme conditions
The rescue icebreakers were battling the planet’s coldest environment while trying to reach the Akademik Shokalskiy ship, whose 74 researchers, crew and tourists remained in good condition despite being at a frozen standstill since Monday.
Ship stuck in Antarctica awaits rescue Icebreaker gets stuck; rescue stalled
The ship is carrying scientists and passengers led by expedition leader Chris Tunrey, an Australian professor of climate change.
“The vessel is fine, it’s safe and everyone on board is very well,” Turney said. “Morale is really high.”
The ship got stuck in the ice 15 days after setting out on the second leg of its research trip.
According to Turney, a professor at the University of New South Wales, the ship was surrounded by ice up to nearly 10 feet (3 meters) thick. It was about 100 nautical miles east of the French base Dumont D’Urville, about 1,500 nautical miles south of Hobart, Tasmania.
On Christmas morning, the ship sent a satellite distress signal after conditions failed to clear.
The crew had a “great Christmas” despite their situation, Turney told CNN. He said crew members have used the delay to get more work done. “We’ve just kept the team busy,” he said.
The expedition is trying to update scientific measurements taken by an Australian expedition led by Douglas Mawson that set out in 1911.
The expedition to gauge the effects of climate change on the region began November 27. The second and current leg of the trip started December 8 and was scheduled to conclude with a return to New Zealand on January 4. Turney said the ship should still be back in New Zealand on time.
WATTSUPWITHTHAT UPDATE:
The expedition is being led by Chris Turney, “climate scientist”, who has “set up a carbon refining company called Carbonscape which has developed technology to fix carbon from the atmosphere and make a host of green bi-products, helping reduce greenhouse gas levels.” The purpose of the expedition is “to discover and communicate the environmental changes taking place in the south.”
It seems they found out what the “environmental changes taking place in the south.” are.
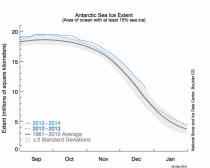
From the WUWT sea ice page, Antarctic Sea Ice is more than 2 standard deviations above normal:
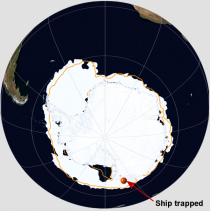
According to this sitrep report for one of the rescue vessels, the Aurora Australis the Akademik Shokalskiy is trapped in sea ice in the Commonwealth Bay region of Antarctica.
This is what the current sea ice coverage looks like at the south pole with the approximate ship location marked:
See how the warmists (the real denialists) are behaving as their theory fails. The will never give up much like the black knight in Monty Python.
Dec 18, 2013
A Visit From ‘Saint Joe’
By Joe Bastardi Dec. 18, 2013
((With apologies to Clement Clark Moore.)
‘Twas the week before Christmas, when all through the news,
There were reports of record cold, so many were confused.
Told global warming is why we should care,
And that the point of no return would soon be here.
The children were bombarded with tales of dread,
While visions of climate disasters were stuck in each little head.
And mamma in her Prius, and I on my bike,
To save the planet, got rid of the cars that we like.
When suddenly in the data there arose such a clatter,
The earth was not warming, what could be the matter?
The warming stopped, as quick as a flash,
Leaving proponents in sack-cloth, bathing in ash.
For far too common was new-fallen snow,
More than forecasted, temperatures 0 or below.
And, what to my wondering eye there appears,
But an uptick in sea ice, and even more polar bears.
With a little old driver, called the PDO,
I knew in a moment it had to be so.
Howling like beagles fearing the shame,
AGW pushers called skeptics many a name!
"Now, Denier! now, madman! now neanderthal, you’re lying!
You’re an idiot! you’re stupid, know nothing, we’re frying!
To the top of the chart! breaking through the temperature wall!
The warmings out of control, it’s frying us all!”
As dry leaves that before the wild hurricane fly,
This is the worst drought ever, global warming is why.
So up to the IPCC the climate pushers flew,
With a gravy train of grants, and politics too.
Make economies pay, we need no proof,
Just keep saying temperatures are going through the roof.
With the media complicit, my head was turning around,
To see the global temperature level off and then come down.
The warming had stopped, in their mouth was their foot,
Exposing the scam, and making off with the loot.
Readjusting temperatures, from many years back,
Peddling disinformation to the media pack.
At conferences they would drink and make merry!
While the deceit grew in a way, that made it quite scary!
For the tide it had turned, there was cold that would show,
You can’t say it’s warmer, if there’s too much snow.
The cold that was showing led to chattering of teeth,
As the cycle came full circle, not unlike a wreath.
The face of global warming had become a subject smelly,
Their position as “solid,” as a bowlful of jelly!
Hockey sticks broken, sea ice on the increase,
I laughed when I heard their excuses not cease.
Events we all knew were something ahead,
Were twisted into worst ever, something to dread.
How dare mother nature destroy AGW’s life’s work,
These deniers are as nasty as a Miley Cyrus Twerk.
But the data is there and everyone knows,
The temperatures leveled off while CO2 rose!
So when in the wire, you hear the cold wind whistle,
The AGW agenda is ready for dismissal.
So let me exclaim, as this fades out of sight,
“Happy Christmas to all, and to all a good-night!”
Enlarged
Joe Bastardi is chief forecaster at WeatherBELL Analytics, a meteorological consulting firm.
--------
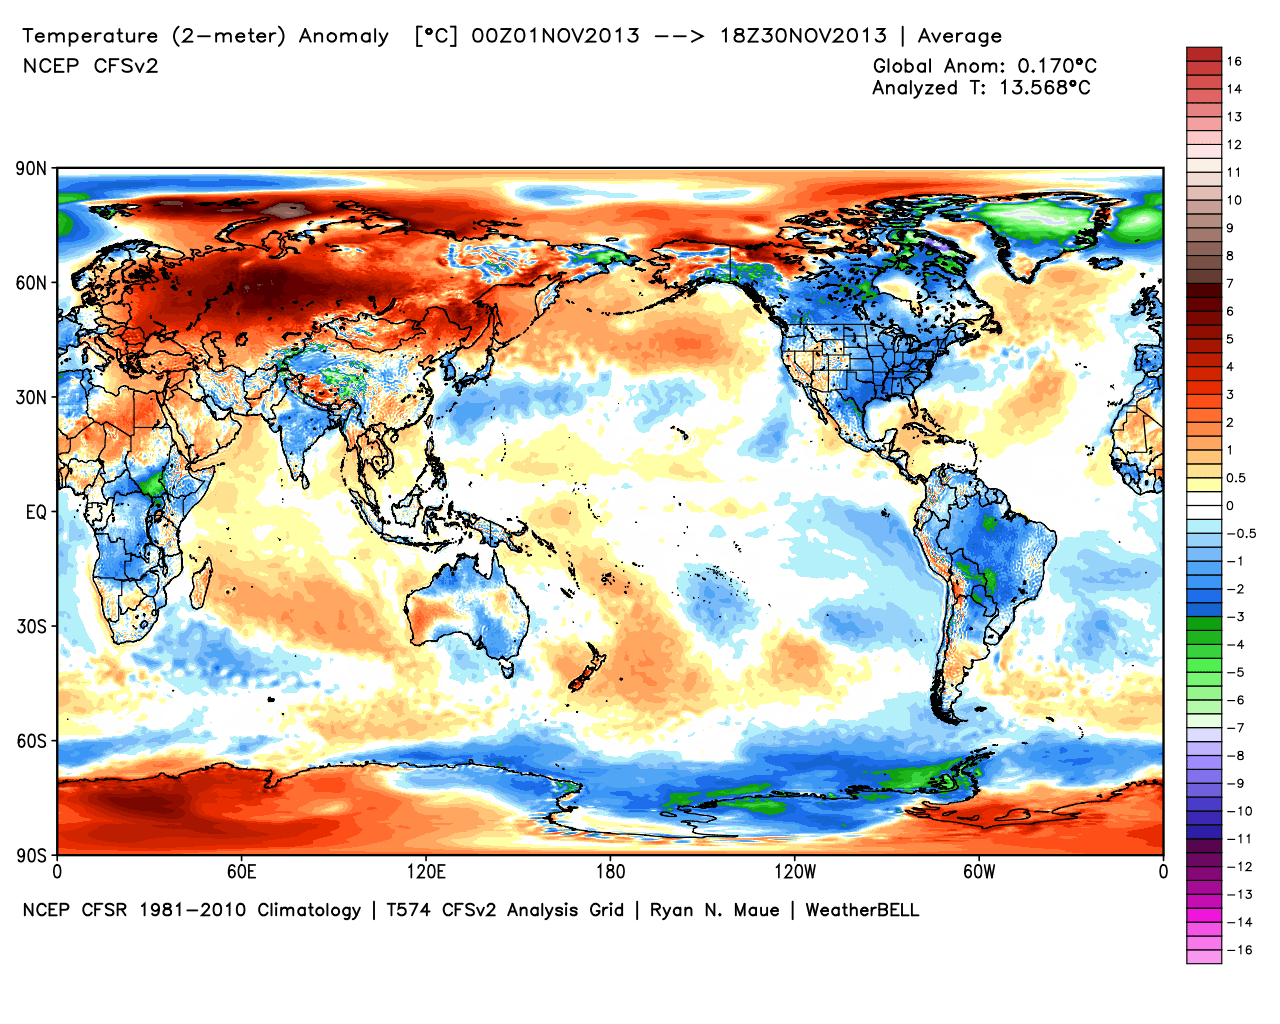
Icecap Note: By the way, the liars at NOAA NCDC proclaimed November to be the warmest ever for the globe with an anomaly of+1.40F. It was not the case in the NASA data set which had it at roughly half that at +0.72F nor in the satellite data bases which had it near +0.4F. It seems every agency of the Obama administration is loose with the facts. Do you believe unemployment is below 7% (oK if you stop counting people who can’t find a job you might get that) or inflation is zero (because they don’t count volatile food and energy which is the lions share of the costs for the low and middle class). NCDC has a version 3.2.2 of its global data set, each version is warmer than the prior, accomplished with additional post 1990 warming and especially cooling prior to the 1950s. In private industry this is known as creative accounting and often ends up with people in jail. In government, they get to keep their jobs and are likely to see increased funding. As Steve Goddard notes here, there are no physical mechanisms to explain the changes. A UHI adjustment would be the opposite.
Enlarged
NOAA data for November before manipulation/adjustment (global anomaly for November of +0.3F instead of +1.4F).
Enlarged
Here is the adjustment just since 2008!.
Enlarged
Brian Williams of NBC Obama news network last night proclaimed it the warmest November ever for the globe. Of course you can count on the worthless Weather Channel owned by NBC to parrot that.
|

