|
Aug 28, 2007
The New Math on Global Warming
By Dennis T. Avery
The UN climate change panel told us in 2001 that human-emitted CO2 might drive the planet’s average temperature upward by 5.8 degrees C—a bigger average warming than the world has had in the past 100,000 years. The UN’s 2007 report scales the possible overheating back a bit, to a maximum of 4.5degrees—still a very large warming.
But wait! The environmental movement is now conceding that the earth has a natural, moderate climate cycle. Jon Coifman of the Natural Resources Defense Council said recently on the Hannity and Colmes TV show, “The earth has natural temperature and climate cycles. Nobody has disputed that.”
The earth has warmed only a net 0.2 degrees C of net warming since 1940. Human-emitted CO2 gets the blame for only half of that—or 0.1 degree C of warming over 65 years! We’ve had no warming at all since 1998.
Remember, too, that each added unit of CO2 has less impact on the climate. The first 40 parts per million of human-emitted CO2 added to the atmosphere in the 1940s had as much climate impact as the next 360 ppm.
Why does NRDC say that the earth has reached a “crisis tipping point” when we’ve had only 0.2 degrees C of warming over the last 65 years—and no warming at all over the past eight years? How do the Greens project a mind-numbing surge of global warming from this New Math on Global Warming?
Is the emerging evidence of the natural cycle the real crisis for Al Gore and the warming alarmists? Read more here.
Aug 27, 2007
Whoops! Hottest Years Were in 1930s
By Brad Knickerbocker
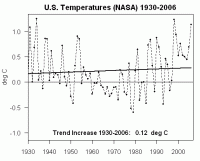
Was 1998 the hottest year in United States history, as most reporting on climate change has presumed? Or was that record set back in 1934 before “global warming” became a scary household phrase? A corrective tweak to National Aeronautics and Space Administration’s formulation shows that the hottest year on record in the United States indeed was back during the Dust Bowl days. But does this mean that all the concern about global warming being a relatively recent phenomenon tied to carbon-belching power plants and hulking SUVs is a bunch of Al Gore hooey?
Climate change skeptics and their cheering section among conservative bloggers and radio shoutmeisters think so --even though most scientists say, no, the tweak is not a big deal and overall trends are in the direction of toastier days around the globe.
Is the issue settled? Far from it, says Roy Spencer, a principal research scientist for the University of Alabama, who describes himself as “skeptical of the claim that global warming is mostly manmade.” Blogging on TCSDaily.com, Spencer writes: “In case you hadn’t noticed, the global warming debate has now escalated from a minor skirmish to an all-out war. ... In the last year or so, more and more scientists have been coming out of the closet and admitting they’ve had some doubts about this whole global warming thing.” Read more here.

NASA GISS US Annual mean temperatures since 1930. Trend is just 0.12C (0.21F) over the 76 year period.
Aug 24, 2007
Taming the Hurricane
By World Climate Report
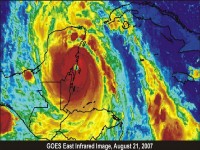
On September 28, 1955, a Category 5 hurricane named Janet slammed into Chetumal, on Mexico’s Yucatan Peninsula, killing over 600 people. Hurricane Dean, another Category 5, and the third-strongest storm ever measured at landfall, hit in exactly the same place earlier this week (Tuesday, August 21,2007) and killed no one. Maximum winds in both storms were indistinguishable. Probably for the first time in human history, a Category 5 storm hit a populated area and everyone lived.

Because of its peculiar location, the Yucatan takes more big hurricane hits than just about anywhere else in the western hemisphere. When Mexico was dirt-poor, as it was in 1955, hurricanes could kill hundreds. They were warned, then, too.
Similar storms, huge storms, very different results. What’s happening here? Since then, people in the Yucatan have learned to adapt. While storms like these used to kill hundreds, even thousands, we now have the technology to forecast their tracks, at least for the critical last 24 hours, with reasonable confidence.
Anyone concerned about climate change should take a lesson from Hurricane Dean. Even if storms like this become more frequent in the future, people will adapt and survive if they have the financial resources. How silly it seems to take those resources away in futile attempts to “stop global warming”—which no one even knows how to do—when they could save lives by allowing people to adapt to our ever-changing climate. Read full report here.
Aug 23, 2007
Papers by British Peer Disprove Catastrophic Human-Induced Global Warming and Scientific ‘’Consensus
Dow Jones Marketwatch
In two major new Science and Public Policy Institute (SPPI) papers, Lord Monckton, a former advisor to Margaret Thatcher as UK Prime Minister, startlingly but definitively demonstrates that the distinctive fingerprint of human greenhouse warming predicted by the UN’s computer models is absent from real-world observations, and that the reputed scientific “consensus” on “global warming” is likewise non-existent.
Greenhouse warming? What greenhouse warming? concludes that the absence of the unique signature of manmade greenhouse warming in 50 years of atmospheric temperature records implies a temperature increase - from doubling atmospheric CO2 concentration - of less than one-third of the UN’s central estimate
Consensus? What consensus? reveals that when David Miliband, as UK Environment Minister, told an April 2007 Vatican conference that global warming science was settled he was met with cries of “Rubbish!”, a word which applies to similar claims of “consensus” by Al Gore, Robert Kennedy, Jr., and others. An inaccurate and now-outdated single-page comment in Science in 2004, the basis for claims of “consensus”, wrongly stated that not one of 928 papers on “global climate change” disagreed with the “consensus”. Monckton brings the analysis up to date, quoting numerous learned papers challenging climate alarmism and revealing that just one of 539 recent papers calls climate change potentially “catastrophic”. He also shows that only a few dozen scientists, not 2,500, explicitly approved the UN’s finding that we are to blame for recent warming; and that several scientific bodies disagree with the “consensus”.
Robert Ferguson, SPPI president, said: “In these excellent papers, Christopher Monckton presents his powerful case ad rem, not ad hominem - he addresses the facts, but does not attack the person. He is refreshingly different from other public figures who are apparently incapable of debating the science. Al Gore is still dodging Lord Monckton’s open invitation to public debate, preferring to cower behind the Maginot Line of a ‘consensus’ which, if it ever existed, is now in tatters.”
Aug 20, 2007
Rhodes Fairbridge and the Idea that the Solar System Regulates the Earth’s Climate
By Richard Mackey, JCR
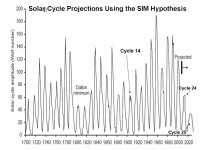
Rhodes is one of the few scientists to research the sun/climate relationship in terms of the totality of the sun’s impact on the earth (i.e. gravity, the electromagnetic force and output and their interaction). When the totality of the sun’s impact is considered, having regard to the relevant research published over the last two decades, the influence of solar variability on the earth’s climate is very strongly non-linear and stochastic. Rhodes also researched the idea that the planets might have a role in producing the sun’s variable activity. If they do and if the sun’s variable activity regulates climate, then ultimately the planets may regulate it. Recent research about the sun/climate relationship and the solar inertial motion (sim) hypothesis shows a large body of circumstantial evidence and several working hypotheses but no satisfactory account of a physical sim process. In 2007 Ulysses will send information about the solar poles. This could be decisive regarding the predictions about emergent Sunspot Cycle No 24, including the sim hypothesis. According to the sim hypothesis, this cycle should be like Sunspot Cycle No 14, and be followed by two that will create a brief ice age.

The solar inertial motion hypothesis predicts that the period from about 2010 to 2040 will be one of relatively severe cold throughout the world. The hypothesis predicts that the emergent Sunspot Cycle No 24 will be quieter than Sunspot Cycle No 23 and just like Sunspot Cycle No 14, the weakest cycle in the last 100 years, which began in February, 1902 and ended in August, 1913. It would also tend to support the prediction that solar maximum of Sunspot Cycle No 25 would be much smaller than has been observed during the last 150 years or so. It would be a strong indicator of a very cold global climate ahead. Even David Hathaway of NASA has predicted this decline for solar cycle 25. Read full paper here.
|
|
|
|


