Several of you have asked me during the past few weeks to comment on Climategate--the emails stolen from the University of East Anglia dealing with global warming issues. I will do so here, but I want to go beyond that situation to some of my own personal observations derived my own experiences doing climate-related research.
Let me start with my bottom line points:
Were some of the climategate emails inappropriate? Yes
Have some scientists exaggerated the implications of human caused global warming? Yes.
Are many global warming deniers unreasonable and expressing opinions that are not based in facts or rational thought? Yes.
Is the basic science of climate change now in question because of the climategate emails? No.
Has the whole business gotten too political? Surely.
Are scientists human and sometimes doing things out based on human emotion or group think? Yes.
Climategate emails: I read through more than a hundred of them...particularly the ones that have gotten big attention. These scientists were in circle the wagons mode. Clearly, they felt under pressure, if not threatened, by the global warming (GW) skeptics, and discussed ways of denying the critics information requested through Freedom of Information inquiries. They scientists talked about erasing emails, and not publishing in journals they felt were printing materials they disagreed with. Web sites like “Climate Audit” has become dirty words to some. (I personally love “Climate Audit”!). All of this was inappropriate.
In the famous “trick” email the east Anglia emails talk about replacing the proxy tree ring records with instrumental records for the past several decades (because the tree ring records disagreed with what the instrumental records were saying)--instead of just showing those records and noting the difficulty. Not quite open. Is there any major technical cover up evident in the emails?...not that I could see. Denier and skeptic types are claiming that these emails undermine the whole global warming business...and they are completely wrong about that. But there are some general issues we should talk about.
There is an almost tribal separation going on today between the scientific community and their “allies” (generally of a liberal persuasion) and the denier and critic crowd (many of them of a conservative bent). The denier folks have become angry, with conspiracy theories and accusations of far-left agendas. Whenever there is an article on climate change in newspapers, these people leaves large numbers of online comments. And few of them are well informed about the science. And there is a lot of misinformation on the “pro” global warming side as well. Scientists, unaccustomed to being on the firing line, have gotten defensive--and the emails from climategate really document this attitude.
This defensiveness has now gotten unhealthy for both the science and society. Scientists who attempt to publish material indicating that global warming due to manmade causes is not evident or weak, or who doubt the severity of the problem, are not treated well by some. I have had some first-hand experience with this. I am known as somewhat of a skeptic regarding global warming effects in the NW--although I do believe that greenhouse gases are a serious problem in the long-run. A group of us noted that the snowpack in the Cascades was NOT rapidly melting away, in contrast to some publications by some local climate scientists and publicized by Mayor Nickels. The reaction was intense. One of my colleagues, Mark Albright, who was the first to notice the lack of snowpack loss was fired as associate State Climatologist and the media went wild...we called it Snowpackgate...and it got national attention. I was told in the hallways to keep quiet about it...the denier types would take advantage of it!
We then wrote a paper on the subject (the main contributor being Mark Stoelinga) and submitted it to the Journal of Climate. I have published a lot of papers in my life (roughly 100) and I never had problems like we had with this paper. Very biased associate editor and some reviewers. Four review cycles and it was about to be turned down, until we appealed to the editor, who proved fair and reasonable. This paper has now been accepted for publication, but it really revealed to me the bias in the system. Here is the paper if you are interested.
Poor papers with significant technical problems, but reflecting the “official” line, get published easily, while papers indicating the global warming is weaker or delayed, go through hurdle after hurdle.
I have heard case after case of similar treatment...so this is no anomaly.
The media tends to publish all kind of threatening predictions about global warming without really researching them. A good example is that suggestion that heavier precipitation will fall in the NW under GW...or is already happening. There is no evidence for this, but it gets repeated over and over again. On the other hand the denier types point to every cold wave or the fact there has NOT been a lot of warming in the last 5-10 years (which doesn’t mean anything). And the glaciers! Some of the melting may well be due to man-forced warming...but the melting started early in the last century before CO2 effects were significant.
Another problem is that uncertainty of our climate predictions are often not clearly expressed in various publications--even semi-official ones put out by climate impacts groups of various types. It is sobering to note that the uncertainty in climate predictions has not declined over the past decades. Our models are much better now than thirty years ago, but key aspects of the modeling systems...like how they simulate clouds… are not as realistic as we would like...and this is very important for climate change work. I think people sense there is more uncertainty in the predictions than the official outlets tell them...and that may be part of the fuel of denier rage. The essential physics of warming is quite solid and well understood, but the details...like how clouds will react...are still under investigation.
So perhaps I have been confusing....but the bottom line is that this issue has been completely politicized and confused with both sides using problematic information at times....did this have to happen? If Gore hadn’t taken up the mantle of stopping global warming, would things have been better? Can Climategate lead to a better approach and attitude among all parties? See more here.
------------------------
The Sun-Earth Connection - the Cloud and Climate Mystery Solved? Series posted in 6 parts on youtube by ekstragrim
-------------------------
See Mann throw Colleagues Under the Bus on WAPO By Roger Pielke Jr.
In today’s Washington Post, Michael Mann of Penn State University and CRU email fame, gives us some good news about climate science and some bad news about his colleagues.
The good news is that climate science in his view is not at all impeached by the release of the CRU emails.
The scientific consensus regarding human-caused climate change is based on decades of work by thousands of scientists around the world.
The bad news is that some of his colleagues exhibited “poor judgment”:
I cannot condone some things that colleagues of mine wrote or requested in the e-mails recently stolen from a climate research unit at a British university. . . Some statements in the stolen e-mails reflect poor judgment—for example, a colleague referring to deleting e-mails that might be subject to a Freedom of Information Act request—but there is no evidence that this happened. I doubt that Professor Mann will be getting many cheery Christmas cards from his CRU-email colleagues. See post and comments here.
------------------------
A Climategate Who’s Who
---------------------------
See Expert Videos Craig Idso, CO2 Science
As representatives of the nations of the world meet in Copenhagen to attempt to restrict the use of energy produced from coal, gas and oil in the guise of fighting global warming, many scientists and scholars are expressing grave concerns about what they are trying to do. Recognizing these concerns, we have posted a series of YouTube video vignettes in which such scientists and scholars present the reasons behind them.
We invite you to view the videos and do all you can to inform the public about their presence. Each of the videos can be accessed from the CO2 Science website, from the CO2Science YouTube channel , and other locations across the Internet, such as here. A categorized-list of the videos we have posted is presented on these sites. Wise decisions are made only when all pertinent aspects of an issue are examined. It is our sincere hope that the information presented in these videos will elucidate important truths that are presently ignored. See four posted videos with Dr. Lindzen, Dr. Soon, John Coleman and Joe D’Aleo on KUSI’s web site here.
See also audio interviews with many scientists on Its Rainmaking Time here.
-------------------------
Urban vs Rural in US
A comparison of data from urban and rural sites to see if there is an Urban Heat Effect. Data from NASA GISS. Graphs made with Microsoft Excel.
From the “weather is not climate” department, inconvenient travel:
Hundreds of passengers spent the night sleeping in Dallas Fort Worth Airport near Dallas, Friday, Dec. 25, 2009 after a winter storm forced the cancellation of many flights from Dallas. The Star-Telegram newspaper said Dallas-Fort Worth was experiencing its first White Christmas in more than 80 years. (AP Photo/J Pat Carter)
Here’s a sample of headlines related to difficult if not impossible holiday travel:
Christmas Eve storm in central states creates travel misery (WaPo). A slow-moving storm spread snow, sleet and rain across the nation’s midsection Thursday, making last-minute holiday travel treacherous but promising a white Christmas for some.
The National Weather Service issued blizzard warnings for parts of Oklahoma, the Dakotas, Wisconsin, Minnesota and Texas. It cautioned that travel would be extremely dangerous in those areas through the weekend and that drivers should pack a winter survival kit.
Winter Storm Disrupts Holiday Travel (NYT)
“Snow will be falling at a rate that snow plows are not able to keep up with,” AccuWeather reported on its Web site, “while winds gusting past 40 miles per hour will cause severe blowing and drifting along with whiteout conditions.”
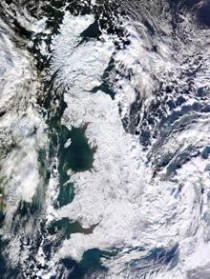
Heavy snowfall causes disruption across Europe (BBC)
Heavy snow and ice are causing disruption across a wide swathe of Europe. Flights have been delayed or cancelled at airports in Britain, Belgium, France, Germany and the Netherlands. Power providers in south-east France say they have had to cut supplies to around two million people to avoid a massive regional blackout. In Poland, nearly 60 people have died this December because of the weather.
Treetops glisten, but storm snarls Midwest holiday (Atlanta Journal Constitution)
The Star-Telegram said the Dallas-Fort Worth area was experiencing its first White Christmas in more than 80 years. While the area had a sprinkling of holiday snow in 2004 and 1997, the lasttime it experienced “a true, New England-style dose of snow on Christmas Day was Dec. 25, 1926,” the newspaper reported. Some churches canceled Christmas Eve services, while others saw sharply lower attendance. Oklahoma City had received 14 inches of snow by Thursday night, breaking a record set back in 1914 of 2.5 inches.
In the early 1970s the UN spearheaded the progressive notion of a new world economic order, one that would try to level the playing field between the First World and the Third. The neoliberal onslaughts gathering strength from the mid-1970s on destroyed that project. Eventually the UN, desperate to reassert some semblance of moral leadership, regrouped behind the supposed crisis of climate change as concocted by the AGW lobby, behind which lurk huge corporate interests such as the nuclear power companies. Radicals from the United Nations Conference on Trade and Development, putting forward proposals for upping the Third World’s income from its primary commodities, were displaced by climate shills in the UN’s Intergovernmental Panel on Climate Change - the IPCC. The end consequence, as represented by Copenhagen’s money-grubbing power plays over “carbon mitigation” funding, has been a hideous travesty of that earlier vision of a global redistribution of resources.
Such is the downward swoop of our neoliberal era. In Oslo Obama went one better than Carter who, you may recall , proclaimed in 1977 that his crusade for energy conservation was “the moral equivalent of war.” Obama trumped this with his claim that war is the moral equivalent of peace. As he was proffering this absurdity, Copenhagen was hosting its global warming jamboree, surely the most outlandish foray into intellectual fantasizing since the fourth-century Christian bishops assembled for the Council of Nicaea in 325AD to debate whether God the father was supreme or had to share equal status in the pecking order of eternity with his Son and with the Holy Ghost.
Shortly before the Copenhagen summit the proponents of anthropogenic - human-caused - global warming (AGW) were embarrassed by a whistleblower who put on the web over a thousand emails either sent from or received at the Climate Research Unit at the University of East Anglia headed by Dr Phil Jones, who has since stepped down from his post - whether temporarily or permanently remains to be seen. The CRU was founded in 1971 with funding from sources including Shell and British Petroleum. At that time the supposed menace to the planet and to mankind was global cooling, a source of interest to oil companies for obvious reasons.
Coolers transmuted into warmers in the early 80s and the CRU became one of the climate modeling grant mills supplying the tainted data from which the UN’s Intergovernmental Panel of Climate Change (IPCC ) has concocted its reports which have been since their inception - particularly the executive summaries—carefully contrived political initiatives disguised as objective science. Soon persuaded of the potential of AGW theories for their bottom line, the energy giants effortlessly recalibrated their stance, and as of 2008 the CRU included among its financial supporters Shell and BP, also the Nuclear Installations Inspectorate and UK Nirex Ltd, a company in the nuclear waste business.
After some initial dismay at what has been called, somewhat unoriginally, “Climategate” the reaction amid progressive circles - 99 per cent inhabited by True Believers in anthropogenic global warming - has been to take up defensive positions around the proposition that deceitful manipulation of data, concealment or straightforward destruction of inconvenient evidence, vindictive conspiracies to silence critics, are par for the course in all scientific debate and, although embarrassing, the CRU emails in no way compromise the core pretensions of their cause.
Scientific research is indeed saturated with exactly this sort of chicanery. But the CRU emails graphically undermine the claim of the Warmers - always absurd to those who have studied the debate in any detail - that they commanded the moral high ground. It has been a standard ploy of the Warmers to revile the skeptics as intellectual whores of the energy industry, swaddled in munificent grants and with large personal stakes in discrediting AGW. Actually, the precise opposite is true. Billions in funding and research grants sluice into the big climate modeling enterprises. There’s now a vast archipelago of research departments and “institutes of climate change” across academia, with a huge vested interest in defending the AGW model. It’s where the money is. Scepticism, particularly for a young climatologist or atmospheric physicist, can be a career breaker.
By the same token magazines and newspapers, reeling amidst the deadly challenge of the internet to their circulation and advertising base have seen proselytizing for the menace of man-made global warming, as a circulation enhancer - a vital ingredient in alluring a younger audience. Hence the abandoned advocacy of AGW by Scientific American, the New Scientist, Nature, Science, not to mention the New York Times (whose lead reporter on this topic has been Andrew Revkin, who has a personal literary investment in the AGW thesis, as a glance at his publications on Amazon will attest.)
Many of the landmines in the CRU emails tend to buttress long-standing charges by skeptics that statistical chicanery by Prof Michael Mann and others occluded the highly inconvenient Medieval Warm Period, running from 800 to 1300 AD, with temperatures in excess of the highest we saw in the twentieth century, a historical fact which made nonsense of the thesis that global warming could be attributed to the auto-industrial civilization of the twentieth century. Here’s Keith Briffa, of the CRU, letting his hair down in an email written on September 22, 1999: “I know there is pressure to present a nice tidy story as regards ‘apparent unprecedented warming in a thousand years or more in the proxy data’ but in reality the situation is not quite so simple. I believe that the recent warmth was probably matched about 1000 years ago.”
Now, in the fall of 1999 the IPCC was squaring up to its all-important “Summary for Policy-Makers” - essentially a press release - one that eventually featured the notorious graph flatlining into non-existence the Medieval Warm Period and displaying a terrifying, supposedly unprecedented surge in twentieth century temperatures. Briffa’s reconstruction of temperature changes, one showing a mid- to late-twentieth-century decline, was regarded by Mann, in a September 22, 1999, e-mail to the CRU, as a “problem and a potential distraction/detraction.” So Mann, a lead author on this chapter of the IPCC report, simply deleted the embarrassing post-1960 portion of Briffa’s reconstruction. The CRU’s Jones happily applauded Mann’s deceptions in an e-mail in which he crowed over “Mike’s Nature trick.” Like politicians trying to recover from a racist outburst, AGW apologists say the “trick” was taken out of context. It wasn’t.
Other landmines include particularly telling emails from Kenneth Trenberth, a senior scientist and the head of the climate analysis section of the National Center for Atmospheric Research in Boulder, Colo. On October 14, 2009, he wrote to the CRU’s Tom: “How come you do not agree with a statement that says we are no where close to knowing where energy is going or whether clouds are changing to make the planet brighter. We are not close to balancing the energy budget. The fact that we can not account for what is happening in the climate system makes any consideration of geoengineering quite hopeless as we will never be able to tell if it is successful or not! It is a travesty!”
In other words, only a few weeks before the Copenhagen summit, here is a scientist in the inner AGW circle disclosing that “we are not close to knowing” whether the supposedly proven agw model of the earth’s climate actually works, and that therefore “geo-engineering” - global carbon-mitigation, for example—is “hopeless”.
This admission edges close to acknowledgement of a huge core problem - that “greenhouse” theory and the vaunted greenhouse models violate the second law of thermodynamics which says that a cooler body cannot warm a hotter body XX. Greenhouse gasses in the cold upper atmosphere, even when warmed a bit by absorbed infrared, cannot possibly transfer heat to the warmer earth, and in fact radiate their absorbed heat into outer space. Readers interested in the science can read mathematical physicist Gerhard Gerlich’s and Ralf Tscheuchner’s detailed paper published in The International Journal of Modern Physics, updated in January , 2009, “Falsification Of The Atmospheric CO2 Greenhouse Effects Within The Frame Of Physics”.
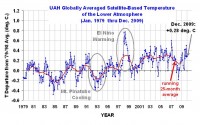
“For the last eleven years,” as Paul Hudson, climate correspondent of the BBC said on October 9, “we have not observed any increase in global temperatures.” In fact recent data from many monitors including the CRU, available on climate4you.com show that the average temperature of the atmosphere and the oceans near the surface of the earth has decreased significantly for the last 8 years or so. CO2 is a benign gas essential to life, occurring in past eras, long before the advent of manmade emissions, at five times present levels. Changes in atmospheric CO2 do not correlate with those emissions of CO2, the latter being entirely trivial in the global balance of carbon.
As for the nightmare of vanishing ice caps and inundating seas, the average Arctic ice coverage has essentially remained unchanged for the last 20 years, and has actually increased slightly over the last 3 years. The rate of rise of sea level has declined significantly over the last 3 years, and its average rate of rise for the last 20 years is about the same as it has been for the last 15,000 years, that is, since the last glacial cooling ended and the earth, without help from mankind, entered the current interglacial warming period. The sea rise of that still on-going interglacial warm spell, among other things, flooded the land bridge between Siberia and Alaska to form the Bering Straits - without which we might be a province of Russia today. So much for the terrors of sea rise.
The battles in Nicaea in 325 were faith-based, with no relation to science or reason. seventeen centuries later, so were the premises of the Copenhagen summit, that the planet faces catastrophe warming caused by a man-made CO2 build-up and that human intervention - geo-engineering-- could avert the coming disaster. Properly speaking, the Copenhagen dogmata are a farce. In terms of distraction from cleaning up the pollutants that are actually killing people, they are a terrible tragedy. See post here.
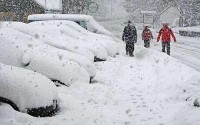
Last week’s storm already caused flooding in South Florida and knocked out electricity for more than 85,000 customers in the Carolinas on Friday. On Saturday, it dropped 16 inches of snow on Reagan National Airport outside Washington - the most ever recorded there for a single December day since snowfall records began in 1884. The storm total snowfall of 16.4 inches of snowfall on December 18-19, 2009 marks the 6th highest two-day snowfall record for Washington, DC, putting it just below the president/s day storm in 2003 and ahead of the January 1996 storm. For the month so far...a total of 16.6 inches of snow has been recorded at DCA. This makes it the snowiest December on record for Washington DC (previous record was 16.2 in 1962).
Not far away in Baltimore, the 20.5 inches of snow measured yesterday will go down as the fifth highest daily snowfall on any calendar day at Baltimore since snowfall records began in 1893. The storm total snowfall of 21.0 inches of snowfall on December 18-19, 2009 marks the 6th highest two-day snowfall record for Baltimore. For the month so far...a total of 22.2 inches of snow has been recorded at BWI. This makes it the snowiest December on record for Baltimore (previous record was 20.4 inches in 1966).
It was the second heaviest snowfall ever for Philadelphia. The 23.2 inches of snow that fell during the nor’easter in Philadelphia is the second highest snowfall for any single event ever. The record still is 30.7 inches set during the January Blizzard in 1996.
The mayors of Washington and Philadelphia and the governors of Virginia, West Virginia, Kentucky, Maryland and Delaware all declared states of emergency.
In New York City, Central Park reported 10.9 inches of snow and NY JFK airport 14.2 inches. It was much heavier on Long Island where many locations received over 20 inches. On Long Island, a record maximum single storm snowfall set at Brookhaven National Laboratory...The final snowfall total for the blizzard at Brookhaven National Laboratory in Upton NY was 26.3 inches. This sets a new record maximum single storm snowfall for the lab. The old record was 23.0 inches...set during the blizzard of February 1978. Records have been kept at the lab since 1949.
Snow in eastern Long Island. Boy age 2 deep in snow.
The storm was in part due to the active southern storm track typical of El Nino and a very anomalous arctic oscillation related to that polar mid-tropospheric to stratospheric warming we wrote about a few weeks back. Here is an updated view of that cross section.
(above, enlarged here) Note the warming in red corresponds to the dip to off the chart in the AO graph just under the cross section.
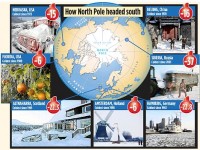
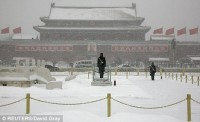
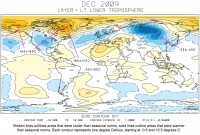
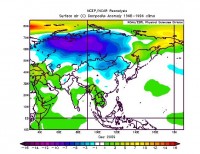
The daily AO (above, enlarged here) has dropped to an amazing 5 standard deviations negative (-5.6 STD today, the lowest in December since records began in 1950 and at levels similar to December 1976 - that year in Mid January dropped to below -7.6 STD). An increasingly negative AO is what caused the cold to dump into the US, Europe, Siberia and China. A major tanking of the AO is often accompanied by a major snowstorm in winter.
Big freeze kills at least 80 across Europe
The death toll from winter storms across Europe rose to at least 80 on Monday as transport chaos spread amid mounting anger over the three-day failure of Eurostar high-speed trains. With tens of thousands stranded by the cancellation of London-to-Paris trains and hundreds of flights across the continent, new accidents and mass power cuts added to the big freeze tumult.
A car veered off an icy road and knocked concrete onto rails, derailing a Paris commuter train and injuring 36 people, police said. Three hundred people had to be evacuated from the train. Another train in the Croatian capital Zagreb hit a buffer injuring 52 people. Croatian investigators blamed the minus 17 degrees Celsius (1.4 Fahrenheit) temperatures for a brake failure, national television reported. European temperatures as low as minus 33.6 degrees Celsius (minus 28.5 Fahrenheit) have been recorded in Bavaria.
In Poland, authorities said 42 people, many of them homeless, had died of cold over three days after temperatures plunged to minus 20 degrees Celsius (minus four Fahrenheit). Ukraine reported 27 deaths while six people were killed in accidents in Germany and three in Austria. France has reported at least two deaths of homeless people, and the national power company briefly cut electricity to two million people on Monday saying it was necessary to avoid an even bigger blackout amid surging demand.
More flights were cancelled in France, Germany, the Netherlands, Portugal and Spain and main highways were blocked across Europe where some regions had more than 50 centimetres (20 inches) of snow. The breakdown of the Eurostar service under the Channel, linking London with Paris and Brussels, has symbolised Europe’s suffering. After the nightmare of more than 2,000 people stuck in the tunnel when five trains broke down Friday, tens of thousands more people have missed trains cancelled since then, with Eurostar announcing a “restricted” service for Tuesday.
Air traffic was again badly hit as temperatures remained glacial: minus 20 degrees Celsius in Sibiu in Romania, where more than 50 centimetres of snow fell, and minus seven Celsius in Venice, Italy. Seven hundred people spent the night on camp beds at Amsterdam-Schipol airport and more flights were cancelled after dozens were grounded Sunday. The Dutch rail network was also badly hit with the railway company advising commuters to stay at home. Heavy snowfall led to more delays and cancellations at Frankfurt and Duesseldorf airports in Germany, where more than 500 flights were cancelled or redirected on Sunday. Twenty percent of flights out of Paris-Charles de Gaulle were cancelled Monday. The main RER commuter train line running east to west across the Paris region has been out of action for 12 days because of a strike. Spanish civil aviation authorities said 174 flights from Madrid-Barajas airport were called off. Flights from Lisbon to Madrid were among those hit while main roads in northern Portugal were cut by snow. Brussels airport also reported cancellations and delays. After more snow falls on Moscow, authorities sent out 13,000 dump trucks to clear the streets as chronic traffic jams built up. In Britain, more airport delays hit passengers while snow forced the postponement of Wigan’s English Premier League football match against Bolton Wanderers. See story here. See earlier BBC story here.
See snowcover spike this past week in the Northern Hemisphere. It will dip down again as brief warming and rains erode away some of the snow in unusual places but should bounce again in January.
Climate Progress’s Joe Romm says the massive weekend snowstorm in the East was exactly what alarmist climate scientists said would happen: “In any case, I have previously discussed the scientific literature, which makes clear that we have seen an increase in intense precipitation in this country, just as climate science predicted we would.”
But as the Washington Examiner’s David Freddoso reminds us, a year ago Robert F. Kennedy, Jr., wrote about the global warming-caused lack of precipitation in the DC area: “Recently arrived residents in the northern suburbs, accustomed to today’s anemic winters, might find it astonishing to learn that there were once ski runs on Ballantrae Hill in McLean, with a rope tow and local ski club. Snow is so scarce today that most Virginia children probably don’t own a sled...”
I recently completed a study of central Alaska’s climate. For this study I computed the average annual temperature for nine long-term Alaskan stations (and station combinations), which are: Eagle/Dawson, Ft. Yukon/Central, Fairbanks University, McKinley Park, Talkeetna, Gulkana / Kennecott / Chitina / McCarthy, Yakutat, Cordova, and Valdez. Then I averaged the nine stations for a regional mean (below, enlarged here). The data source was NCDC.
For comparison with the IPCC thumbnail for Alaska (I hope you can find an enlarged version of this), I replotted the regional temperatures as ten-year averages (below, enlarged here).
My averages show that the past three decades have shown no warming (since the PDO shift in 1977), and are in fact no warmer than the 1935-1944 decade. This is very different from the IPCC which shows a substantial warming over the past three decades. See the plot of annual versus the PDO stages (below enlarged here).
The annual values on the next plot clearly show the dominance of the PDO in Alaskan climate. Next is a graph of the GHCN annual temperatures for the same region. The GHCN data is dominated by an upward trend. My analysis gives an upward linear trend of 0.69 C/century (due to starting during a cold PDO and ending during a warm PDO), while the GHCN trend is 2.83 C/century - over 2 degrees larger!
Here is a blow up of the IPCC graph for Alaska (below, enlarged here.)
My study and the GHCN use the same stations, because there are no other long-term stations in the regions. I applied no “corrections” beyond offsets used when combining two or more stations with overlapping records (no other adjustments were warranted). One can only guess what “corrections” were applied to the GHCN and IPCC data sets, but I can easily guess their magnitude - about 1 degree. Curiously, the magnitude of the adjustments is about the same as the “global warming” signal of the past century.
I’d be interested if other readers can provide similar comparisons with other parts of the world.
---------------------------
Critique Of NCAR Cherry Picking Temperature Record Study Dr. Richard Keen, University of Colorado
Icecap Note: This is a follow-up to the posting now in Cold Storage below, on the NCAR Meehl etal study of record highs and lows that cherry-picked the starting year as 1950. The following is a graphic representation of the study from the UCAR website (below, enlarged here):
Bruce Hall did an analysis and follow-up. He extended the time period back to the start of the century and found the 1930 had a much higher frequency of maximum temperature extremes than the 1990s or 2000s or the combination of the last two decades (below, enlarged here).
Dr. Richard Keen of the University of Colorado provided evidence from the western parts of the US and Canada supporting Bruce’s findings (below, enlarged here).
There were links also to WUWT, World Climate Report studies as well. Here below, Dr. Keen follows up his analysis expanding to all of the US and Canadian provinces and territories and shows there is no warming trend the last century.
Thanks for posting my chart of Western US and Canadian extreme temperature records by decade. I’m sure that by now the usual suspects have accused us of picking all of their cherries by showing only the western half of North America. Therefore, I spent the evening creating more charts for all 50 US states and 12 Canadian provinces and territories (excluding Nunavut, which was part of the Northwest Territories until recently).
I’m sending charts for the US, for Canada, and for the two combined. They tell the same story that my earlier Western North American graph showed, but more dramatically! MORE THAN HALF of the state and provincial maximum temperature records were set during the single decade of the 1930’s, and only 29 percent of these records were set since 1950. This means that by considering temperatures after 1950, Meehl et al. removed most of the really good heat records from the data pool, and artificially inflated the number of maximum temperature records (and thus, the max to min ratio). In other words, many of the maximum temperature records since 1950 would not be daily records for the entire period of record for these stations.
Meehl et al. calculate the max-to-min record ratio for each decade, but the difference (max MINUS min) is more illustrative (and not influenced by choice of denominator). That chart clearly shows the dominance of maximum temperature records during the 1930’s, and that since then most decades have had more minimum records set, and since 1940 minimum records have outnumbered maximum records by a ratio of 3 to 2 (or 1.5 to 1, if you prefer). Meehl et al. achieved opposite ratios by removing the extremes of the 1930’s.
No doubt the cherry pickers will note that although most of North American is included in this analysis (and not just the US), I deftly left out the Yamal Peninsula, which, as we all know, is the true key to global climate. So I’ve created one more graph - a tally of the records for the seven continents, including Asia, which includes Siberia, where the Yamal Peninsula resides. What’s it show? Since 1950, 3 maximum and 4 minimum records have been set for the continents, a fairly even break.
Finally, although I consider linear trend lines somewhat useless and occasionally deceptive, I plotted those for each graph. In all cases, the trend line is virtually indistinguishable from the zero-value axis, so it is not shown. The bottom line is that if one wishes to express climate change by the varying number of temperature extremes, there has been no climate change for over 100 years.
Met Office to re-examine 160 years of climate data By Ben Webster, Times Online
The Met Office plans to re-examine 160 years of temperature data after admitting that public confidence in the science on man-made global warming has been shattered by leaked e-mails.
The new analysis of the data will take three years, meaning that the Met Office will not be able to state with absolute confidence the extent of the warming trend until the end of 2012.
The Met Office database is one of three main sources of temperature data analysis on which the UN’s main climate change science body relies for its assessment that global warming is a serious danger to the world. This assessment is the basis for next week’s climate change talks in Copenhagen aimed at cutting CO2 emissions.
The Government is attempting to stop the Met Office from carrying out the re-examination, arguing that it would be seized upon by climate change sceptics.
The Met Office works closely with the University of East Anglia’s Climatic Research Unit (CRU), which is being investigated after e-mails written by its director, Phil Jones, appeared to show an attempt to manipulate temperature data and block alternative scientific views.
The Met Office’s published data showing a warming trend draws heavily on CRU analysis. CRU supplied all the land temperature data to the Met Office, which added this to its own analysis of sea temperature data.
Since the stolen e-mails were published, the chief executive of the Met Office has written to national meteorological offices in 188 countries asking their permission to release the raw data that they collected from their weather stations.
The Met Office is confident that its analysis will eventually be shown to be correct. However, it says it wants to create a new and fully open method of analysing temperature data.
The development will add to fears that influential sceptics in other countries, including the US and Australia, are using the controversy to put pressure on leaders to resist making ambitious deals for cutting CO2.
The UN’s Intergovernmental Panel of Climate Change admitted yesterday that it needed to consider the full implications of the e-mails and whether they cast doubt on any of the evidence for man-made global warming. Read post here.
Icecap Note: How are they planning to deal with the ‘lost’ data. See also how they say it will be three years to assess the degree of warming. They are going into this assuming warming will be found, not unbiased. Note also how Brown and his party object to the 3 year study as they know, they wont be around in 3 years. See here how Brown and in the US the equally clueless Markey are heavily vested in action on global warming are attacking skeptics for actions to derail Copenhagen. It has the smell of panic and desparation.