|
Jul 07, 2008
UAH: June 2008: Still Negative Anomaly
By Lubos Motl, The Reference Frame
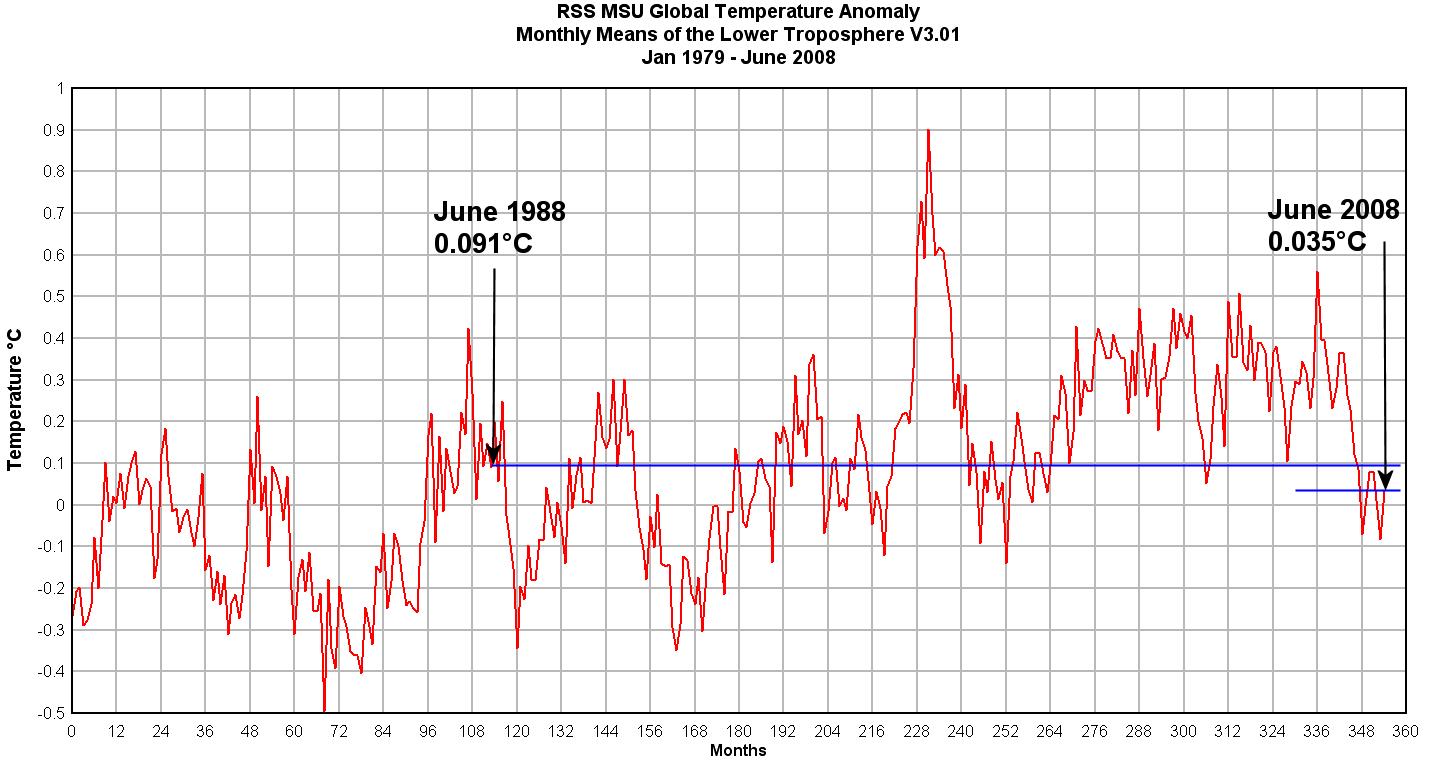
According to UAH MSU, the global temperature anomaly in June 2008 was -0.11C, up from -0.18C in May 2008. A similar warming from -0.083C in May 2008 to +0.035C in June 2008 has been reported by RSS MSU, too. But let us focus on UAH MSU. Anomaly-wise, June 2008 was the third coldest month of the 21st century so far, after May 2008 and July 2004 (that had -0.12C, almost the same temperature).
In terms of the anomaly, the land in the Southern polar lands - Antarctica - cooled by a hefty 2.35C from the previous month - from +0.82 to -1.53C. Such things happen near the poles where all changes are amplified and where the area is not too large to guarantee a constancy of temperature. The Northern polar region cooled from 1.03 to 0.49C between May and June 2008. The total sea ice anomaly is currently near zero, as a positive anomaly of the Southern Hemisphere cancels the negative anomaly of the Northern Hemisphere. A year ago, the total anomaly was around -2 million squared kilometers. Those “experts” who bet that there will be less ice in 2008 than 2007 don’t look particularly clever to me. By the way, a Dutch team just published a study that shows that the Greenland melting cycle exhibits no trend in the last 17 years. See Andrew Revkin’s blog and NYT article.
The first half of 2008 is over so we can say something about this period. According to the UAH MSU data, the average temperature anomaly for those six months was -0.03C, making the first half of 2008 the coldest half-year since first half of 1997. It’s been a half-year of a cooling U.S. job market, too. No, it is not a typo. I really mean that 2008 has been cooler than the “cold” La Nina years and half-years during the 1998-2001 La Nina episode, too. And that’s true despite the fact that the 1998-2001 La Nina episode was both longer and stronger than the recent one. To summarize, there’s no global warming in the recent 10 years of data.
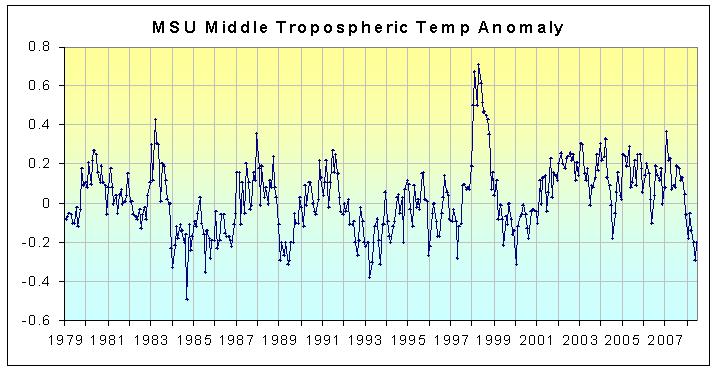
This absence of warming becomes even more striking in the middle troposphere where the bulk of the greenhouse effect is being predicted while the reality shows an even slower warming trend if any. In fact, the trend since 1979 is 0.00C per decade on the Southern Hemisphere and 0.05C per decade globally, justifying the claim that there exists no satellite-observed global warming in the mid troposphere. UAH MSU sees the global June 2008 anomaly in the mid troposphere as -0.20C and the average of the first half of 2008 equals -0.18C. Since the beginning of the UAH satellite records in 1979, only a few half-years in 1984, 1985, 1989, 1993 were cooler than first half of 2008. Read more here.
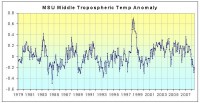
See larger image here
Jul 06, 2008
Going Down: Death Rates Due to Extreme Weather Events
By Indur Glokany with introduction by Anthony Watts
During our discussion of the preposterous news story from Pravda, claiming this headline: “Earth begins to kill people for changing its climate” a scientist dropped in to provide us some insight into his latest paper. It was highly relevant at the time since one of the repeating themes we see in the mainstream (and not so mainstream) media is the attribution of increasing death due to severe weather events to “global warming”.
But that is not supported by the real data, it is a false premise. In this paper, Indur Goklany examines the worldwide trends and makes dome surprising discoveries base of examining data from the World Health Organization, NOAA, and other sources.
Some have claimed that, all else being equal, climate change will increase the frequency or severity of weather-related extreme events (see, e.g., IPCC 2001; Patz 2004; MacMichael and Woodruff 2004). This study examines whether losses due to such events (as measured by aggregate deaths and death rates2) have increased globally and for the United States in recent decades. It will also attempt to put these deaths and death rates into perspective by comparing them with the overall mortality burden, and briefly discuss what trends in these measures imply about human adaptive capacity.
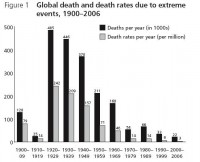
See larger image here
Despite the recent spate of deadly extreme weather events - such as the 2003 European heat wave and the 2004 and 2005 hurricane seasons in the USA - aggregate mortality and mortality rates due to extreme weather events are generally lower today than they used to be. Globally, mortality and mortality rates have declined by 95 percent or more since the 1920s. The largest improvements came from declines in mortality due to droughts and floods, which apparently were responsible for 93 percent of all deaths caused by extreme events during the 20th Century. For windstorms, which, at 6 percent, contributed most of the remaining fatalities, mortality rates are also lower today but there are no clear trends for mortality. Cumulatively, the declines more than compensated for increases due to the 2003 heat wave. Read more here.
Jul 04, 2008
Biofuels Behind food Price Hikes: Leaked World Bank Report
AFP
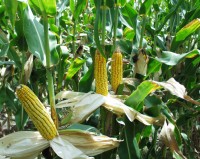
Biofuels have caused world food prices to increase by 75 percent, according to the findings of an unpublished World Bank report published in The Guardian newspaper on Friday. The daily said the report was finished in April but was not published to avoid embarrassing the US government, which has claimed plant-derived fuels have pushed up prices by only three percent. Biofuels, which supporters claim are a “greener” alternative to using fossil fuel and cut greenhouse gas emissions, and rising food prices will be on the agenda when G8 leaders meet in Japan next week for their annual summit.
The report’s author, a senior World Bank economist, assessed that contrary to claims by US President George W. Bush, increased demand from India and China has not been the cause of rising food prices. “Rapid income growth in developing countries has not led to large increases in global grain consumption and was not a major factor responsible for the large price increases,” the report said. Droughts in Australia have also not had a significant impact, it added. Instead, European and US drives for greater use of biofuels has had the biggest effect. “The basket of food prices examined in the study rose by 140 percent between 2002 and this February,” The Guardian said. “The report estimates that higher energy and fertiliser prices accounted for an increase of only 15 percent, while biofuels have been responsible for a 75 percent jump over that period.” Read more here.
Jul 04, 2008
What a Difference 20 Years Make
By Anthony Watts, Watts Up With That
Recently, Dr. James Hansen of NASA GISS gave his 20 year anniversary speech before congress, in which he was restating the urgency of the global warming crisis we now face. Warnings of tipping points, and a call for putting “energy executives on trial for crimes against humanity and nature” were parts of that speech.
Here are the just published global temperature data sets for UAH (University of Alabama) and RSS (Remote Sensing Systems) and the 20 year time-line. Dr. Hansen if you are reading can you kindly point out where in the time-line the crimes occurred and tipping points are?
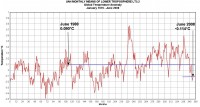
See larger image here.
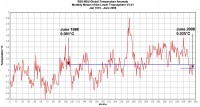
See larger image here.
I would have thought the CO2 enhanced warming would have been further along by now. Maybe the graphs are inverted? See more here.
Jul 01, 2008
Okanagan Cherry Crop will Take $36 Million Hit
By Judie Steeves - Kelowna Capital News
It’s estimated April’s record-breaking cold has caused $36 million in losses to this year’s cherry crop in the Okanagan Valley. Adjusting agrologist Trevais Mellum, who works out of the agriculture ministry’s Kelowna office, says he’s looked at what’s on the trees from the south of the valley to the north, and he expects growers will only pick about a quarter of their normal production.
The worst damage is in the Central Okanagan, where most of the large cherry orchards are located, so that’s where the biggest economic hit will be felt, Mellum says. Because many cherry growers pack fruit in the orchard, rather than shipping it to a central packing plant, it’s difficult to estimate the value of the total crop. But Mellum estimates a normal crop in the valley is worth $50 million on the retail market.
Cherry growers are finding more damage was done than had been initially thought, although it’s patchy and varies by variety, so final figures could be different once the crop is in the box. But East Kelowna grower Christine Dendy admits, “it’s going to be a tough year.” Dendy figures she has about 35 per cent of her crop left, after the cold damaged the blossoms, the remaining ones weren’t properly pollinated and there was a heavy drop in early June. Although she has crop insurance, she says it doesn’t begin to cover the losses.
Now, she’s worried about keeping pickers happy with such a light crop, and how she’ll plan for labour when she’s not sure how much fruit is on the trees. “I still have to maintain the orchard; spray the same sprays, yet I won’t have the cash to pay for it this year,” she said. “It will be much more expensive to produce the fruit that’s there,” she added. Her only hope now is that there will be better prices for cherries, since crops are way down in Washington State as well. She’s also hopeful there could be better sized fruit because there will be more strength in the tree, which is nurturing less fruit. Mellum said many growers who had initially thought they had crops of 70 to 80 per cent of normal are now finding-after the June drop-they have closer to 20 or 30 per cent of a crop. Read more here.

See larger image here
|
|
|
|

