
|
Feb 28, 2008
Snow Records Falling in New England
By Joseph D’Aleo, CCM
Earlier we reported places like Madison, Wisconsin in the midwest set new all-time snowfall records and appeared to be heading for 100 inch seasons. Though not as cold as the Midwest this winter, the northern half of New England has been just as snowy, typical in both cases and places of La Nina.
Burlington Vermont has now (as of February 28) exceeded 100 inches for the season (107.1 inches). For the three month winter season, Burlington set a record with 103.4 since December 1. Records extend way back to 1884. The previous record was set in the incredibly snowy strong La Nina winter of 1970/71 which had 96.9 inches during the December through February period. That year they went on to add 45.7 inches more in March and April. No reason to expect the snow to stop coming this year.
A Snowy Vermont press release yesterday noted the abundant snowfall that has blanketed Vermont’s ski areas all season has continued at a record-breaking pace with snowfall totals that have already shattered the 50-year-old mark for the snowiest February in Vermont’s history. And, the copious snow storms this season have already brought this winter’s accumulation into the top 10 all-time snowiest ski and ride seasons on record. “The theme for this season’s ski and ride season has definitely been an abundance of snow with the best possible timing,” said Parker Riehle, president of Ski Vermont. “Just about every weekend and holiday vacation period this season has greeted skiers and riders with enormous amounts of freshly fallen snow, adding to the already considerable snow pack.”
Central New England too has been snowy. Concord, New Hampshire also has now exceeded 100 inches for the season with another light snow event last night. Thery are now at 102.2 inches for the season. They are closing in on the all-time record of 122 set in 1874. In this New Hampshire Public Radio story, they report the heavy snow is causing problems for many New Hampshire towns and cities.
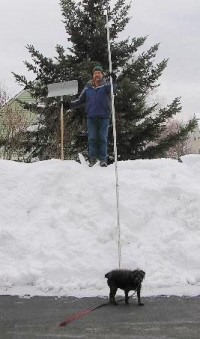
Photo courtesy of Ric Werme in Penacook, straddling the northern edge of Concord
While northern areas have been covered with white all winter, southern areas of New England which had a 100 inch El Nino season a few years ago have had mostly rain this La Nina year. Both provide more evidence other factors like the oceans (and ultimately the sun) control our climate not man.
Update: USATODAY did a story on the record snows this morning. Note ALSO we have just heard from Steamboat Springs ski area in Colorado that they for the first time ever have had over 100 inches in each of the three winter months of December, January and February.
Feb 28, 2008
Snow Disaster Leaves 1.6 mln People Frostbitten in NW China Province
www.chinaview.cn
Severe snow disasters have left 1.65 million people snowblind and frostbitten, 500,000 livestock and wildlife dead and 3.1 million others on verge of starvation in Tibetan prefectures of northwestern Qinghai Province. Since October last year, consecutive low temperature had gripped the province. The temperature plunged to minus 36.3 degrees centigrade, the record lowest in January in the province, said the provincial meteorological bureau.
In Yushu, Guoluo and Huangnan Tibet Autonomous Prefectures, most of the grassland was covered by snow, 16 to 32 cm thick, which had brought great losses to local animal husbandry. In the disaster-stricken prefectures, 130,000 people had run out of fuels, 350,000 people in need of food and 110,000 others short of warm clothes or quilts, said the provincial government. Currently, the province’s task was to evacuate 11,000 people of 2,000 herdsmen households for the local conditions were not fit to live any longer. Winter storms have also plagued southern China since mid-January, leading to widespread traffic jams, structural collapses, blackouts and crop losses in 19 provinces, leaving 129 people dead and causing 151.65 billion yuan of losses, according to the Ministry of Civil Affairs.
Feb 26, 2008
Measuring the Phoenix Urban Heat Island
Climate Skeptic
This is a project my son did for Science Fair to measure the urban heat island effect in Phoenix. The project could also be called “Disproving the IPCC is so easy, a child could do it.” The IPCC claims that the urban heat island effect has a negligible impact, even on surface temperature stations located within urban areas. After seeing our data, this claim will be very hard to believe.
We drove transects two nights in a row. Both nights were cloudless with winds below 5 mph. Ideally, we would have driven between midnight and 6 AM, but this was my kid’s science project and he needs to get to bed so we did it from about 9PM to 11PM. We were concerned that the air might still be cooling during the test, such that as we drove out from town, it might be easy to mix up cooling with time and cooling with location. Our idea for correcting this was to drive and gather data on an entire loop, starting in the center of town, going about 30 miles out, and then returning to the starting point. That way, with data taken in both directions, the results could be averaged and the cooling rate would cancel out. As it turned out, we didn’t even bother to do the averaging. The two trips can be seen in the plots, but the urban heat island shows through pretty clearly in the data and the slope of the line between temperature and distance was about the same on the inbound and outbound legs.
See larger graph here.
I have not inspected their procedure, but looking at the results there seems to be a built-in assumption in the GISS algorithms that they expect an equal chance of a site being biased upwards vs. downwards. In fact, I seem to see more GISS corrections fixing imagined downwards biases than upwards biases. I just don’t see how this is a valid assumption. The reality is that biases in outdoor temperature measurement are much more likely to be upwards than downwards, particularly over the last 50 years of urbanization and even more particularly given the fact that the preferred measuremnt technology, the MMTS station, has a very very short cable length that nearly gaurantees an installation near buildings, pavement, etc.
To this last point, consider this situation: Thermometer one in the city shows 2 degrees of warming. Thermometer two a few hundred kilometers away shows no warming. Someone aware of urban biases without a dog in the hunt would, without other data to guide them, likely put their money on the rural site being correct and the urban site exaggerated or biased. The urban site should be thrown out, not averaged in. However, the folks putting the GISS numbers together are strong global warming believers. They EXPECT to find warming, so when looking at the same situation, absolutely sure in their hearts there should be warming, the site with the 2 degrees of warming looks correct to them and the no warming site looks anomalous. It is for this reason that the GISS methodology should be as public as possible, subject to full criticism by everyone. Read more here.
Feb 25, 2008
Forget Global Warming: Welcome to the New Ice Age
By Lorne Gunter, National Post
Snow cover over North America and much of Siberia, Mongolia and China is greater than at any time since 1966. The U.S. National Climatic Data Center (NCDC) reported that many American cities and towns suffered record cold temperatures in January and early February. According to the NCDC, the average temperature in January “was -0.3 F cooler than the 1901-2000 (20th century) average.” China is surviving its most brutal winter in a century. Temperatures in the normally balmy south were so low for so long that some middle-sized cities went days and even weeks without electricity because once power lines had toppled it was too cold or too icy to repair them.
There have been so many snow and ice storms in Ontario and Quebec in the past two months that the real estate market has felt the pinch as home buyers have stayed home rather than venturing out looking for new houses. In just the first two weeks of February, Toronto received 70 cm of snow, smashing the record of 66.6 cm for the entire month set back in the pre-SUV, pre-Kyoto, pre-carbon footprint days of 1950.
And remember the Arctic Sea ice? The ice we were told so hysterically last fall had melted to its “lowest levels on record? Never mind that those records only date back as far as 1972 and that there is anthropological and geological evidence of much greater melts in the past. The ice is back. Gilles Langis, a senior forecaster with the Canadian Ice Service in Ottawa, says the Arctic winter has been so severe the ice has not only recovered, it is actually 10 to 20 cm thicker in many places than at this time last year. Read more here.
Feb 24, 2008
Atmospheric CO2 and Global Warming
By Z. Jaworowski, T.V. Segalstad, V. Hisdal,
The projections of man-made climate change through burning of fossil carbon fuels (coal, gas, oil) to CO2 gas are based mainly on interpretations of measured CO2 concentrations in the atmosphere and in glacier ice. These measurements and interpretations are subject to serious uncertainties.
As indicated by the measurements of radiocarbon (Carbon 14) from nuclear 14 test explosions the residence time of CO2 in the atmosphere is only 5 years. Assigning a longer atmospheric residence time (up to 200 years) for man-made CO2 was made to fit the pre-conceived idea that the 19th century CO2 atmospheric level was 25% lower than now. The value of about 280 ppmv, widely accepted from glacier studies as the pre-industrial atmospheric CO2 level results from invalid assumptions, processes in ice sheets and artifacts in ice cores.
The atmospheric CO2 is constantly changing and adjusting its concentration according to the natural changes in the Earth’s temperature. These changes are governed by inorganic thermodynamic gaseous, aqueous and mineral equilibria, and by biologic processes. Anthropogenic CO2 is negligibly small compared to the gigantic natural reservoirs and fluxes of natural CO2.
CO2 has a high solubility in water. Lower aqueous solubility of CO2 at higher temperature cause the oceans to degas CO2 to the atmosphere when the sea and air temperature rises as a result of natural climate change. This leads to an increase of CO2 concentration in the atmosphere, which in this case is an effect and not a cause of climatic change. The atmospheric CO2 increases in the 20th century were found to lag behind increases of the surface air temperature. A warming effect of the increased atmospheric CO2 may be counterbalanced by powerful negative feedback mechanisms, such as increasedcloudiness. Radiocarbon (Carbon 14) studies show that the upper ocean turn over the dissolved atmospheric CO2 in a short time (a few decades), thus effectively eliminating the bulk of the man-made CO2.
The exploitable total fossil fuel carbon reservoir is only 11 times larger than the atmospheric carbon reservoir. About fifty parts of CO2 are dissolved in the oceans for each part released to the atmosphere. Therefore, a permanent doubling of the atmospheric CO2 cannot be realized from burning of fossil fuels only, all other things being held constant. There are several methodological uncertainties in the analysis and data processing of the
current atmospheric CO2 concentration. Further investigations of these problems seem necessary. For full paper go here.
This important updated paper challenges current greenhouse theory and data in a very significant way and though technical is worth your reading and consideration. Also take a look at the draft paper by John Nicol in the Climate Library with much additional insight on this important issue.
|
|
|
|

