Aug 23, 2024
How Will New York’s Energy Madness End? The “Don’t Do It!” Report
Francis Menton
I frequently write about how the mandates for energy transition that New York has adopted are impossible and irreconcilable in the real world; and therefore it is inevitable that they will have to be abandoned at some point when implementation of the project runs up against physical reality.
Probably the most frequent question that I get asked is, OK, how and when will that occur?
The question is important because for as long as the impossible mandates remain in place they are causing massive ongoing damage to our electricity system and to consumers. As examples, on the electricity generation side, natural gas power plants that currently supply about half of our electricity are slated for forced closure at the rate of several a year until all of them are closed by 2040. The longer the net zero fantasy goes on, the more difficult and costly it will be to re-open these plants (if they are even still standing), or build new ones. Wind and solar facilities are getting built at the cost of billions, with huge subsidies, producing essentially no useful power. Every time another one gets built, the taxpayers and ratepayers are on the hook to pay its costs for its entire life. On the consumer side, residents of large buildings are under a mandate to discard their current natural gas or oil heat systems in favor of inferior electric heat pumps, at costs estimated at $100,000 per housing unit or more for older buildings. When the net zero project gets abandoned, these massive investments will be a deadweight loss. And there are many other examples of the ongoing damage being caused by the mandates.
So what will be the event that causes the project to crater? If nothing else comes first, at some point we will get hit with a string of catastrophic blackouts. That would surely wake people up and almost certainly force a re-think of the project. But just waiting for this catastrophe to turn things around is not really a great idea, for two reasons: first, to their credit, the people who run the grid are good at keeping it going in difficult circumstances, meaning that we could get “lucky,” and the catastrophe could be postponed for years during which enormous ongoing damage from mal-investment occurs; and the second problem is that when the blackouts come they could cause real human harm and tragedy, such as deaths of people with electric heat who freeze in their apartments. In other words, people who care about New York owe it to their fellow citizens to try to straighten this out before the catastrophe hits.
And thus it comes about that three public-spirited guys, who have been observing the ongoing slow-motion train wreck with horror, have written a Report to urge New Yorkers to defy the statutory mandates to electrify building heat. The title of the Report is “Don’t Do It! Report to New York Co-op and Condo Boards and Trade Associations On LL97 Conversion To Electric Heat.”
The three public-spirited guys are myself and co-authors Roger Caiazza and Richard Ellenbogen. Caiazza is a retired air pollution meteorologist who has a blog called the Pragmatic Environmentalist of New York, where he writes prolifically about New York’s impending energy disaster. Ellenbogen is a Cornell-trained electrical engineer who does not have a big internet presence, but is a very knowledgeable frequent commenter on New York’s various regulator dockets relating to the energy transition, where he pulls no punches. The three of us wrote this Report for no compensation so that nobody could accuse us of being shills for the fossil fuel industry or the real estate industry or any other special interest.
The reason that the Report is directed to condominium and co-op Boards and Trade Associations is that the condo/co-op community represents a group of hundreds of thousands of voters who find themselves in the cross-hairs of New York’s impossible energy mandates. Among other New York residents, small building residents and single-family homeowners have been exempted from the heat conversion mandates (at least for now), while rental tenants are insulated by rent regulations. So the boards and shareholders of the large condos and co-ops are the largest group of residents directly affected by the mandates. Many boards of these buildings are only now starting to look into how to comply with the 2030 mandate to convert to electric heat, and getting feedback from consultants about the enormous costs. Few of them realize that the State at the same time has no credible plan to generate enough electricity to make the heat conversion mandate work.
The distribution of the Report to the relevant communities has recently begun. Daughter Jane - known to readers here as a frequent contributor - has set up a group called New Yorkers for Affordable Reliable Energy ("New Yorkers ARE") to organize grass-roots opposition to complying with the heat conversion mandate. Co-author Roger Caiazza wrote a post for Watts Up With That two weeks ago announcing the issuance of the Report.
I recommend the Report to readers who are at all interested in the depths of ignorance and incompetence of the New York legislators and regulators who are pushing the impossible"energy transition.” It’s only about 15 pages long, with a good Introduction and Executive Summary at the beginning that capture the gist. Here is a summary quote from the Executive Summary:
The Net Zero transition is by far the largest, most expensive and ambitious government-directed project ever undertaken in New York. However, the statutory mandates of the CLCPA and LL 97 have been enacted without:
* Any detailed Feasibility Study of whether this transition is possible under basic physics and existing technology;
* Any Demonstration Project anywhere in the world showing how an electrical grid can function relying on mostly on wind and solar and without emissions-creating resources for back-up of intermittency;
* Any detailed analysis or projection of the costs to New Yorkers of this transition, whether in their capacities as taxpayers or ratepayers or both.
This Report assesses issues of the feasibility and cost of New York’s electricity transition project. The purpose is to advise New York residents, particularly co-op and condo owners and their Boards who are subject to LL 97, on how they should respond to the statutory mandates. The Report reviews facts and data showing that there are strong reasons to believe that the goals that have been set, and mandated by law, are impossible of achievement, let alone at any remotely affordable cost. The State and City have totally failed in their responsibilities to their citizens to assure that the mandates they have enacted are feasible and affordable.
So to get back to the initial question of how New York’s energy madness will end: An alternative to just waiting for the blackouts to come will be for a critical mass of New Yorkers in the cross-hairs of the mandates to refuse to comply and to demand that the mandates be rescinded. We are attempting to start that process into motion. Let’s hope that we have some success.
Jun 21, 2024
Climate activists are wrong about which energy source reduces air pollution
By Steve Goreham
New US-EU Methane Rules Won’t Affect Temperatures
By Steve Goreham—July 9, 2024
“Because of greenhouse gas saturation in the atmosphere, methane regulations across the world will have no measurable effect on global temperatures.”
In March, the U.S. Environmental Protection Agency (EPA) published new methane emissions regulations for the oil and gas industry. The European Union enacted new rules to reduce methane emissions from the energy sector in May. Agriculture is also being targeted regarding methane.
But methane regulations, even if established worldwide, won’t have a measurable effect on global temperatures. However, they will raise costs for energy and food, impacting consumers and businesses.
On March 8, EPA finalized its rule on methane emissions for the oil and gas sector. The rule is intended to “reduce wasteful methane emissions that endanger communities and fuel the climate crisis.” The new policy will require companies to pay a penalty of $900 for every ton of methane emitted above limits set by the EPA, starting this year. A legal challenge to the EPA’s new rule has been filed by 24 states.
On May 27, the European Union (EU) announced new regulations on methane emissions from coal, gas, and oil operations. These rules will require energy firms to monitor and report methane emissions and to reduce methane flaring from operations. The rules also apply to international firms that ship hydrocarbon fuels to Europe.
Background
Methane (CH4) is also called natural gas. It is emitted from oil and gas operations from flaring or system leaks. CH4 is also produced through the decay of organic material, such as from municipal solid waste landfills. The EPA and the EU have proposed methane regulations to try to fight global warming.
But nature and human agriculture are larger sources of methane than the energy industry. Termites and other insects emit large amounts of methane. We have about 1.5 billion cows on Earth, and numerous other livestock and wildlife, emitting methane from both the nose end and the tail end.
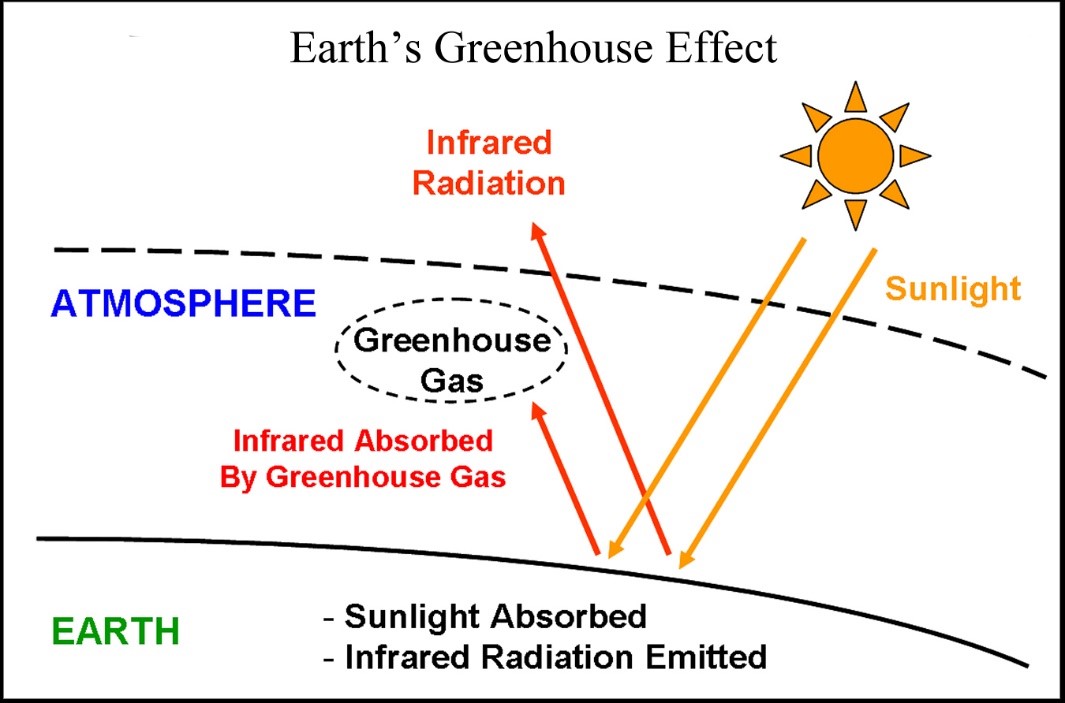
Methane is a greenhouse gas and part of Earth’s greenhouse effect, which is blamed for global warming. Sunlight, which is high-energy radiation, enters the atmosphere and is absorbed by Earth’s surface. Like any warm body, Earth emits radiation. Since Earth’s temperature is lower than that of the sun, Earth emits lower-energy radiation called infrared radiation or longwave radiation, which is not visible to our eyes.
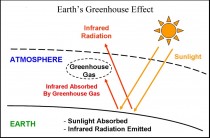
Figure 1.
This longwave radiation seeks to leave Earth’s atmosphere, but almost all of it is absorbed by greenhouse gases in the atmosphere. These gases then re-radiate the absorbed energy, which acts to warm Earth’s surface. The warming caused by the absorption of infrared radiation is called the greenhouse effect. Emissions from human industrial processes add to the effect and increase global temperatures.
But Earth’s greenhouse effect is overwhelmingly a natural effect. Water vapor, not carbon dioxide or methane, is Earth’s dominant greenhouse gas. Water vapor accounts for 70 to 90 percent of the greenhouse effect.
Carbon dioxide (CO2) is the next most important greenhouse gas, but most of the CO2 in the atmosphere comes from nature, such as CO2 emissions from the oceans and the biosphere. Every day, nature puts 20 times as much carbon dioxide into the atmosphere as all human emissions and removes about the same amount. Methane ranks only as a distant third as a greenhouse gas.
Overhyped Contribution
The European Union states:
... methane’s ability to trap heat in the atmosphere is even stronger than that of carbon dioxide. On a 100-year timescale, methane has 28 times greater global warming potential than carbon dioxide and is 84 times more potent on a 20-year timescale.
These widely reported assertions from the EU and other sources are incorrect. Claims about the global warming potential of methane are accurate in the laboratory, but not in the atmosphere.
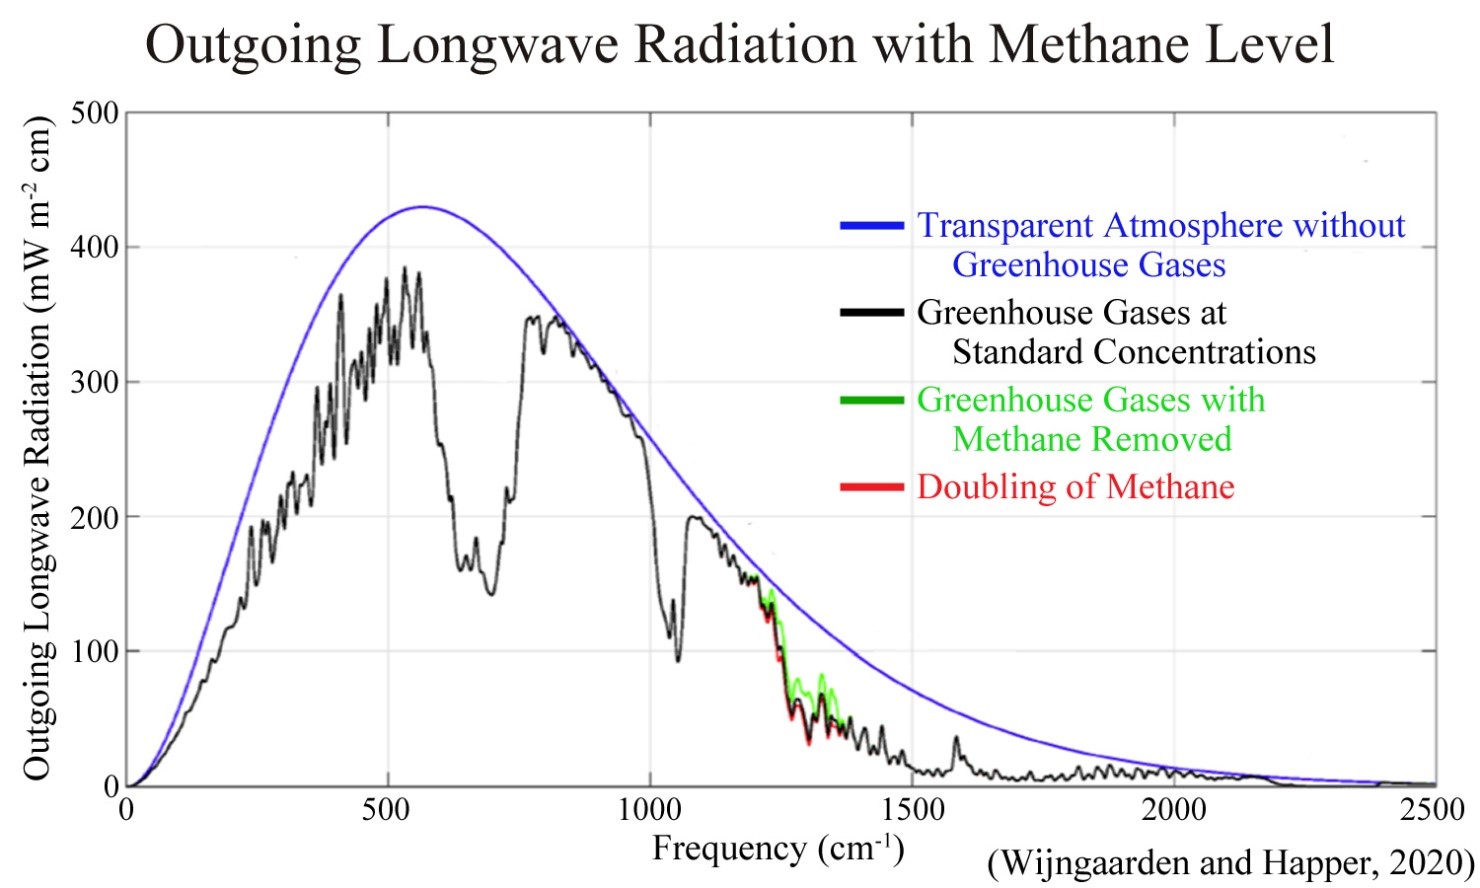
No one paints a room in their house ten times, because after two coats of paint, no difference is observed. Similarly, greenhouse gases are already saturated in Earth’s atmosphere at the frequencies at which methane absorbs outgoing long wave radiation. Additional methane will have almost no effect.
A 2020 analysis by Wijngaarden and Happer looked at the absorption of outgoing long wave radiation by methane and other greenhouse gases across the radiation spectrum. The researchers found that doubling atmospheric methane, from either natural or human causes, would increase greenhouse gas absorption by only about 0.3 percent, a negligible amount.
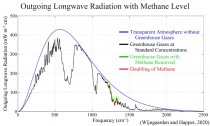
Figure 2.
Farming has become a target for efforts to reduce methane emissions. Earlier this year, New York Attorney General Letitia James sued JBS, the world’s largest beef producer, over the firm’s methane emissions and for allegedly making misleading sustainability statements to the public. The costs of this litigation will add to food price inflation for consumers.
Earlier this year, the EU sought to impose the Sustainable Use Regulation (SUR) on European farmers. Ursula von der Leyen, President of the European Commission, stated that the agricultural sector needed to transition towards a “more sustainable model of production.” Farmers were asked to reduce the size of dairy herds and to limit the use of nitrogen fertilizer to reduce greenhouse gas emissions of methane and nitrous oxide. Germany’s Federal Agricultural Minister, Cem Ozdemir, even proposed a consumption tax on meat.
But angry farmers launched intense protests in France, Germany, Italy, Netherlands, Spain, and other nations. Hundreds of tractors blocked traffic in major cities and police were pelted with eggs and liquid manure. The SUR was defeated, and the EU backed away from additional agricultural regulations, including regulations on methane and the use of nitrogen fertilizer.
Possibly the most bizarre law to reduce emissions was the Australia Carbon Farming Initiative Act of 2011, which awarded carbon credits for killing feral (wild) animals, including:
... the reduction of methane emissions through the management, in a humane manner, of feral goats, feral dear, feral pigs or feral camels.
Killing of animals for carbon credits was halted in 2012.
Conclusion
Greenhouse gas saturation in the atmosphere means that methane regulations across the world will have no measurable effect on global temperatures. But to the extent that they are enacted, these rules will raise the costs of energy and food production and prices to consumers and businesses.
Steve Goreham is a speaker on energy, the environment, and public policy and the author of the new bestselling book Green Breakdown: The Coming Renewable Energy Failure.
-----------
Climate activists are wrong about which energy source reduces air pollution
Today’s media are filled with concerns about air pollution. But few people know which energy source has produced the greatest modern reduction in air pollution. The answer isn’t wind or solar energy.
During the 1950s, my grandfather had a coal furnace in his basement, like many homes in Chicago. Five days after a winter snowfall, the snow was covered with a visible black film of dust from coal furnaces. Our younger generation does not know the original reason for “spring cleaning.” Every spring, homeowners would wash their inside walls to remove coal dust.
It was the rising use of gas fuel, primarily natural gas along with propane, that produced the greatest reduction in air pollution in the United States and across the world. Gas furnaces and stoves have replaced wood in businesses and homes in developed nations. And natural gas power plants have replaced coal-fired plants to generate electricity, with gas becoming the leading fuel for industry.
Natural gas and propane are clean-burning fuels that emit no harmful pollutants when burned. When gas heating is substituted for coal or wood heating, indoor particulate pollution is reduced by 1,000 times.
Today, 70% of U.S. homes use natural gas or propane, a percentage that has been rising for decades. Gas fuels have also become the leading heating and cooking source in Europe, providing 83% of heat energy in the Netherlands and 78% in the United Kingdom. But there are still 70 million wood stoves in Europe.
The World Health Organization estimates that 2 billion people in developing nations still cook using open fires or inefficient stoves fueled by kerosene, biomass (wood, charcoal, animal dung, or crop waste), and coal. These fuels generate harmful indoor air pollution. Indoor air pollution is estimated to cause more than 3 million deaths annually in poor nations. Emerging nations need gas fuels to boost health and well-being.
The great news is that gas fuels are increasingly used in developing nations, reducing illness and death from cooking. For example, in 2016, Indian Prime Minister Narendra Modi launched a program to provide liquid petroleum gas, or LPG, to 200 million people, making India the second largest LPG importer. About 70% of U.S. propane production is exported as the key component of LPG, mostly to Eastern Asia.
In fact, gas has become the primary fuel for generating electricity in developed nations over the last three decades. Natural gas rose from 12.6% of U.S. electricity generation in 1990 to 43.1% in 2023. By 2022, gas had become the leading fuel for electric power in Italy, at 48%, the Netherlands, at 59%, and the U.K., at 36%.
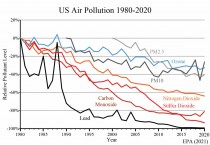
The combination of rising gas use to generate electricity, the use of scrubbers on coal plants, and the reduction in vehicle pollution has produced vastly improved air quality in recent decades. The Environmental Protection Agency reports that ambient air pollution declined by 78% from 1970 to 2020.
Despite the benefits of reduced indoor and outdoor pollution from rising gas use, gas fuels are under attack. Driven by the ideology of climatism, the fear of human-caused climate change, advocates of net-zero energy policies demand the elimination of gas to reduce carbon dioxide emissions.
But carbon dioxide is an odorless, harmless, invisible gas. It doesn’t cause smoke or smog. Increased levels of atmospheric CO2 boost plant growth. Carbon dioxide should not be called a pollutant.
Nevertheless, President Joe Biden, Canadian Prime Minister Justin Trudeau, and other leaders have called for a net-zero electric grid by 2035. Twenty-three states now have net-zero electricity targets by 2050. Austria, Belgium, France, Germany, Luxembourg, the Netherlands, and Switzerland, totaling about half of Europe’s electricity, have pledged to eliminate CO2-emitting power plants by 2035.
A war rages in Europe over the elimination of gas appliances. The governments of Germany, the Netherlands, and the U.K. seek to force homeowners to spend thousands of euros or pounds to switch from gas appliances to electric heat pumps to reduce CO2 emissions. Amsterdam recently announced that it would become “aardgasvrij,” or gas-free, by 2040. But conservative gains in European Union elections this month reflect a popular backlash against efforts to eliminate gas fuels and force acceptance of net-zero policies.
In the U.S., cities and counties in six states, California, Massachusetts, Maryland, New York, Oregon, and Washington, along with Washington, D.C., enacted statutes banning natural gas in new construction. New York passed the All Electric Buildings Act in 2023, a statewide ban prohibiting gas appliances in new one- to six-story buildings by 2026. But 20 other states have passed laws preventing local governments from passing ordinances that ban gas fuels.
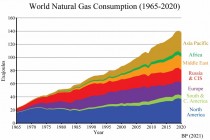
Despite misguided government efforts to eliminate gas, consumption of natural gas and other gas fuels continues to rise. World natural gas consumption has doubled since 1995.
Green energy advocates have it exactly wrong. The adoption of gas fuels did more to reduce air pollution over the last 60 years than any other energy source. And gas consumption will continue to rise for decades to come.
Steve Goreham is a speaker on energy, the environment, and public policy and the author of the bestselling book Green Breakdown: The Coming Renewable Energy Failure.
May 24, 2024
Climate Stupidity
By James T. Moodey
Before the post...this from Mike Smith with examples.
As We Close Out May: State Record Hot Temperatures
By Mike Smith - May 31, 2024
Now we are one day from meteorological summer, we will be bombarded by climate activists trying to tie global warming into every heat wave. Earlier today I wrote about how the Tonga Volcano is causing—natural—heat waves even years after the eruption.
Below is a map showing the year that each state’s record high temperatures were set for the month of May.
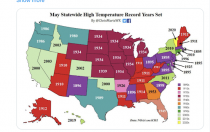
Enlarged
Note how relatively few of them occurred post 2000. Some were set more than 100 years ago. So, when the MSM attempts to tie global warming to hot temperatures, please keep this map in mind. Humans affect the weather --no question—but it is not the primary mechanism.
One other item:
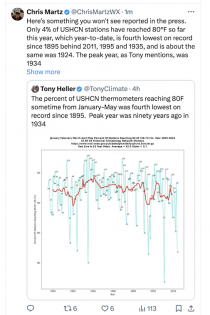
Enlarged
----------
Back to Climate Stupidity
The specific gravity of carbon dioxide is 1.52 relative to dry air - the same weight as propane. It is even heavier in relation to our humid atmosphere, ranging around 1.61. It falls through the atmosphere about like a cottonseed. Wind can blow it upward, but it falls right back down. It acts like rainwater, seeking low points. We do not need to build pipelines to inject it into the ground. It sinks into to the ground all by itself.
Photosynthesis (CO2 + Sunlight + H2O) cannot exist without carbon dioxide. Photosynthesis uses sunlight to transform carbon dioxide into glucose and other organic compounds that make plants, and it transforms water into oxygen, which is exuded.
We breathe in oxygen and exhale carbon dioxide. Plants absorb carbon dioxide and give us oxygen. As Patrick Moore (co-founder of Greenpeace) has pointed out for over ten years, carbon dioxide is critical to the life cycle of the plant and animal kingdoms. He has referenced analysis that indicates that nearly triple the carbon dioxide content in our atmosphere would be more ideal for plant life. He is correct.
“[An] increase in carbon dioxide directly increases plant photosynthesis. If photosynthesis ceased, there would soon be little food or other organic matter on Earth. Most organisms would disappear, and in time Earth’s atmosphere would become nearly devoid of gaseous oxygen” (Britannica, ref. Plant Physiology, Salisbury, and Ross).
Furthermore, carbon dioxide does not cause warming. It cools 20 degrees Fahrenheit in less than 4 minutes. It cannot possibly retain heat from day to day (global warming). We know this because we measured it at my gas-physics Weights and Measures facility. We also measured humid atmosphere including all the trace gases therein. That cools about 1 degree every 32 minutes, or 20 degrees in roughly 11 hours.
Carbon dioxide will therefore cool as fast as the Sun and the atmosphere allow it to cool. Even our humid atmosphere cools too quickly to retain heat from day to day. The latter test also proves that no gas - not carbon dioxide, nitrogen, methane, or even humid air - retains temperature from day to day. These experiments are detailed in the book referenced below.
The stupidity began in 1988, when James Hansen, who coined the term “global warming,” flip-flopped from “global cooling” to “global warming” being dangerous. He testified before Al Gore’s committee and Gore fed the fear with $22 billion in annual funding for universities and professors to study the matter. Hansen’s claim is a falsehood. People move to warmer climates for their health. Consider all the species, in the plant and animal kingdoms, that thrive near the equator, and none survives at the poles.
Yet, out of desperation for the money, professors cornered themselves into attempts to prove a falsehood true. To do that, one must lie or proffer chimerical theories. This has led climate change activists to demand devastating economic rules to assuage their self-induced fears. They fear a recurrence of the 1.16 degrees Fahrenheit global temperature rise over the past century; meanwhile, temperatures rise and fall 20 degrees each day. They fear that sea levels might rise millimeters in decades to come while tides rise and fall six feet each day.
Ever wonder why they decided to vilify CO2 rather than smog? This mental disintegration began with our first climate change bureaucracy. The Federal Clean Air Act authorized states to make their own rules. What a mistake that was.
See CO2 the Gas of Life here See Carbon Dioxide: The Gas of Life. Tiny amounts of this miracle molecule make life on Earth possible. It is a Special Report for the Committee For A Constructive Tomorrow By Paul Driessen.
-----------
The logic of global warming alarmism - i.e., fear of the hand of man - is a sign of the times. What about nature’s footprint?
GW has been called a mass mania. Is it more? Is it an anti-humanism that would consign humanity’s future to the whims of anti-industrialist Utopians in Ivory Towers? Is it a new age doomsday religion preaching apocalyptic Thermageddon? Has government-funded production of hybrid cars become a Golden Calf?
Realists have been watching this dumbing-down of society and the government-funded education system for years. Global warming alarmism is just one of many indications of the spiral into oblivion of Western civilization.
Leading the spiral down are accepted behaviors that lead to the ruction of morals, ethics and even the principles of the scientific method. These accepted behaviors undermine our personal faith and shared cultural confidence in our abilities to overcome ignorance and superstition with reason and knowledge. They rub all of our collective noses in societies’ lack of will to discriminate between good and bad.
We no longer feel the need to reward excellence and personal achievement over self-destruction and self-defeating nihilism. If you don’t know and understand that fear of global warming is simply a symptom of a sick, corrupt and mentally dysfunctional zeitgeist - a case of global societal ADHD that has spread across and infected all of the Leftist and liberal fascists in the Northern hemisphere- then, answer these questions:
“Why do scientists and news stories blame everything on global warming?
“… Why is warming always framed as bad news?
“Why does so much ‘research’ claim a warmer planet ‘may’ lead to more diarrhea, acne and childhood insomnia, more juvenile delinquency, war, violent crime and prostitution, death of the Loch Ness Monster - and even more Mongolian cows dying from cold weather?
“… Why is it a bad thing that more CO2 helps plants tolerate droughts better and re-vegetate deserts?
“...Why do ‘error corrections’ always seem to result in more warming than originally predicted, instead of less?
“ And why do taxpayers have to shell out Big Bucks on this stuff?
“… If we didn’t know better, we’d think the operative rules were: Never seek logical or alternative answers, if you can blame a phenomenon or problem (like decreasing frog populations) on global warming. Do whatever it takes and fund whatever research is needed, to advance the goals of ending hydrocarbon use, increasing government control and ‘transforming’ society. And always include the terms ‘global warming’ or ‘climate change’ in any grant application.
“It may not be corruption. But it sure skews the research, conclusions and policy recommendations.”
Driessen P, Soon W, Legates DR. Cause for alarm? (May 23, 2010)
Will the Left apologize to the American people for blaming George Bush and not Katrina for flooding New Orleans?
Who plays politics with the weather? It goes back to Al Gore, VP under Bill Clinton. The motivation behind the fearmongering about deep and disastrous climate change disruption has nothing to do with what is good for the people; and, it has everything to do with more power to an out-of-control federal bureaucracy that has grown too large to fail. Only the dishonest refuse to admit global warming is a Left vs. right issue that is more social than science.
Climatists of global warming alarmism essentially have given up pretending that they can use science to make their case against Western industrial man; they’ve given up on reason. The climatism of the weather fearmongers has evolved to the point now where it has the credibility of earthquake prediction science. The official ‘science’ of the global warming alarmist community is simply to pray for catastrophe and then point. The only real ‘consensus’ that exists, now that Bush is gone, is to simply blame capitalism whatever Nature brings our way.
See, e.g.:
This by Judith Curry here , and comments by WUWT in weekly roundup here.
Terence Corcoran (Financial Post, 29-Oct-12) gets it and correctly exposes the warp and woof of the Left’s hype machinery, busily weaving hairshirts for the rest of us to wear, as follows: As gloom descended over the warmist camps across the continent, their overheated claims flickering dimly like dying campfires, their cause lost, there suddenly rose in the East a powerful force [Hurricane Sandy]. Look! What’s that on the horizon? A mighty blast of good news! FRANKENSTORM...The Natural Resources Defence Fund tweeted the blessed arrival of Sandy. Soon the idea [i.e., linking carbon emissions with natural disasters] was in all the media where such junk science routinely finds a home: The Huffington Post, The Atlantic, blogs at The Washington Post.
May 08, 2024
Young adults losing the climate faith in the US, one third of voters think IPCC experts are right
By Jo Nova
Good news: despite 2023 being the hottest year since Homo Erectus, there was a 17% fall in the number of 18 to 34 year olds who call “Climate change” a very serious problem. Even though there were hottest-ever-headlines month after month, the punters lost the faith.
No one is cracking champagne, because 50% of young adults still tell pollsters they think it is a “very serious problem”. But when all is said and done, at least half the generation that was drip-fed the dogma since kindergarten, can not only see through the catastrophism but they are brave enough to tell a pollster that too.
For the most part, after a few hot El Nino years, “climate fear” is back where it was in 2016 or so. Most people still want the government to solve the weather with someone else’s money. But where younger people were once much more enthusiastic about a Big Government fix than older people were, now that gap is almost closed. What was a 21% difference between those age groups is now only 2%. That’s a whopping fall in faith in the government to do something useful, or probably, a recognition that whatever the government does, it will cost too much.
Looks like young adults are learning to be cynical adults faster?
The Monmouth university group polled 804 people in late April:
Climate Change Concerns Dip: Younger adults express less urgency than in prior polls
The percentage of Americans between the ages of 18 and 34 who see climate change as a very serious problem has fallen by 17 points in the past three years (50%, down from 67% in 2021), compared with smaller declines among those who are 35 to 54 years old (44%, down from 48%) and those age 55 and older (44%, down from 54%).
Monmouth poll on Climate Change
But what does “a very serious problem” even mean?
Anyone can say “it’s serious” but only 1 in 6 people can even be bothered pretending to a pollster that climate change influences their vote:
A Monmouth poll released last month found only 15% of voters view climate change as a determinative issue in how they will vote in the 2024 presidential election, ranking far lower than inflation, immigration, and abortion.
People used to lie to pollsters and say they cared and it would affect their vote, but now most don’t even pretend. In 2019 in the UK two-thirds of people agreed climate was the biggest issue facing humankind. The Guardian writers were sure that climate change would determine how most of the voters would vote, but the party promising to give them better weather lost in a landslide.
In 2015, when nearly half of US voters said climate was a “very serious problem”, other surveys showed only 3% ranked climate change as the most important issue.
If a twenty-something really believed the Antarctic ice cap was about to melt, wouldn’t it rate as a voting issue?
------------
Wide Awake Media
@wideawake_media
One of the world’s most respected scholars, Thomas Sowell, on the “man-made global warming"” scam:
“Temperatures went up first, and then there was the increase in CO2. You can’t say that A causes B if B happens first… But [the scientists] who are pushing global warming are doing their damnedest to make sure that those who believe the opposite don’t get heard in the public.”
Fully 92% of Democrat voters says they think climate change is real. (What else could they say, they’d be excommunicated from friends and family if they said anything else.) Only 51% of Republicans tell pollsters they think climate change is real. But imagine how fast that would plummet if skeptical professors were interviewed on TV, and half of Republican politicians spoke for half the Republican voters?
Only a third of voters agree with the UN Experts that climate change is mainly a human driven thing
Despite the UN experts being 97% certain, only one third of voters completely agree with them. That’s really quite astounding.
Public opinion remains mixed on the degree to which human behavior contributes to change in the climate. Just over one-third (34%) say climate change is caused mainly by human activity while 31% say human activity and natural changes in the environment play equal roles. Another 7% put climate change down mainly to natural causes, with the remainder saying climate change is not happening (23%) or are not sure if it is happening (4%). Just over half of Americans (51%) say there is still time to prevent the worst effects of climate change while just 17% say it is too late.
After thirty years of scientific and media purity, only one third think climate change is “mostly human”. Another third think the UN must be exaggerating, and the last third know the UN is wrong.
REFERENCE
The Monmouth University poll, Climate Change Concerns Dip, May 6th, 2024
See Mark Perry’s post of the IPCC predictions are 0 ot 50 correct here.
------------
Wide Awake Media
@wideawake_media
One of the world’s most respected scholars, Thomas Sowell, on the “man-made global warming"” scam:
“Temperatures went up first, and then there was the increase in CO2. You can’t say that A causes B if B happens first… But [the scientists] who are pushing global warming are doing their damnedest to make sure that those who believe the opposite don’t get heard in the public.”
See video here
May 04, 2024
Radical leftists say oil companies are committing climate murder!
Paul Driessen
With little but GIGO computer models to support them, climate activists in and out of government block pipelines, file lawsuits to bankrupt fossil fuel projects, and promote bizarre views about “climate justice.” Their latest scheme proposes that DAs and AGs prosecute oil companies for “climate homicide,” for supposedly killing people by causing deadlier hurricanes, tornadoes, floods, droughts, heatwaves, blizzards and wildfires. They refuse to discuss the absence of evidence for these supposed manmade climate disasters and deaths.
But what they really don’t want to discuss is: Who is actually committing mass murder, especially of women, children, people of color and other “particularly threatened” groups so supposedly beloved by climate justice warriors? That’s because the real serial killers are those environmental extremists - who deny the world’s poorest people access to the energy, disease control and agriculture that makes modern living standards, healthcare and life itself possible.
I address all these issues in my new commentary. Thank you for posting it, quoting from it, and forwarding it to your friends and colleagues.
Best regards,
Paul
Radical leftists say oil companies are committing climate murder!
They’re gaslighting voters and consumers - when the real mass killers are environmentalists
Paul Driessen
We’re constantly told fossil fuel use is causing an existential climate crisis, extreme weather, worsening wildfires, and more frequent and intense hurricanes, tornadoes, floods and droughts.
Actual temperature, storm and other records provide no support for these claims. They certainly don’t back up ludicrous assertions that burning coal, oil and natural gas - and even human breathing and baking pizzas in wood-fired ovens - are causing countless alleged calamities: such as slowing Earth’s rotation, thereby affecting scientific time clocks (by one second). The fact is, Earth’s climate is perfectly healthy.
The claims are based primarily on computer models that erroneously assume carbon dioxide and a few other “greenhouse gases” (0.05% of Earth’s atmosphere, in total) control the climate, while the sun plays virtually no role, urban heat islands are inconsequential, and incompetent forest management is irrelevant.
It’s gaslighting: perversions of truth designed to make us guilt-ridden, willing to slash our living standards, and happy to keep poor countries energy-deprived and impoverished.
In the USA and worldwide, fossil fuels still provide 80% of total energy. They’re also the foundation for our economy, living standards, health and longevity - and over 6,000 vital products, including plastics, paints, pharmaceuticals, cosmetics, cell phones, eyeglasses, fertilizers and wind turbine blades.
“Earth-friendly” wind and solar installations would blanket millions of acres of farmland, scenic areas and wildlife habitats; require billions of tons of ores; generate billions of tons of toxic water and air pollution from mining and manufacturing; and send electricity prices skyrocketing to pay for expensive battery or gas backup systems, and extensive new transmission lines and grid upgrades.
Climate Defiance, Extinction Rebellion and other radical groups nevertheless block pipelines, rant and rampage through our streets, deface priceless artwork, and glue themselves to roads and statues, to intimidate legislators and regulators.
Others file endless lawsuits to bankrupt fossil fuel projects and promote their twisted views about “climate justice.” Their latest scheme could be viewed as the culmination of their self-indoctrination.
A recent Harvard Environmental Law Review article proposes prosecuting major oil companies for “climate homicide” and “mass murder” - for supposedly killing people, by raising global temperatures and sea levels, and causing deadlier hurricanes, tornadoes, floods, droughts, heatwaves, blizzards and wildfires.
Media outlets eagerly promoted the claims - and Soros-funded prosecutors will undoubtedly be thrilled to indict ExxonMobil and other companies, once they’ve put more flash-mob thieves back on our streets.
But not even these prosecutors - or any judge, jury or “expert witness” - can separate natural from human causes of modern climate change. Nor can they calculate fractions of manmade-climate-change-induced disasters attributable to coal, oil, gas, dung, or “renewable” energy mining and manufacturing; to China and India versus Europe and the United States; or certainly to specific energy companies.
What they really don"t want addressed in this “climate homicide” discussion, however, is who is actually committing mass murder, especially of women and children, people with disabilities, people of color and other “particularly threatened” groups so supposedly beloved by climate justice warriors.
My book, Eco-Imperialism: Green power - Black death, forcefully demonstrates that it is these self-righteous climate and environmental activists, and those who fund them, that are callously causing the eco-murder deaths of millions every year - and setting the stage for dramatically more in the future.
These environmentalist death tolls have worsened, as greens became wealthier, more powerful, more fanatical, and more influential with and within US, EU and UN government agencies.
More than 750 million people still have no access to electricity; nearly 2 billion have only sporadic access to barely enough electricity to charge cell phones and power a lightbulb or 1-cubic-foot refrigerator - and no juice for modern homes, schools and hospitals, water purification, or factories and other job-creating businesses.
These people are forced to heat and cook with wood, charcoal or animal dung, inhaling noxious fumes that cause millions of deaths annually from respiratory diseases. Millions more die annually from intestinal diseases due to contaminated water and spoiled food, due to energy deprivation.
Green fanatics perpetuate the death tolls, by battling anything except grossly insufficient, weather-dependent wind and solar power. (In European and other modern countries, people die of heatstroke when they cannot get or afford air conditioning; nine times more die from cold - from hypothermia and illnesses they’d normally survive if they could afford to heat their homes properly.)
The fanatics also wage campaigns to deny Third World people access to insecticides and spatial insect repellants that would control disease-carrying flies and mosquitoes and even modern farming practices and technologies. Millions more thus die every year from diseases that are readily preventable or could be cured in modern hospitals (that don’t exist).
No wonder developing nations increasingly reject Western carbon colonialism.
Radical food groups despise genetically engineered crops that multiply crop yields, survive droughts and slash pesticide spraying by 75% or more. They vilify Golden Rice, which enables malnourished children to avoid Vitamin A Deficiency, blindness and death.
They demand “AgroEcology,” which rejects virtually everything that helps modern farmers feed billions more people (read this article!) with less acreage and water, and could largely eliminate hunger and malnutrition worldwide. The perverse movement rabidly opposes biotechnology, chemical insecticides, nitrogen fertilizers, and even hybrid seeds, monoculture farming and mechanized equipment like tractors.
It demands “food sovereignty” for impoverished, malnourished Africans, Asians and Latin Americans - the right to “define their own food and agriculture systems” and have “healthy and culturally appropriate” food produced through “ecologically sound and sustainable methods.”
Even more bizarre and frightening, major philanthropies like the Rockefeller Foundation and Walton Family Foundation support this craziness! So do the World Bank and many UN agencies.
They say the world’s food production systems should be “aligned” with the purely arbitrary goal of preventing more than 1.5C of global warming since 1850, by “phasing out fossil fuel use, especially fossil-fuel-based chemicals in industrial agriculture.”
Farmers who want to “define their own food and agriculture systems” by choosing modern technologies and practices get ostracized instead of supported.
It’s increasingly obvious that climate fear-mongering and GIGO computer models have replaced evidence-based science, history, human nutrition needs and traditional ethical principles. More and more, it is regulating and academic elites versus the rest of us, in rich and poor countries alike.
But on a more positive note, climate cultists chomping at the bit to see oil companies prosecuted for climate murder should be careful what they wish for. Such a precedent could put eco-imperialists and their financiers on trial for manslaughter on a truly horrific scale.
Paul Driessen is senior policy analyst for the Committee For A Constructive Tomorrow (www.CFACT.org), and author of articles and books on environmental, climate and human rights issues. Contact me at pkdriessen@gmail.com
|

