Sep 07, 2007
Californian Glaciers Defy Global Warming
By John Iander, CBS
The debate over global warming has taken a pretty odd twist in Northern California. Up on Mount Shasta, the glaciers are not behaving like you’d expect.
Big mountains often produce their own weather patterns. Mount Shasta, at 14,162 feet seems to have a mind of its own these days. Shasta has seven glaciers. The biggest is the one on the middle, Whitney Glacier. What has surprised scientists about the glacier is that if the theories about global warming are true, the glacier ought to be shrinking, but it’s not.
“Unlike most areas around the world, these glaciers are advancing, they are growing. Thirty percent in the last fifty years,” says scientist Erik White. So why are the glaciers larger today than they were a century or more ago? “Mount Shasta is right at the very northern end of areas influenced by El Nino and we’re at the southern end of areas affected by La Nina. So between the two we get to see the benefits of that which means more snow and rain in this area,” says White.
Read more here.
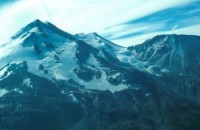
Whitney and Bolam Glaciers - photo by Linda Freeman, 1998
Sep 06, 2007
Cooking Up Global Warming
by Christopher C. Horner
A very embarrassing chapter in the history of our nation’s scientific establishment has been unfolding thanks to a creative new website www.SurfaceStations.org set up and run by Anthony Watts. This site is providing unwelcome scrutiny to the United States surface temperature measurement network, supposedly the most reliable in the world. The reputation has been built over the years in part because of our governments purported insistence on uniformity of technology as well as siting (putting the gauges where they will gather the most accurate data) and maintenance standards.
But if you place your measuring equipment in the wrong place you could help start a global warming panic. Which is, apparently, just what government bureaucrats are doing. Recently, evidence increasingly made its way to people who pay attention to such things that that our networks reliability was not all that it was cracked up to be, that there just might be misplacement of measurement instruments enhancing a mild warming trend begun in the late 1970s that otherwise seems to have stopped. Now, a full-blown scandal is erupting, exposing the expensive U.S. surface measurements as quite possibly not much more than yet another tool in the global warming alarmists kit to frighten taxpayers into accepting a radical eco-lifestyle agenda.
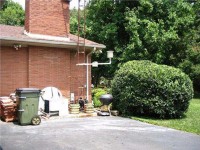
It seems fair to conclude that siting thermometers in Arizona parking lots, overhanging black asphalt pads, near cell towers and hot-air blowing air conditioner exhausts or next to trash burn barrels has to result from either a complete breakdown of scientific discipline or an intent to skew the data to produce evidence of global warming. But what can you say about setting one just away from a chimney directly above a Weber barbecue grill? Thats just what they did in Hopkinsville, KY. These practices would be hilarious if they didnt result in large amounts of corrupted data upon which our policymakers desperately seek to base an energy scarcity regime.
Read more here.
Aug 28, 2007
The New Math on Global Warming
By Dennis T. Avery
The UN climate change panel told us in 2001 that human-emitted CO2 might drive the planet’s average temperature upward by 5.8 degrees Ca bigger average warming than the world has had in the past 100,000 years. The UN’s 2007 report scales the possible overheating back a bit, to a maximum of 4.5degreesstill a very large warming.
But wait! The environmental movement is now conceding that the earth has a natural, moderate climate cycle. Jon Coifman of the Natural Resources Defense Council said recently on the Hannity and Colmes TV show, “The earth has natural temperature and climate cycles. Nobody has disputed that.”
The earth has warmed only a net 0.2 degrees C of net warming since 1940. Human-emitted CO2 gets the blame for only half of thator 0.1 degree C of warming over 65 years! We’ve had no warming at all since 1998.
Remember, too, that each added unit of CO2 has less impact on the climate. The first 40 parts per million of human-emitted CO2 added to the atmosphere in the 1940s had as much climate impact as the next 360 ppm.
Why does NRDC say that the earth has reached a “crisis tipping point” when we’ve had only 0.2 degrees C of warming over the last 65 yearsand no warming at all over the past eight years? How do the Greens project a mind-numbing surge of global warming from this New Math on Global Warming?
Is the emerging evidence of the natural cycle the real crisis for Al Gore and the warming alarmists? Read more here.
Aug 27, 2007
Whoops! Hottest Years Were in 1930s
By Brad Knickerbocker
Was 1998 the hottest year in United States history, as most reporting on climate change has presumed? Or was that record set back in 1934 before “global warming” became a scary household phrase? A corrective tweak to National Aeronautics and Space Administration’s formulation shows that the hottest year on record in the United States indeed was back during the Dust Bowl days. But does this mean that all the concern about global warming being a relatively recent phenomenon tied to carbon-belching power plants and hulking SUVs is a bunch of Al Gore hooey?
Climate change skeptics and their cheering section among conservative bloggers and radio shoutmeisters think so --even though most scientists say, no, the tweak is not a big deal and overall trends are in the direction of toastier days around the globe.
Is the issue settled? Far from it, says Roy Spencer, a principal research scientist for the University of Alabama, who describes himself as “skeptical of the claim that global warming is mostly manmade.” Blogging on TCSDaily.com, Spencer writes: “In case you hadn’t noticed, the global warming debate has now escalated from a minor skirmish to an all-out war. ... In the last year or so, more and more scientists have been coming out of the closet and admitting they’ve had some doubts about this whole global warming thing.” Read more here.
NASA GISS US Annual mean temperatures since 1930. Trend is just 0.12C (0.21F) over the 76 year period.
Aug 24, 2007
Taming the Hurricane
By World Climate Report
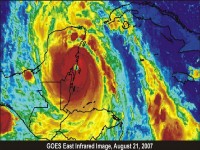
On September 28, 1955, a Category 5 hurricane named Janet slammed into Chetumal, on Mexicos Yucatan Peninsula, killing over 600 people. Hurricane Dean, another Category 5, and the third-strongest storm ever measured at landfall, hit in exactly the same place earlier this week (Tuesday, August 21,2007) and killed no one. Maximum winds in both storms were indistinguishable. Probably for the first time in human history, a Category 5 storm hit a populated area and everyone lived.
Because of its peculiar location, the Yucatan takes more big hurricane hits than just about anywhere else in the western hemisphere. When Mexico was dirt-poor, as it was in 1955, hurricanes could kill hundreds. They were warned, then, too.
Similar storms, huge storms, very different results. Whats happening here? Since then, people in the Yucatan have learned to adapt. While storms like these used to kill hundreds, even thousands, we now have the technology to forecast their tracks, at least for the critical last 24 hours, with reasonable confidence.
Anyone concerned about climate change should take a lesson from Hurricane Dean. Even if storms like this become more frequent in the future, people will adapt and survive if they have the financial resources. How silly it seems to take those resources away in futile attempts to stop global warmingwhich no one even knows how to dowhen they could save lives by allowing people to adapt to our ever-changing climate. Read full report here.
|

