May 26, 2011
Coup de Grace for Imposed Ignorance
By Joseph A Olson, PE
Thankfully the iron curtain of elitist imposed ignorance is falling. It is most fitting that the perestroika moment for humanity and our new century of truth based reality began with the final and most ambitious of the elitist power grabs, the theater of the absurd global warmists.
In recent weeks the Catholic Church rubber stamped a Papal Announcement on human caused global warming and endorsed the Anthropocene with the threat that ‘humans were going to have to live in the world they have created.’ For those of us with trust in humanity, that moment cannot come moment too soon.
So what would possess the church to create the modern equivalent of the Pontifical Academy Trial of Galileo ? Well, it could be that the wise Vatican investors got an insider’s investment tip that the global warming science was government funded certainty and that the carbon commodity trading would be a guaranteed growth market.
With an estimated 30% of the Nuns & Priests retirement fund ‘invested’ in a commodity that shrank from $100 per ton to $0.05 per ton in 2010, what is a good Pope to do ? It is a clear choice whether to fleece the brothers and sisters of the cloth or the flock. The Pope chose to spare the shepherds and fleece the sheep.
Much has already been written about this greatest of human watershed events since the original Renaissance. Much more will be written before the Nouveau Renaissance is complete. As a lifelong student of science and history, an independent thinker and a latent agitator, I chose to enter this greatest of human debates.
I have been blessed in this venture with trusting web hosts and an equally qualified, dedicated group of science professionals. Science is an iterative process, with properly gathered and analyzed empirical data always guiding the scientist to the hidden truths of reality. Nature may withhold the truth, but readily exposes the lie.
And so it is with ‘Carbon Dioxide caused climate change’ hypothesis, a predetermined outcome that ‘we needed energy taxes’ and a willing group of science sell-outs who would create any hypothesis and data necessary to meet that goal. To accomplish this greatest FRAUD in all human history took an international cast of villains and an elaborate plan.
In his excellent investigation of one critical aspect of the scam, author A W Montford exposes the shabby history of The Hockey Stick Illusion. This book covers the dogged efforts of Steve McIntyre and his associate Ross McKitrick to unravel the deceitful graphic that was to mobilize the carbon tax movement. Montford’s 450 page work is exhaustive, but consider these two quotes:
Climatologists Rosanne D’Arrigo and Gordon Jacoby had produced temperature record based on ten sites out of 36 sites studied. When it was suggested that this might be ‘cherry-picking’ data for a predetermined outcome, Jacoby responded:
“If we get a good climatic story from a chronology, we write a paper using it, that is our funded mission. It does not make sense to expend on marginal or poor data and it is a waste of agency and taxpayer dollars. The rejected data are set aside and not archived.”
Taxpayers funded a wide range of data collection and then the agenda driven gatekeepers destroyed all data that did not fit the required narrative. News of gross statistical errors and selective data use prompted Congress to demand an investigation of the UN IPCC claims. Rather than allow our elected officials to ask embarrassing questions or provide testimony from non-managed witnesses, the great protector of government science fraud, the National Academy of Science offered to investigate the allegations.
After days of testimony that proved the ‘hockey stick’ was at best questionable, the NAS panel “had been forced to rely on the somewhat dubious argument that Mann had used incorrect methods and inappropriate data but had somehow still managed to reach the right answer.” In this case the “right answer” was what the government funded NAS was requested to find by the government.
If the ‘fox guarding the henhouse’ aspect of the government investigating itself sounds troubling, the twisted peer review process is even more disturbing. Montford provides a ‘spider chart’ showing the interconnection of government funded Climatologists being the only scientist to review their own work. As the Climate-gate emails disclose, the ‘hockey stick team’ had no problem retaliating against the editors or the scientific journals who dared oppose the warming mantra.
Given the massive taxation and regulation that was proposed there was the foreseeable problem of scientific opposition. The goal was always to focus all climate behavior on the atmosphere. The highest objective was to demonize carbon dioxide for tax and control purposes, failing that to at least keep the option of aerial spraying for geo-engineering. The debate managers needed a controlled science position to counter the warmists.
Where the alarmist warmists would claim a 3C temperature rise and 3 meter sea level rise, the soon labeled ‘Luke Warmists’ would claim that it would only be 1C and 1 meter sea level rise. The narrative was then reinforced by NEVER confronting the false premise, but only the degree of change. In his article “The Corporate Climate Coup”, historian David F Nobel documents how the elitists created and funded the ‘two sides’ of this faux debate. [1]
The carbon dioxide forcing and back radiation narrative were complete fictitious fabrications. What the warmists and the luke warmist collaborators have tried to claim is that all weather and climate is the result of a human caused trace gas. What is missing are the two great heat sources of the Sun and the Earth’s internal fission. It is fluctuations in these two great energy forces that are the real climate drivers, and humans have no influence over either force.
Many fine scientists have explored the solar factors in Earth’s climate, while I have concentrated my efforts on the under-researched Earth fission factor. I have an extensive lecture series covering this subject in archive at ClimateRealists.com, at CanadaFreePress.com and at my website FauxScienceSlayers.com. My chapter in the co-authored science text, Slaying the Sky Dragon combines and expands this fission research in one location.
As mentioned earlier, science is an iterative process and since the publishing of our epic science book my co-authors, aka “Slayers” have become what science peer review groups should be, an international, interdisciplinary team of professionals dedicated to finding and sharing the truth. We have expanded the number of Slayers and our scope. There has been ongoing research and a number of updates. It is now time to update two of the previous articles.
In late Jan, 2011 the Slayers engaged a group of Luke Warmists in an on-line peer review. The result was that we realized the Lukes where clueless about the Outgoing Longwave Radiation (OLR) that they claimed was trapped by CO2 and then warming the planet. My article, “OMG...Maximum Carbon Dioxide Will Warm for 20 Milliseconds” [2] explained that since OLR moved at the speed of light there could only be very limited ‘dwell’ time between Earth’s surface and outer space.
Fellow Slayer, Dr Nasif Nahle was kind enough to provide the calculations for the total number of ‘absorption/emission’ impacts in this transmission, hence the referenced 20 milliseconds. As the Slayers examined the dynamics of the absorption/emission process it was noted that there is a shift during this process to a longer wavelength and lower frequency energy transmission.
This shift moves the photon out of the CO2 spectrum range, making it ‘invisible’ to CO2 molecules higher up in the air column. This greatly reduced the number of OLR impacts and the transit time. The revised length of time that OLR is delayed by Carbon Dioxide in now less than 5 milliseconds, as explained in “Mean Free Path Length Photons” available here [3].
The next refinement of the Earth fission factor was my article ”Earth’s Missing Geothermal Flux” [4] which describes two previously unrecognized processes where hot ‘elemental’ gases are first converted to liquid and then outgassed in the water column. Both of these processes involve massive amounts of heat exchange.
I will now amend the Missing Flux to add the internal production of Hydrocarbons. As mentioned in ”Fossil Fuel is Nuclear Waste” [5] the Earth produces ‘elemental’ petroleum. This product is molecularly stored energy with nearly a million BTUs per cubic foot. The Earth has 310 million cubic miles of ocean and many millions of cubic miles of stored Hydrocarbon energy from this hidden Geothermal Flux.
The next update to the “Missing Flux” article is courtesy of Geologist Timothy Casey and his article ”Volcanic Carbon Dioxide” [6] which quantifies the massive amounts of ‘natural’ CO2. Casey quotes Hillier & Watts (2007) that there are an estimated 3,470,000 submarine volcanoes worldwide and 4% are considered active.
These volcanoes, along with rift zones release a number of high temperature, high pressure gases which condense. Then, referring to this elemental CO2 Casey say, “under special conditions, it accumulates in submarine lakes of liquid CO2 (Lupton et al 2006; Inagaki et al, 2006)”. We are discovering more of Earth’s secrets everyday and much of what we now know was unknown when the IPCC teams started carving hockey sticks.
Human beings deserve to live in the world we create. But we do not deserve to be ignorant slaves in the diminished world of elitist controls. We will overcome the Climatologist blight on science and the elitist blight on reality. Some of the actors in this episode might just now be realizing that they have been played. My message to all is, wake up and step from beneath this green shadow into Le Claire Nouveau.
May 25, 2011
Global Cooling
By Bryan Leyland
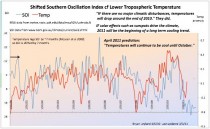
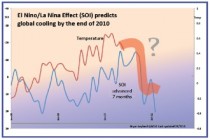
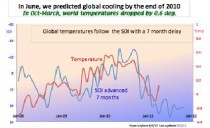
In a peer reviewed paper entitled “Influence of the Southern Oscillation on Tropospheric Temperature” published in 2009, Maclean, de Freitas and Carter established that global temperatures followed the Southern Oscillation Index (SOI) with a lag of between six and eight months. Obviously, this meant that global temperatures could be predicted about seven months ahead.*
What is remarkable about this is that a retired engineer with access to the Internet has been able to make accurate predictions of future climate. Yet, to my knowledge, no computer-based climate model nor any mainstream “climate scientist” predicted this cooling. To me, this is truly remarkable.
Charts showing the the current and the original predictions are given below.
Enlarged.
In June 2010, I published a graph predicting that temperatures will fall sharply around October 2010. Exactly this happened. Since then I have regularly updated the graphs and predictions. As the Southern oscillation index is still in the “La Nina” region, the cooling will, almost certainly, last until late in 2011. As a result, 2011 will be a cool-possibly cold–year.
Enlarged.
Enlarged.
* Unpredictable effects such as volcanoes will affect these predictions. In general, volcanoes cause cooling.
The climate charlatans in the Australian government, universities and media have tried to debunk the paper mentioned, because it dared to offer a natural alternative reason for temperature oscillations and, given the dominant El Nino warm PDO phase of the 1979 -1998 period, the trend upwards.
May 24, 2011
Top Tornado Days and Tornado Fatalities
TOP TORNADO DAYS IN US
April 27, 2011 (Ala., Tenn., Ga., Miss., Va.): 315 fatalities
April 3, 1974 ("Super Outbreak"): 307 fatalities
April 11, 1965 ("Palm Sunday Outbreak"): 260 fatalities
March 21, 1952: 202 fatalities
June 8, 1953 (Flint, Mich., etc.): 142 fatalities
May 11, 1953 (Waco, Tex, etc.): 127 fatalities
Feb. 21, 1971: 121 fatalities
May 22, 2011 (Joplin, Mo...Mpls./St. Paul, Minn.): 117 fatalities
May 25, 1955 (Udall, Kan., etc.): 102 fatalities
June 9, 1953 (Worcester, Mass.): 90 fatalities
-----------
TOP 10 DEADLIEST SINGLE TORNADOES
Mar. 18, 1925 (Tri-State Tornado): 695 fatalities
May 6, 1840 (Natchez, Miss.): 317 fatalities
May 27, 1896 (St. Louis, Mo.): 255 fatalities
Apr. 5, 1936 (Tupelo, Miss.): 216 fatalities
Apr. 6, 1936 (Gainesville, Ga.): 203 fatalities
Apr. 9, 1947 (Woodward, Okla.): 181 fatalities
Apr. 24, 1908 (Amite, La., Purvis, Miss.): 143 fatalities
Jun. 12, 1899 (New Richmond, Wisc.): 117 fatalities
May 22, 2011 (Joplin, Mo.): 116 fatalities
Jun. 8, 1953 (Flint, Mich.): 115 fatalities
May 20, 2011
Indirect Solar Forcing of Climate by Galactic Cosmic Rays; Green Energy Failure; Polar Bears Thrive
by Roy W. Spencer, Ph. D.
Evidence that Cosmic Rays Seed Clouds
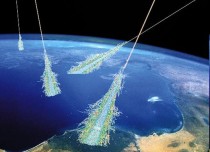
According to a new paper in Geophysical Research Letters, physicists in Denmark and the UK have fired a particle beam into a cloud chamber and shown how cosmic rays could stimulate the formation of water droplets in the Earth’s atmosphere. This is the best experimental evidence yet that the Sun influences climate by altering the intensity of the cosmic-ray flux reaching the Earth’s surface, a hypothesis promoted by Henrik Svensmark.
Roy Spencer, who has been skeptical of Dr. Svensmark’s theory, now accepts that the evidence is becoming too strong for him to ignore. In his blog Dr. Spencer provides supporting graphs and calculations, based on satellite observations, suggesting that direct and indirect (i.e., cosmic ray) solar forcing is 3.5 times that due to changing solar irradiance alone.
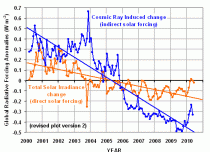
Enlarged.
Read much more here about Roy’s eye-opening analysis that gives credence to Svensmark’s GCR solar effect amplification factor.
--------
Green Energy Failure
By Ross McKitrick, Financial Post
Economist Ross McKitrick applauds the pledge by Ontario PC leader Tim Hudak to roll back key provisions of the Green Energy Act. According to Dr. McKitrick the GEA was proposed as both environmental and job-creation policy, and is a failure on both scores. Any industry that depends on subsidies for its survival is not a net source of jobs.
Countries such as Spain the the UK launched their own versions of the GEA a decade ago, and the resulting job losses have been confirmed by independent analyses (2.2 private sector jobs lost for every green one in Spain and 3.7 for the UK.) Dr. McKitrick points out absurdities in particulate matter calculations for deaths claimed from coal-fired power plants.
Ross concludes:
“If the goal is to reduce air pollution and greenhouse gas emissions, the GEA goes about it in the most costly and ineffective way ever tried -yet another failure. There are cheaper and more effective options that don’t create big cost increases for households and businesses.
Whether the goal is to create jobs or protect the environment, the GEA is a failure, and the provincial Tories should be applauded for taking on the challenge of phasing it out.”
Ross McKitrick is a professor of economics at University of Guelph and senior fellow of the Fraser Institute.
-------
No Decline in Polar Bear Population
Source: CNS

Mother polar bear with cub. (Photo by Scott Schliebe of the U.S. Fish and Wildlife Service)
The Polar Bear Specialist Group of the International Union for the Conservation of Nature (IUCN), the organization of scientists that has attempted to monitor the global polar bear population since the 1960s, has issued a report indicating that there was no change in the overall global polar bear population in the most recent four-year period studied.
“The total number of polar bears is still thought to be between 20,000 and 25,000,” the group said in a press release published together with a report on the proceedings of its 15th meeting. 20,000 to 25,000 polar bears worldwide is exactly the same population estimate the group made following its 14th international meeting. The 15th meeting of the IUCN’s Polar Bear Specialist Group took place from June 29-July 3, 2009 in Copenhagen, Denmark - four years after the 14th meeting, which took place in Seattle, Wash., June 20-24, 2005. But the report on the 15th meeting and its conclusions about the polar bear population - including subsequent information that was developed through March 2010 - was not published until this year (on Feb. 25, 2011).
The group said it viewed anticipated changes in the Arctic environment caused by “climate change” to be the greatest threat to the future of the polar bear.
More likely a threat to continued funding.
In 2008, the U.S. Fish and Wildlife Service declared the polar bear a threatened species under the U.S. Endangered Species Act. The declaration was not based on an actual decline in the polar bear population but on the government’s conclusion that future declines in Arctic sea ice will reduce the bear’s habitat and put it at risk.
May 20, 2011
Another IPCC failure - IPCC’s species extinction hype “fundamentally flawed”
By Anthony Watts, Watts Up With That
Before you read this, I’ll remind WUWT readers of this essay: Where Are The Corpses? Posted on January 4, 2010 by Willis Eschenbach
Which is an excellent primer for understanding the species extinction issue. Willis pointed out that there are a lot of holes in the data collection methods, and that has proven itself this week when this furry little guy (below) announced himself to a couple of volunteer naturalists at a nature reserve in Colombia two weeks ago and was identified as the thought to be extinct red-crested tree rat. It hasn’t been seen in 113 years. Oops.

“extinct” Red-crested tree rat - photo by Lizzie Noble
From the GWPF: IPCC Wrong Again: Species Loss Far Less Severe Than Feared
IPCC report based on “fundamentally flawed” methods that exaggerate the threat of extinction - The pace at which humans are driving animal and plant species toward extinction through habitat destruction is at least twice as slow as previously thought, according to a study released Wednesday.
Earth’s biodiversity continues to dwindle due to deforestation, climate change, over-exploitation and chemical runoff into rivers and oceans, said the study, published in Nature.
“The evidence is in - humans really are causing extreme extinction rates,” said co-author Stephen Hubbell, a professor of ecology and evolutionary biology at the University of California at Los Angeles.
But key measures of species loss in the 2005 UN Millennium Ecosystem Assessment and the 2007 Intergovernmental Panel on Climate Change (IPCC) report are based on “fundamentally flawed” methods that exaggerate the threat of extinction, the researchers said.
The International Union for the Conservation of Nature (IUCN) “Red List” of endangered species - likewise a benchmark for policy makers - is now also subject to review, they said.
“Based on a mathematical proof and empirical data, we show that previous estimates should be divided roughly by 2.5,” Hubbell told journalists by phone.
“This is welcome news in that we have bought a little time for saving species. But it is unwelcome news because we have to redo a whole lot of research that was done incorrectly.”
Up to now, scientists have asserted that species are currently dying out at 100 to 1,000 times the so-called “background rate,” the average pace of extinctions over the history of life on Earth.
UN reports have predicted these rates will accelerate tenfold in the coming centuries.
The new study challenges these estimates. “The method has got to be revised. It is not right,” said Hubbell.
How did science get it wrong for so long?
Because it is difficult to directly measure extinction rates, scientists used an indirect approach called a “species-area relationship.”
This method starts with the number of species found in a given area and then estimates how that number grows as the area expands.
To figure out how many species will remain when the amount of land decreases due to habitat loss, researchers simply reversed the calculations.
But the study, co-authored by Fangliang He of Sun Yat-sen University in Guangzhou, shows that the area required to remove the entire population is always larger - usually much larger - than the area needed to make contact with a species for the first time.
“You can’t just turn it around to calculate how many species should be left when the area is reduced,” said Hubbell.
That, however, is precisely what scientists have done for nearly three decades, giving rise to a glaring discrepancy between what models predicted and what was observed on the ground or in the sea.
Dire forecasts in the early 1980s said that as many as half of species on Earth would disappear by 2000. “Obviously that didn’t happen,” Hubbell said.
But rather than question the methods, scientists developed a concept called “extinction debt” to explain the gap.
Species in decline, according to this logic, are doomed to disappear even if it takes decades or longer for the last individuals to die out.
But extinction debt, it turns out, almost certainly does not exist.
“It is kind of shocking” that no one spotted the error earlier, said Hubbell. “What this shows is that many scientists can be led away from the right answer by thinking about the problem in the wrong way.”
Human encroachment is the main driver of species extinction. Only 20 percent of forests are still in a wild state, and nearly 40 percent of the planet’s ice-free land is now given over to agriculture.
Some three-quarters of all species are thought to live in rain forests, which are disappearing at the rate of about half-a-percent per year.
AFP, 18 May 2011
Species-area relationships always overestimate extinction rates from habitat loss
Fangliang He & Stephen P. Hubbell
Nature473,368-371(19 May 2011)
Extinction from habitat loss is the signature conservation problem of the twenty-first century1. Despite its importance, estimating extinction rates is still highly uncertain because no proven direct methods or reliable data exist for verifying extinctions. The most widely used indirect method is to estimate extinction rates by reversing the species - area accumulation curve, extrapolating backwards to smaller areas to calculate expected species loss. Estimates of extinction rates based on this method are almost always much higher than those actually observed2, 3, 4, 5. This discrepancy gave rise to the concept of an ‘extinction debt’, referring to species ‘committed to extinction’ owing to habitat loss and reduced population size but not yet extinct during a non-equilibrium period6, 7. Here we show that the extinction debt as currently defined is largely a sampling artefact due to an unrecognized difference between the underlying sampling problems when constructing a species–area relationship (SAR) and when extrapolating species extinction from habitat loss. The key mathematical result is that the area required to remove the last individual of a species (extinction) is larger, almost always much larger, than the sample area needed to encounter the first individual of a species, irrespective of species distribution and spatial scale. We illustrate these results with data from a global network of large, mapped forest plots and ranges of passerine bird species in the continental USA; and we show that overestimation can be greater than 160%. Although we conclude that extinctions caused by habitat loss require greater loss of habitat than previously thought, our results must not lead to complacency about extinction due to habitat loss, which is a real and growing threat. See post.
|


