Sep 21, 2009
2009 Arctic Sea Ice Extent exceeds 2005 for this date
By Anthony Watts, Watts Up With That
Those that have been watching the IARC-JAXA Arctic sea ice plot, and noting the slope of gain, rather expected this to happen. Today it did.
Here’s the current IARC-JAXA Sea Ice Extent plot:
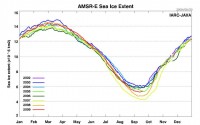
See larger image here.
And here is the plot magnified and annotated to show the crossing:
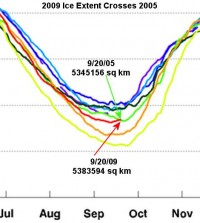
See larger image here.
While 2009 minimum on 09/13 of 5,249,844 was just 65,312 sq km below 2005 in minimum extent, which occurred on 9/22/2005 with 5,315,156 sq km, it has now rebounded quickly and is higher by 38,438 sq km, just 2 days before the 9/22/05 minimum. On 9/22/2009 it may very well be close to 60-80,000 sq km higher than the minimum on the same date in 2005.
While by itself this event isn’t all that significant, it does illustrate the continued rebound for the second year. The fact that we only missed the 2005 minimum by 65,312, which is about one days worth of melt during many days of the melt season is also noteworthy. See more and comments here.
Icecap Note:
We also as of the 20th were running 25.7% greater than 2007.
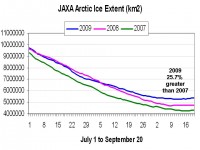
See larger image here.
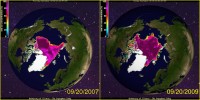
Compare 2007 with 2009 image here.
Sep 21, 2009
UN Plans Green ‘Shock Therapy’ (Read Lying Campaign): Climate Activists to Sway Poor Nations
By Suzanne Goldenberg, US environment correspondent
The United Nations is planning a form of diplomatic shock therapy for world leaders this week in the hope of injecting badly needed urgency into negotiations for a climate change treaty that, it is now widely acknowledged, are dangerously adrift.
UN chief Ban Ki-Moon and negotiators say that unless they can convert world leaders into committed advocates of radical action, it will be very hard to reach a credible and enforceable agreement to avoid the most devastating consequences of climate change.
As the digital counter ticking off the hours to the Copenhagen summit - which had been supposed to seal the deal on climate change - hit 77 days today, progress at the UN summit in New York is seen as vital. Nearly 100 heads of state and government are to attend the summit, for which a pared-down format has been devised.
“We need these leaders to go outside their usual comfort zones,” said one diplomat. “Our sense is that leaders have got a little too cosy and comfortable. They really have to hear from countries that are vulnerable
and suffering.”
Rajendra Pachauri, head of the Intergovernmental Panel on Climate Change, which won the Nobel peace prize with Al Gore, agreed. Commenting on the leaders attending the G20 summit in Pittsburgh next week, he said: “We need to remind these people about impacts of climate change - the fact that they are inequitable and fall very heavily on some of the poorest people in the world. We are likely to see a large number of failed states if we don’t act in time.”
The heads of state attending the UN summit are to be stripped of their entourages. Each will be allowed just one aide, generally their country’s environment minister, in the sessions. Instead of set-piece speeches, leaders will be paired off to chair discussion groups. Britain will be with Guyana, Tuvalu with the
Netherlands, and Mongolia with the European commission.
The leaders will also lunch with environmental activists and chief executives of corporations who have been pressing their governments for action. At dinner, the leaders of the biggest polluting countries will dine with the leaders of Bangladesh, Kiribati and Costa Rica - which are among the primary victims of climate change.
By the end of the day, the rationale goes, the leaders will be imbued with a new sense of purpose. Leaders of rich countries will have been galvanised to take on the big emissions cuts - 25-40% over the next decade, 80% by 2050 - needed to keep temperatures from rising more than two degrees above pre-industrial levels, the temperature set by science to avoid the most calamitous effects of climate change.
The leaders will also, it is hoped, have some understanding of the threat to poorer countries. And, at the very least, they will have more of a common purpose in tackling the problem. “We need to gather together. We don’t want to blame or point fingers at each other,” said Yaqoub al-Sanada, counsellor at the Kuwaiti mission to the UN. Kuwait - one of the biggest producers of oil - will co-chair a discussion session with Finland.
The UN is hoping for help from Barack Obama. The US president will speak at the session, and there is anticipation he will deliver a strong signal that America is committed to action. There is growing anxiety for those kinds of reassurances, especially as opposition to Obama’s green agenda grows in Congress. “The first question I get any time I meet with anybody is, ‘Where’s the legislation? How’s it going?’,” Todd Stern, the State Department’s climate change envoy, said. There are also reports that China’s president, Hu Jintao, in his first appearance at the UN, will announce new commitments to curb pollution - the kind of signal that will be crucial to boost negotiations in the days leading up to Copenhagen.
Read story here. H/T Dr. Benny Peiser, CCNet
Expect to hear “it is far worse than anyone thought”, “the ten warmest years have all occurred in the last dozen years”, “sea level rises are accelerating”, “extreme weather is increasing worldwide”, “oceans are warmest they have ever been”, the “arctic is melting at an alarming rate and will soon be gone”, “Greenland and Antarctic ice is melting rapidly threatening sea level rises”, “more and more species are being endangered by changes to climate”, “heat waves are increasing rapidly and will grow worse in years ahead”, “a future of increasing drought will lead to famines"- each and every one a blatant lie. Read the real story in this attached summary of talking points with hyperlinks.
Sep 17, 2009
NOAA: Warmest Global Sea-Surface Temperatures for August and Summer
By Anthony Watts, Watts Up With That
From the NOAA press release, just in time for Copenhagen. Of course the satellite record for August tells another story that is not quite so alarming as NCDC’s take on it.
AMS Fellow and CCM, Joe D’Aleo of ICECAP has this to say about it:.
Icecap Note: to enable them to make the case the oceans are warming, NOAA chose to remove satellite input into their global ocean estimation and not make any attempt to operationally use Argo data in the process. This resulted in a jump of 0.2C or more and ‘a new ocean warmth record’ in July. ARGO tells us this is another example of NOAA’s inexplicable decision to corrupt data to support political agendas.
- Anthony
NOAA Excerpts:

Global surface temperature anomalies for the month of August 2009. Temperature is compared to the average global temperature from 1961-1990.
Visualization of world’s land and ocean surface temperature.
High resolution (Credit: NOAA)
The world’s ocean surface temperature was the warmest for any August on record, and the warmest on record averaged for any June-August (Northern Hemisphere summer/Southern Hemisphere winter) season according to NOAA’s National Climatic Data Center in Asheville, N.C. The preliminary analysis is based on records dating back to 1880.
NCDC scientists also reported that the combined average global land and ocean surface temperature for August was second warmest on record, behind 1998. For the June-August 2009 season, the combined global land and ocean surface temperature was third warmest on record.
Global Highlights - Summer
The June-August worldwide ocean surface temperature was also the warmest on record at 62.5 degrees F, 1.04 degrees F above the 20th century average of 61.5 degrees F.
The combined global land and ocean average surface temperature for the June-August season was 61.2 degrees F, which is the third warmest on record and 1.06 degrees F above the 20th century average of 60.1 degrees F.
Global Highlights - August
The worldwide ocean surface temperature of 62.4 degrees F was the warmest on record for any August, and 1.03 degrees F above the 20th century average of 61.4 degrees F.
Icecap Note: What can I say. Between the station dropout (80% of the world’s stations, mostly rural), removal in US or absence globally of any UHI adjustment, bad siting for 90% of the climate stations and the recent removal of satellite input into the ocean temperature assessments, NOAA has ensured that each and every month and season will rank and ‘validate’ their piece of excrement called CCSP and support the governments argument for Cap-and-Tax, carbon regulations and global actions at Copenhagen. This is not an indictment of the hard-working and honest rank-and-file NOAA employees at the local offices and even behind the scenes at NCDC. It is the fault of higher ups and managers whose jobs and reputations rely on perpetrating the global warming hoax long enough so the governments can have their way to control virtually every aspect of our lives and keep the funding at the highest possible level for those who have abused the science to their benefit. See also here, here and here.
Sep 15, 2009
Hot Button - Internal Memo Tells Real Story
By Amanda Carpenter, Washington Times
Energy office
Officials at the Treasury Department think cap-and-trade legislation would cost taxpayers hundreds of billion in taxes, according to internal documents circulated within the agency and provided to The Washington Times.
These estimates were made in Treasury memos, obtained by the Competitive Enterprise Institute through a Freedom of Information Act request that sought information related to proposals originated by Treasury involving “cap-and-trade schemes” that deal with “carbon,” “carbon dioxide” or “greenhouse gases.” The memos were given to The Times by CEI.
The House narrowly passed cap-and-trade legislation earlier this year, and now the Senate stands poised to take up its version of the bill at any time, although it has been largely overshadowed by health care reform efforts. The ultimate cost of the bill to taxpayers has been the subject of fierce debate between supporters and opponents of the legislation. CEI, a free-market think tank that opposes the bill, thinks the Treasury documents prove the legislation would pose a significant burden to the economy.
A memo prepared by Judson Jaffe, who works in the Treasury’s Office of Environment and Energy, referenced President Obama’s remarks on energy policy in his State of the Union Address and said, given the president’s plan to auction emissions allowances, “a cap-and-trade program could generate federal receipts on the order of $100 to $200 billion annually.” These figures differ from other cost estimates for the legislation produced more recently by the Environmental Protection Agency and the Department of Energy.
“These are candid, internal discussions of what they are telling each other and what they won’t tell you,” said Christopher C. Horner, a CEI senior fellow who filed the request. “The words cap and trade were chosen for a reason, and that is to avoid a vote on tax,” said Mr. Horner, who also is the author of the New York Times best-seller “The Politically Incorrect Guide to Global Warming.” “This memo tells you it’s a tax. Why else are they discussing hundreds of billions of revenue to be taken from the taxpayer?”
Other cost estimates and “key challenges” laid out in Mr. Jaffe’s memo were redacted. Mr. Horner said he intends to litigate against the department in order to have that material released. The office that issued these memos is relatively new. Former Treasury Secretary Henry M. Paulson Jr. created it in August 2008, during the Bush administration. However, Mr. Horner said Treasury has “no authority” to manage such programs, but created the office “hoping it would come.”
Treasury said, in the memos, it justifiably created the energy office because “as the lead U.S. agency supporting economic prosperity and financial security, Treasury is uniquely positioned to provide the executive branch with informed and credible policy options to address these issues, to implement chosen options in its areas of operational responsibility, and to communicate those choices to Congress, foreign governments, international institutions, as well as stakeholders in the business community and civil society.”
Included in the 10 pages of memos released to Mr. Horner by Treasury were several detailed discussions about how Treasury could properly regulate the carbon market. One unsigned memo titled “carbon market oversight issues” distributed during the transition period between the Bush and the Obama administrations proposed the creation of a “Carbon Fed” to manage carbon allowances in a way similar to the way the Federal Reserve regulates the supply of money. Read more here.
See more here.
Sep 14, 2009
Only in Climate Science Can You Play With a Broken Hockey Stick
By Tim Ball, Canada Free Press
An anonymous adage advises, ‘There is nothing wrong with making mistakes. Just don’t respond with encores.” Break your stick in ice hockey and drop it immediately or a penalty is assessed because continued use can cause serious damage (Rule 10.3). Apparently this rule doesn’t apply in climate science where a few scientists continue to use a broken “hockey stick” and cause serious damage. Facts proving humans are not causing global warming are not enough to stop the political juggernaut. Perhaps exposure of collusion among a small group of self-proclaimed climate scientists who continue to play with a broken stick will stop the madness forcing destructive economic policies.
What Was The Climate Hockey Stick?
It was warmer 1000 years ago than in the late 20th century. Existence of this Medieval Warm Period (MWP) contradicted the claim that post-industrial human CO2 was causing unprecedented warming. As Thomas Huxley said, “The great tragedy of science - the slaying of a beautiful hypothesis by an ugly fact.” Solution? Eliminate the fact. Professor Deming reported receiving an email that said, “We have to get rid of the Medieval Warm Period.” Deming didn’t name the sender, but we now know it was Jonathan Overpeck, a lead author of Intergovernmental Panel on Climate Change (IPCC) Reports.
Mann, Bradley and Hughes tried to achieve Overpeck’s objective with a 1998 (MBH98) “peer reviewed” paper including the “hockey stick” graph. The graph dominated the 2001 IPCC Report especially the Summary for Policymakers (SPM) - the part the media cover. Steve McIntyre and Ross McKitrick (MM) used the standard technique of reproducible results to expose the serious flaws in the research. As Bishop Hill explained, “He (McIntyre) was able to demonstrate that the way they had extracted the temperature signal from the tree ring records was biased so as to choose hockey-stick shaped graphs in preference to other shapes. He also showed that the appearance of the graph was due solely to the use of an estimate of historic temperatures based on tree rings from bristlecone pines, a species that was known to be problematic for this kind of reconstruction."(Source)
Figure 1 shows the MBH98 graph (red line) against MM’s graph (blue line) with my superimposition of a hockey stick.
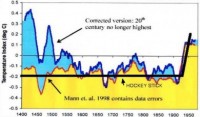
Figure 1: Return of the MWP. Source: After McIntyre and McKitrick modified by Ball
Some attempted to defend the hockey stick. Two researchers, Caspar Amman and Eugene Whelan, claimed confirmation of MBH98 in two papers, through the unusual tactic of a press release, as Hill explained. More problematic was their connection with Mann identified in the Wegman Report.
Wegman: Independent Proof of the Broken Stick and More
Chairman of the US House Committee on Energy and Commerce and Chairman of the Subcommittee of Oversight and Investigations were interested in determining the validity of McIntyre’s claims. An independent committee chaired by Professor Edward J. Wegman of George Mason University found in favor of McIntyre. “In general, we found MBH98 and MBH99 to be somewhat obscure and incomplete and the criticisms of MM03/05a/05b to be valid and compelling.” and, “Overall, our committee believes that Mann’s assessments that the decade of the 1990s was the hottest decade of the millennium and that 1998 was the hottest year of the millennium cannot be supported by his analysis.” This leaves no doubt about the science; however, Wegman identified a larger problem about control of climate science. “In our further exploration of the social network of authorships in temperature reconstruction, we found that at least 43 authors have direct ties to Dr. Mann by virtue of coauthored papers with him.” Wegman confirmed my suspicion that excessive focus on “peer review” studies was because a group had control of the process. “One of the interesting questions associated with the ‘hockey stick controversy’ are the relationships among the authors and consequently how confident one can be in the peer review process. In particular, if there is a tight relationship among the authors and there are not a large number of individuals engaged in a particular topic area, then one may suspect that the peer review process does not fully vet papers before they are published.” The fact MBH98, was peer reviewed is partial proof. Continued publication of peer-reviewed papers using hockey stick methodology suggests the peer review process is being circumvented.
Wegman identified those at the core of the group; “However, it is immediately clear that the Mann, Rutherford, Jones, Osborn, Briffa, Bradley and Hughes form a clique, each interacting with all of the others. A clique is a fully connected subgraph, meaning everyone in the clique interacts with every one else in the clique.” In comprehensive charts he identified all the scientists involved, including Amman and Wahl. Wegman wrote, “We were especially struck by Dr. Mann’s insistence that the code he developed was his intellectual property and that he could legally hold it personally without disclosing it to peers.” Both Mann and Jones have refused to disclose how their results were obtained. (Source)
Many of those named are involved in the IPCC Reports prompting Wegman to write of the dangers. “Especially when massive amounts of public monies and human lives are at stake, academic work should have a more intense level of scrutiny and review. It is especially the case that authors of policy-related documents like the IPCC report, Climate Change 2001: The Scientific Basis, should not be the same people as those that constructed the academic papers.” The influential part of IPCC Reports, the Summary for Policymakers (SPM), is replete with broad unsubstantiated statements. It receives all the media attention. Wegman writes, “Making conclusive statements without specific findings with regard to atmospheric forcings suggests a lack of scientific rigor and possibly an agenda.” For this group of climate scientists the agenda is likely either career promotion, a political objective, or both. It isn’t science because they keep repeating their mistakes.
They’re Still Playing With a Broken Stick
One broken hockey stick is a mistake; repetition is an agenda. The hockey stick returned in the 2007 Fourth IPCC Report. McIntyre notes, “I wasn’t sure that the Hockey Team would even make the SPM (Summary for Policymakers) this time, but here they are in the 2nd paragraph. The Team stayed in the spotlight.” It didn’t appear as a graph in the SPM, but Chapter 6 (lead co-author Jonathan Overpeck) had a modified hockey stick graph and Mann’s discredited work is in the bibliography. Wegman anticipated this denial, “Generally speaking, the paleoclimatology community has not recognized the validity of the MM05 papers and has tended (to) dismiss their results as being developed by biased amateurs.” They lowered the profile, but continued to use the discredited method.
The most recent example appeared in a September, 2009 issue of Science under the title, ”Recent Warming Reverses Long-Term Arctic Cooling.” The article claims arctic temperatures are the warmest they’ve been in 2000 years. Lead author is D.S. Kaufman, secondary authors include other familiar “hockey stick” names: David P. Schneider, Nicholas P. McKay, Caspar M. Ammann, Raymond S. Bradley, Keith R. Briffa, Gifford H. Miller, Bette L. Otto-Bliesner, Jonathan T. Overpeck, and Bo M. Vinther,
Shortly after publication McIntyre identified the Mann methodologies. “The most cursory examination of Kaufman et al shows the usual problem of picking proxies ex post: McIntyre explains “ex post” as follows, The Team selects series that go up in the 20th century and discards (sic) ones that don’t. This sort of ex-post correlation picking generates HS’s from random data,”. (Climateaudit.org)
McIntyre is restrained in his comments, a style he has maintained throughout these exposures. It’s reasonable for one incident because it may be a mistake, but repetition makes it unreasonable because it compounds the errors and has deeper implications. Repetition in the media confers truth, it doesn’t in science, but it does underline the political nature of the activities.
But inconvenient facts keep appearing. For example, real data destroys the claim of a hockey stick in 20th century Arctic temperatures. The questions, “What sudden recent warming?” and “What Hockey Stick?” accompany Figure 2.
How Has This Happened?
Boston College Professor Philip Altbach provides one reason why they’ve succeeded.”Corruption in higher education is not a topic much discussed in academic circles. Academic institutions see themselves as somehow above the baser motivations and lower instincts of other elements of society. And society generally believes that universities are somehow special institutions imbued with the virtues of integrity.”
Concern about this in the UK led to the “UK Panel for Research Integrity”. The objective: “A new watchdog to promote research integrity was launched this week with a scathing attack on the “good chaps” network and general complacency in universities that has allowed fraud and misconduct to gain a foothold in the UK academic sector.” (Source).
Playing with a broken ice hockey stick is a minor penalty. A lifetime ban is required when scientists play repeatedly with broken research hockey sticks, especially when they drive unnecessary, devastating economic and energy policies and provide false academic justifications for politicians. “Fool me once, shame on you; fool me twice, shame on me” is an anonymous but pungent truism. Read full story and see more here.
|


