

Joseph D’Aleo, CCM
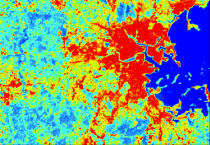
Boston, Massachusetts Heat island
UPDATE: Jim Steele has posted this analysis on Watts Up With That that supports the notion that urbanization/bad siting/land use is responsible for much of the warming the last century significant cooling of the early century has elevated the apparent warming of recent decades.
The EPA admits to the Urban Heat island and suggests it will augment AGW by increasing the warmth in the cities. They never imagine that maybe man made warming is mostly UHI/bad siting, land use changes. Here is what the EPA says about UHI:
Heat island refers to urban air and surface temperatures that are higher than nearby rural areas. Many cities and suburbs have air temperatures that are 2 to 10 Fahrenheit (1 to 6 Celsius) warmer than the surrounding natural land cover.
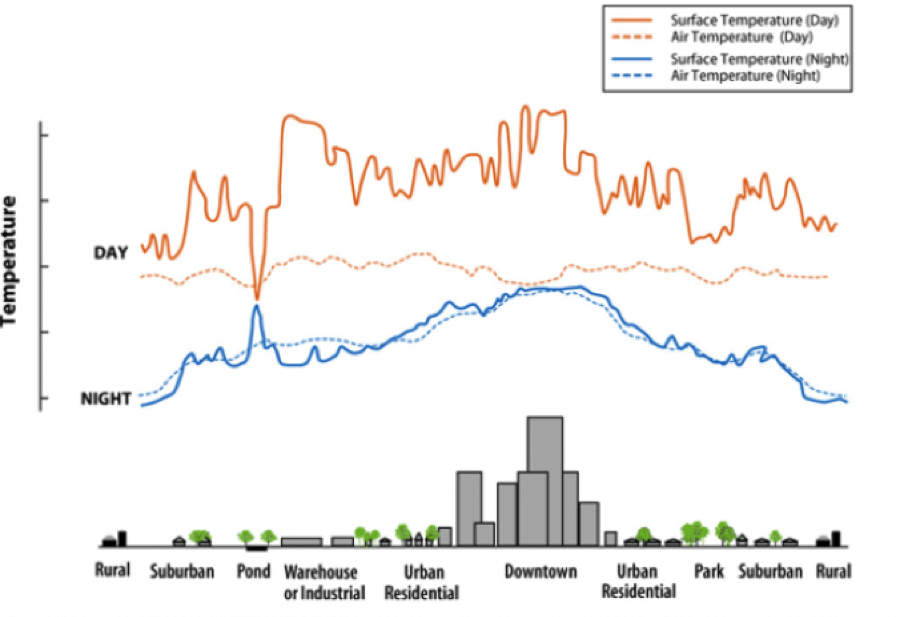
Figure 1 shows a city’s heat island profile. It demonstrates how urban temperatures are typically lower at the urban-rural border than in dense downtown areas. The graphic also show how parks, open land, and bodies of water can create cooler areas].
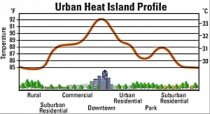
Figure 1. Heat island profile. (Source: U.S. EPA) Enlarged
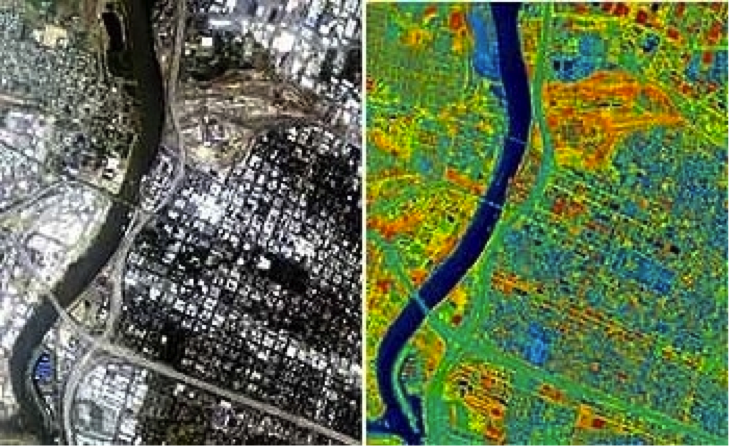
The remotely sensed image of Sacramento, California in Figure 2 illustrates the heat island phenomenon. In the aerial photo (left), the white areas, mostly rooftops, are about 140 degrees Fahrenheit (60 degrees Celsius) and the dark areas, primarily vegetative areas or water, are approximately 85-96 degrees Fahrenheit (29-36 degrees Celsius).
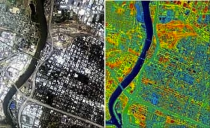
Figure 2. Thermally-sensed image of Sacramento. (Source: U.S EPA) Enlarged
The hottest spots are the buildings, seen as white rectangles of various sizes. In the thermal image (right), Sacramento’s rail yard is the orange area east of the Sacramento River, which flows from top to bottom. Red and yellow areas indicate hot spots and generally correspond with urban development, while blue and green areas are cool and generally correspond to the natural environment.
Cities in cold climates may actually benefit from the wintertime warming effect of heat islands. Warmer temperatures can reduce heating energy needs and may help melt ice and snow on roads. In the summertime, however, the same city may experience the negative effects of heat islands.
Causes of heat islands
The reason the city is warmer than the country comes down to a difference between the energy gains and losses of each region. There are a number of factors that contribute to the relative warmth of cities:

Figure 3. Urban ‘canyons’ contribute to heat islands. (Source: PD Photo.org)
During the day in rural areas, the sunlight absorbed near the ground evaporates water from the vegetation and soil. Thus, while there is a net solar energy gain, this is compensated to some degree by evaporative cooling. In cities, where there is less vegetation, the buildings, streets and sidewalks absorb the majority of solar energy input.
Because the city has less water, runoff is greater in the cities because the pavements are largely nonporous (except by the pot holes). Thus, evaporative cooling is less, which contributes to the higher air temperatures.
Waste heat from city buildings, cars and trains is another factor contributing to the warm cities. Heat generated by these objects eventually makes its way into the atmosphere. This heat contribution can be as much as one-third of that received from solar energy.
The thermal properties of buildings add heat to the air by conduction. Tar, asphalt, brick and concrete are better conductors of heat than the vegetation of the rural area.
The canyon structure that tall buildings create enhances the warming. During the day, solar energy is trapped by multiple reflections off the buildings while the infrared heat losses are reduced by absorption.
The urban heat island effects can also be reduced by weather phenomena. The temperature difference between the city and surrounding areas is also a function of the synoptic scale winds. Strong winds reduce the temperature contrast by mixing together the city and rural air.
The urban heat island may also increase cloudiness and precipitation in the city, as a thermal circulation sets up between the city and surrounding region.
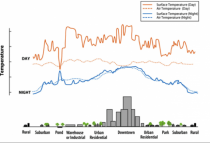
Heat islands can occur year-round during the day or night. Urban-rural temperature differences are often largest during calm, clear evenings. This is because rural areas cool off faster at night than cities, which retain much of the heat stored in roads, buildings, and other structures. As a result, the largest urban-rural temperature difference, or maximum heat island effect, is often three to five hours after sunset.
NOTE: See how the high temperatures are more uniform city and rural while nighttime readings are very different with the cities retaining heat.
-------------
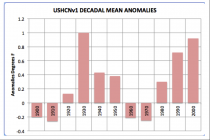
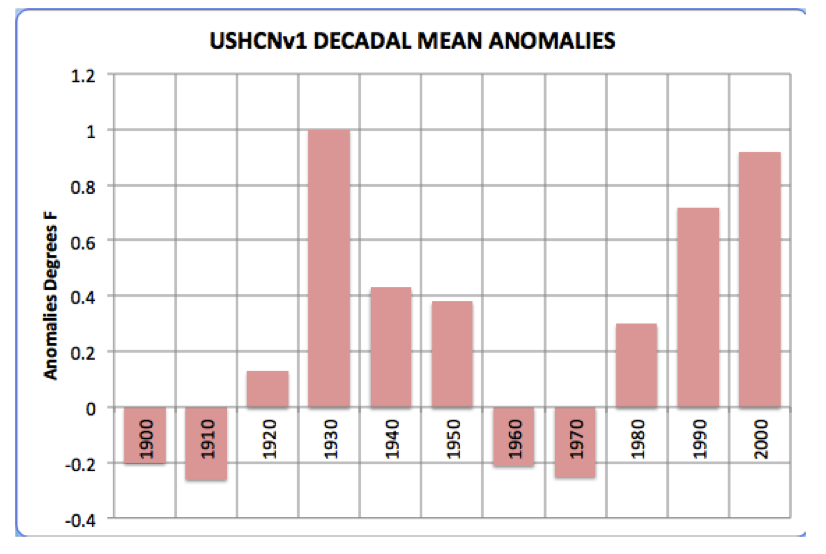
The old USHCN data set up to 2007 had a UHI adjustment. It showed the 1930s dominated.
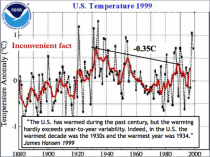
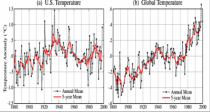
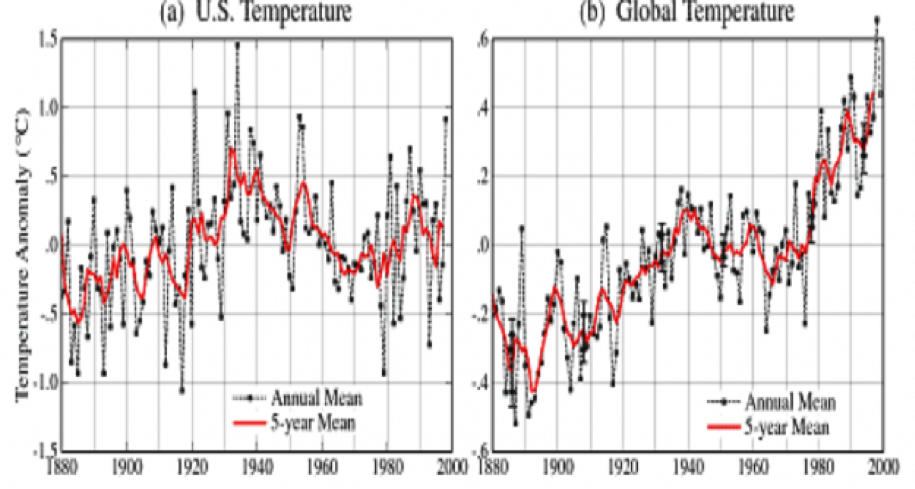
The data was at odds with the global temperature curve which had no UHI adjustment.
Enlarged
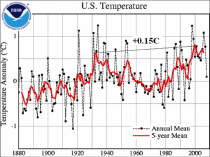
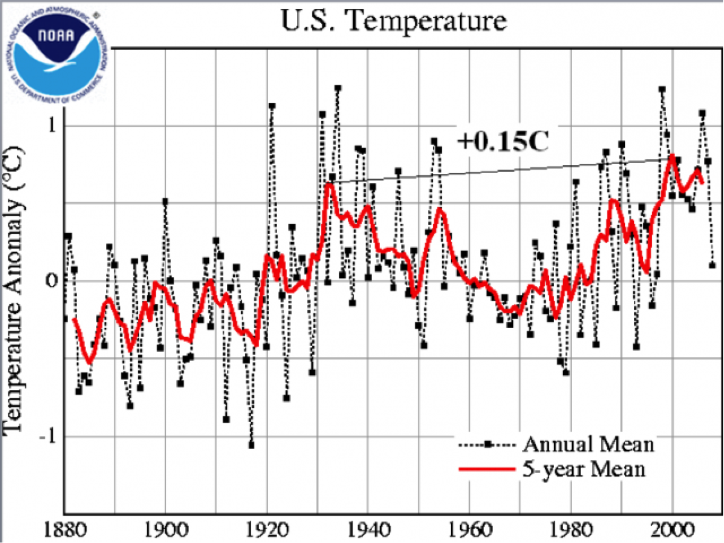
In response, NOAA removed the UHI replacing it with algorithms that are supposed to detect previously undocumented site changes and by homogenization. This is what resulted - much more in line with the global.
Here is the difference between the original and new politically driven version (courtesy Real Science).
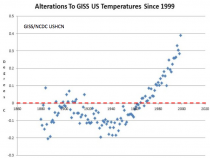
If we had continued with USHCN version 1, the 2000s would be the second warmest decade behind the 1930s.
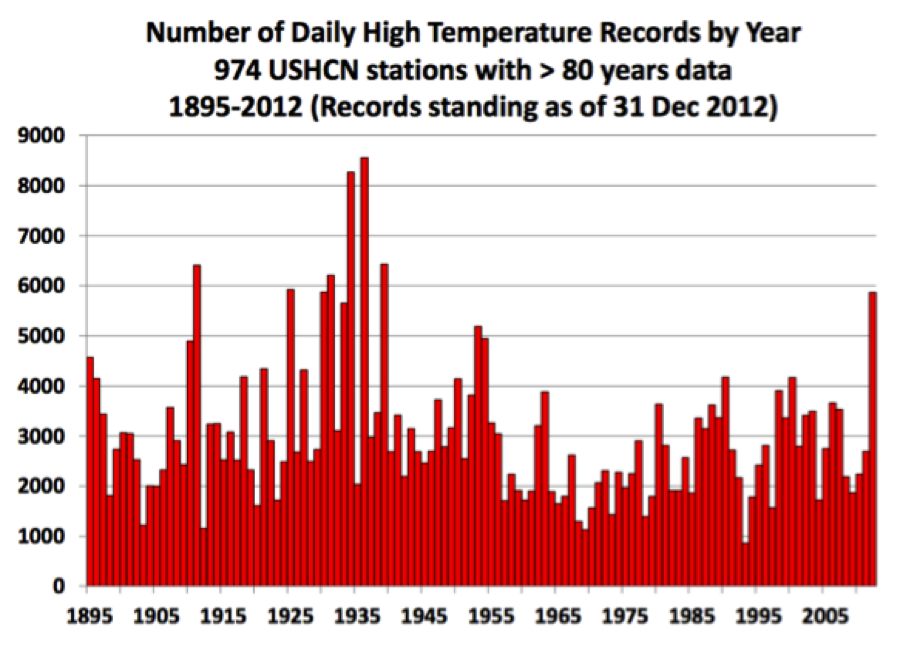
The dominance of the 1930s certainly shows up in the record highs.
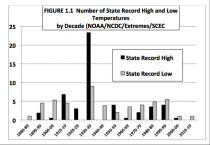
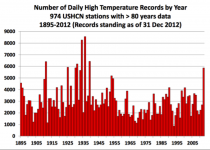
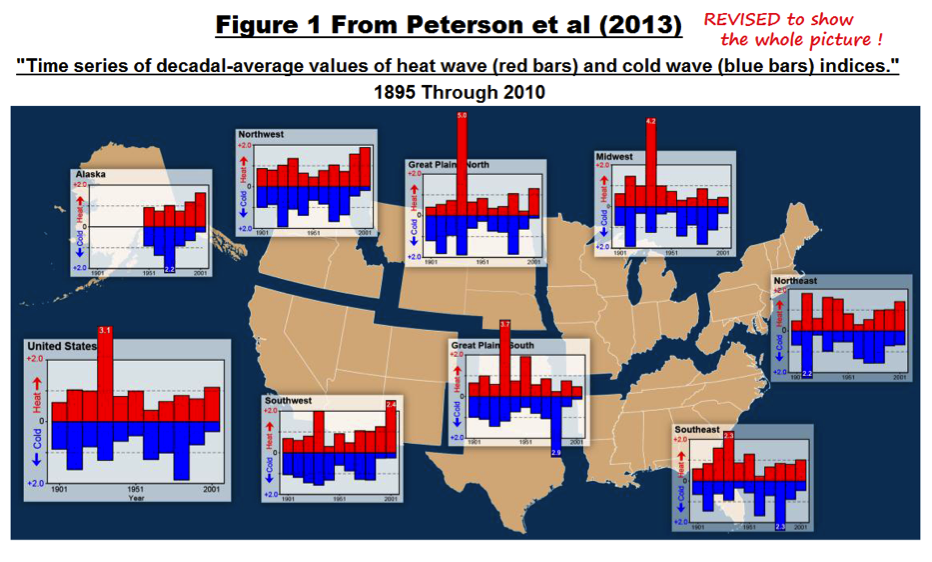
In fact an NCDC paper by Peterson et al of NCDC recently published agreed. The graph is more properly scaled by Dr Richard Keen showing relative magnitude better.
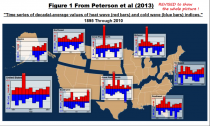
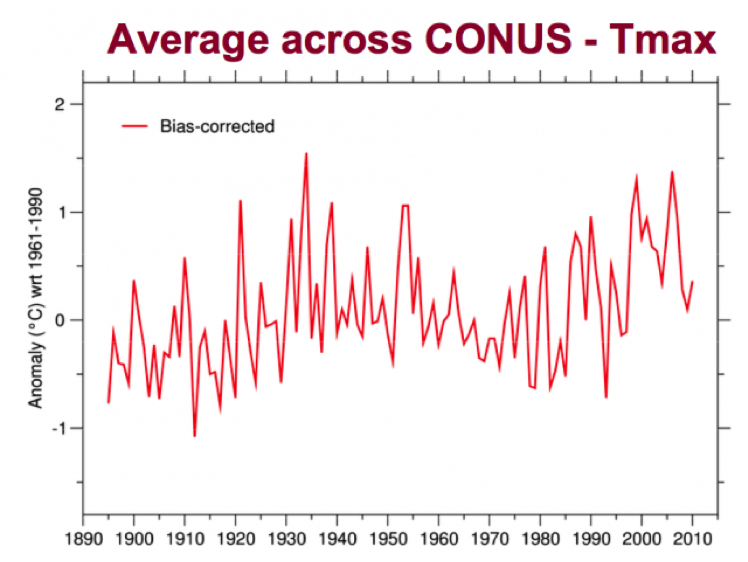
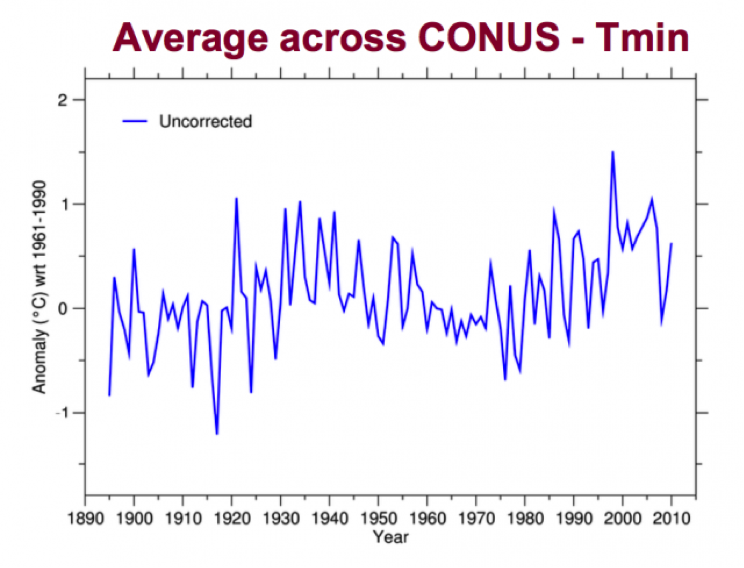
NOAA NCDC presentation showing that as the EPA noted, most of the changes are in the nighttime readings where the cities hold onto the daytime heat. During the day, rural and urban areas come much more in line. The trend in the Tmax according to NOAA is weak with the PDO/AMO/TSI 60-70 year cycle remaining.
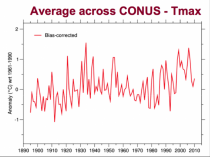
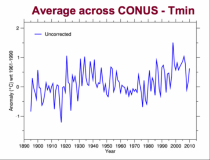
The warming is mostly in the T min.
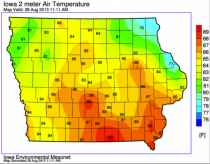
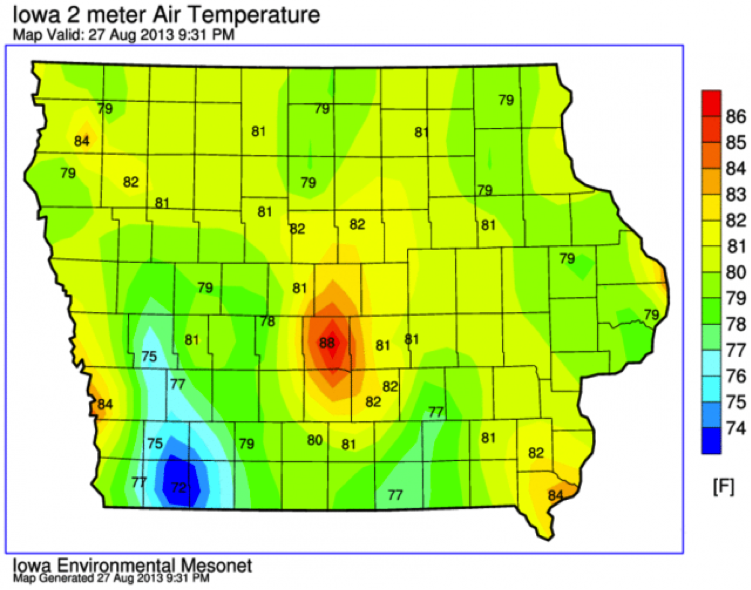
Want an extreme example of UHI - take Des Moines, IA where the official station at the airport in between two runways inside the urban areas and is always warmer than the surroundings even stations within but nearer the edge of the metro area. At 9:31pm Tuesday, August 27, 2013. it was still 88F in DSM although it was as cool as 72F in surrounding stations.

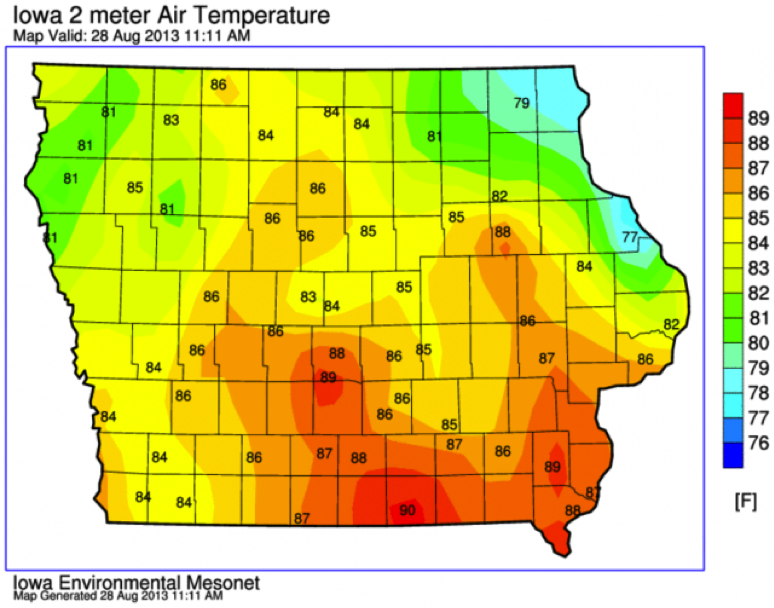
By late morning in the 28th, the differences are much smaller, 1 to 3F.
The real climate signal is in the well sited stations in rural areas. Instead of using these stations to adjust down the urban heat contaminated stations like DSM, the process of homogenization spreads the warmth to the good stations. See Dr Ed Long, formerly of NASA’s analysis that demonstrates this hereOn the Tmax issue, Dick McNider has been really advocating using Tmax in lieu of using Tmim or, therefore, Tmean. See most recently
McNider, R.T., G.J. Steeneveld, B. Holtslag, R. Pielke Sr, S. Mackaro, A. Pour Biazar, J.T. Walters, U.S. Nair, and J.R. Christy, 2012: Response and sensitivity of the nocturnal boundary layer over land to added longwave radiative forcing. J. Geophys. Res., 117, D14106, doi:10.1029/2012JD017578. Copyright (2012) American Geophysical Union.
but also
Klotzbach, P.J., R.A. Pielke Sr., R.A. Pielke Jr., J.R. Christy, and R.T. McNider, 2009: An alternative explanation for differential temperature trends at the surface and in the lower troposphere. J. Geophys. Res., 114, D21102, doi:10.1029/2009JD011841
Klotzbach, P.J., R.A. Pielke Sr., R.A. Pielke Jr., J.R. Christy, and R.T. McNider, 2010: Correction to: ”An alternative explanation for differential temperature trends at the surface and in the lower troposphere. J. Geophys. Res., 114, D21102, doi:10.1029/2009JD011841”, J. Geophys. Res., 115, D1, doi:10.1029/2009JD013655.
I believe that UHI and land use change are a major component of the observed warming trend. Multidecadal cycles in the sun and oceans account for most all of the rest.
BTW, go here and see how Central Park NYC shows what a mess the UHI and versioning by NOAA of data has been and then follow it through the GISS window into station data to convince you there is no way jose we could hope to estimate global changes to a precision of 0.1 F. In the words of John von Neumann, father of the computer and of algorithms, “There’s no sense in being precise when you don’t even know what you’re talking about.”