Jun 06, 2015
India Monsoon Predictably Slow Onset due to El Nino and cool, wet spring
Joseph D’Aleo, CCM
UPDATE:
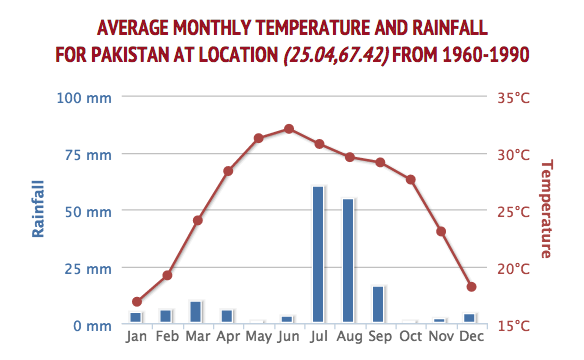
The monsoon rains came hard though as predicted delayed to western India. Meanwhile to the west in Pakistan the seasonal pre monsoonal heat was the news story. Power outages in the poorer areas caused deaths. Notice in the CNN story, the heat wave comes at a time when this predominantly Muslim country’s citizens are observing Ramadan. During the holy month, the faithful fast from sunup until sundown.
This means that, amidst these scorching temperatures, Pakistanis are forgoing food and water. Clerics are reminding residents that they can forego fasting if they feel the soaring temperatures are life-threatening.
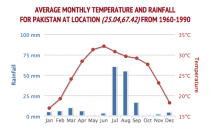
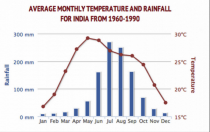
The Ramadan holydays float during the years. It is untimely when it comes during the seasonal pre-monsoonal heat. See how temperatures peak in Pakistan as in India before the rains come.
Enlarged
-----------
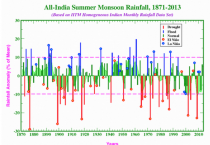
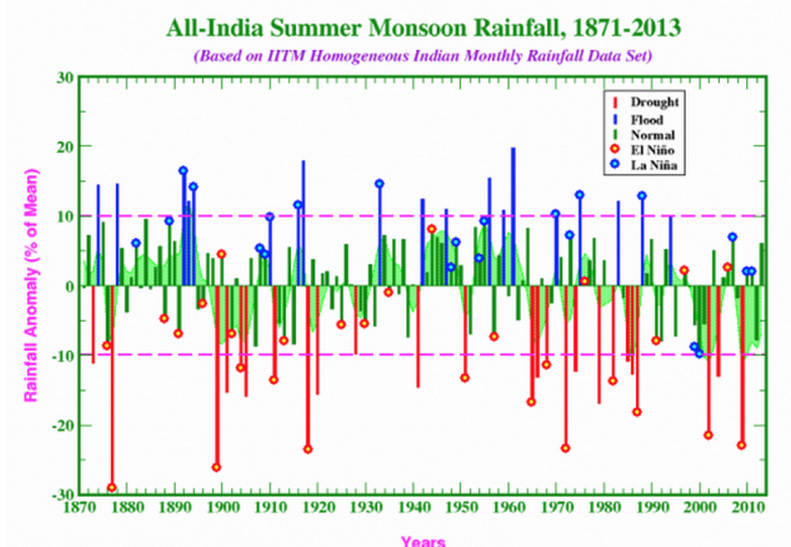
El Ninos historically have been associated with erratic and less productive monsoon rains in India, Indonesia and often parts of Australia. The red circles represent El Nino years Most were below normal to normal for precipitation. La Ninas are normally wet (blue circles).
Enlarged
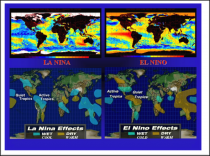
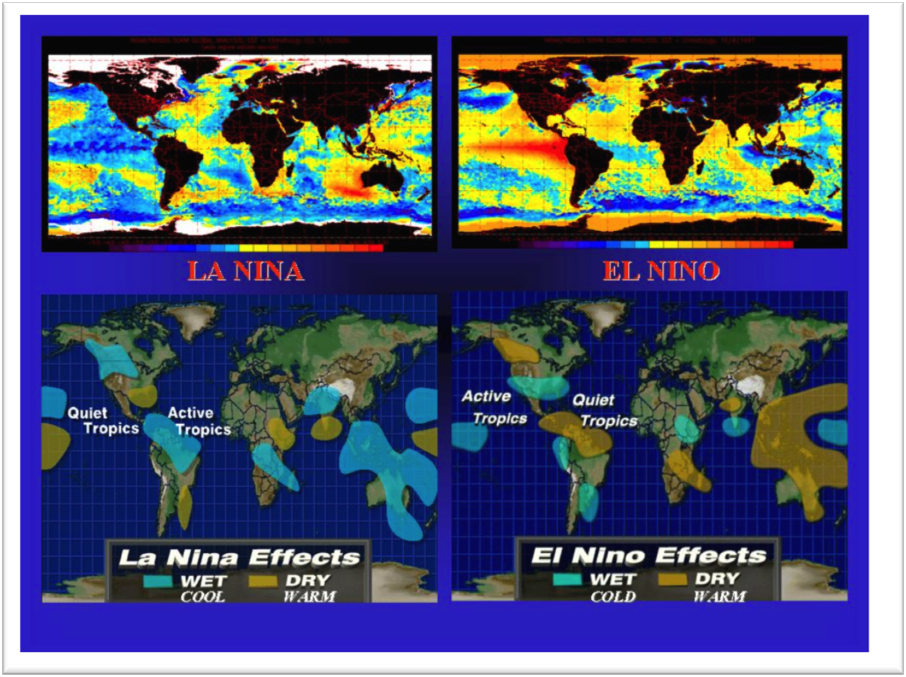
See the temperature and precipitation patterns associated with El Nino and La Nina. We know there are different flavors of El Nino related to strength and where in the Tropics, waters are warmest.
Enlarged
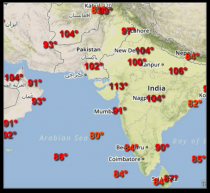
The media has promoted the pre monsoonal heat as unprecedented and surely the result of global climate change.
Enlarged
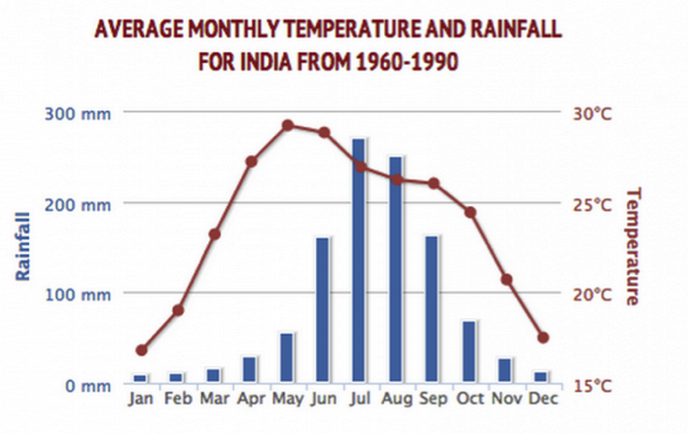
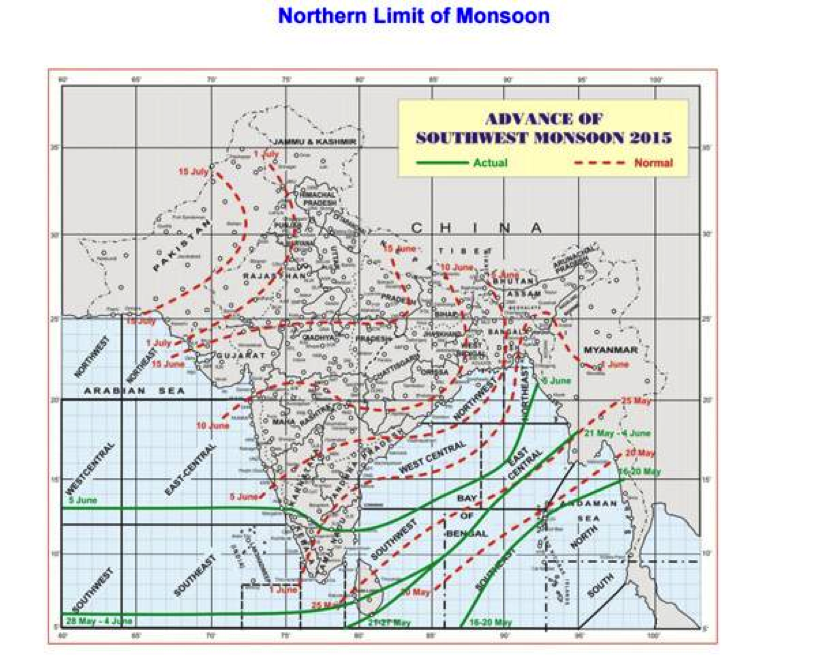
Normally the heat peaks in the spring which helps draw in monsoon moisture when the jet stream lifts north of the Himalayas, starting by early June.
Enlarged
The monsoon is 5 days late into the south in Kerala and is proceeding north. The normal monsoon front is shown in the red dashed line. The green is actual as of June 5th.

Enlarged

Enlarged
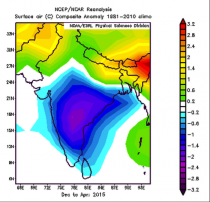
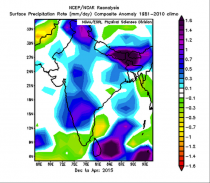
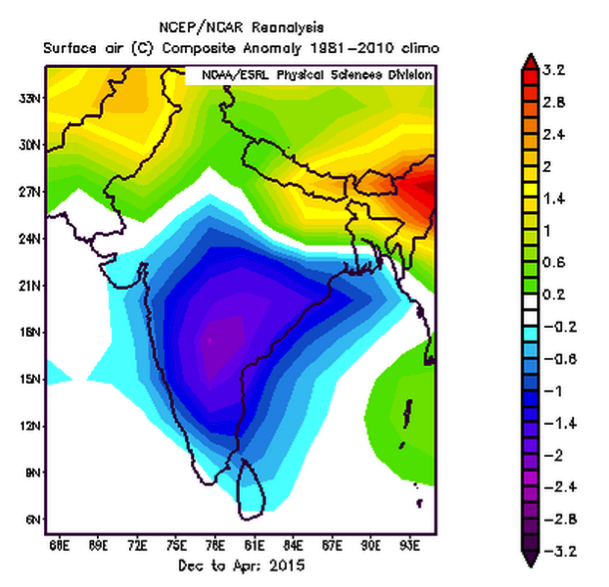
Temperatures in India were well below normal this winter and most of spring and it was unusually wet. This is the departure from normal for December through April.
Enlarged
Enlarged
The cooler April and early May combined with El Nino to favor a delayed and likely erratic monsoon year. The heat that appears in April and May usually helps draw in moisture from the Indian Ocean when the jet stream lifts north of the Himalayas. We have been telling our clients that for months.
The heat came on late and the rains have followed suit.

Enlarged
Is that heat and monsoon disruption new - hell no - Sir Gilbert Walker went to India in 1904 to try and find out why the monsoon failed in some years (like 1899) and he found the Southern Oscillation ( SOI - a pressure flip flop Darwin to Tahiti) that much later (1960s by Rossby) was connected with the ocean temperatures in El Nino Southern Oscillation (ENSO). 113.7F is not at all unprecedented. When you delay the monsoon and have the heat come late closer to the maximum solar (when the sun is overhead over India), it gets hotter than normal in June.
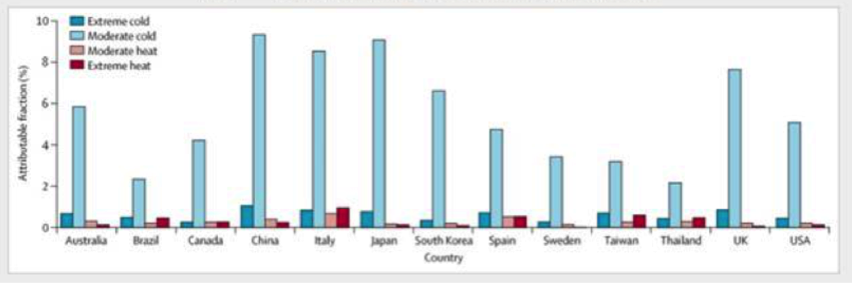
The media was all abuzz about the 3000 plus heat deaths from the late May early June heat in India. A recent Lancet article showed 20x more people die in winter cold than summer heat. We would bet that 20-30,000 people died this winter in India from the cold.

Enlarged
WHAT’S AHEAD
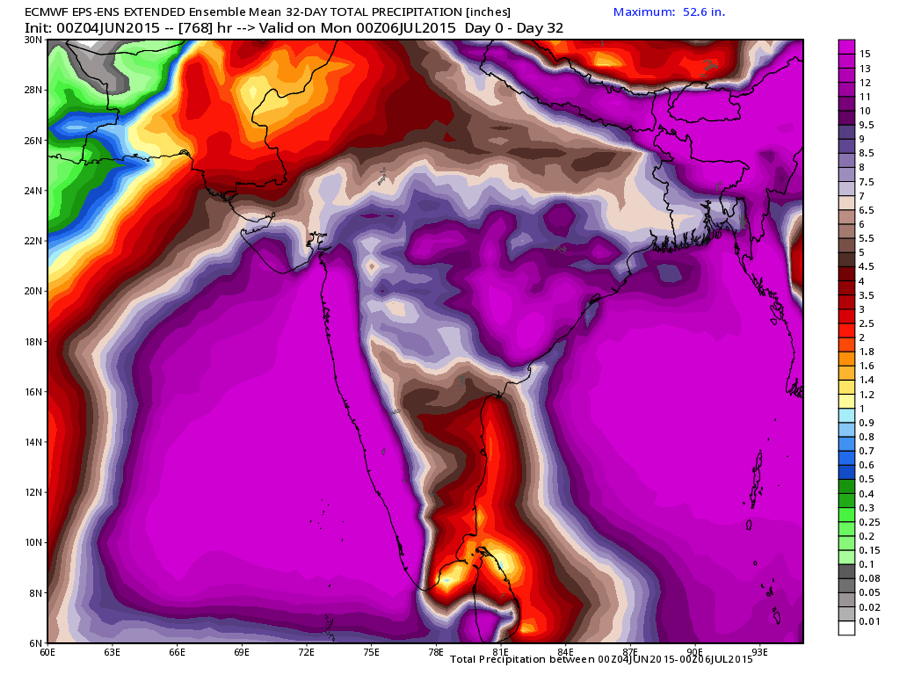
The European 30 day mean forecast is for wetter and cooler weather to return. Expect to hear about the localized flooding that will occur and yes how it is unprecedented (it’s not).

Enlarged

Enlarged
A tropical storm is developing in the Arabian Sea west of India. It is forecast to move north northwest. it should pump some moisture into the hot west central although the models suggest the heaviest rains are west of the western Ghats mountains.
_thumb.jpg)
Enlarged
Jun 02, 2015
Climate change: Mr. Obama, 97 percent of experts is a bogus number
By Richard Tol, IPCC Lead Author
Ninety-seven percent of scientists agree: Climate change is real, man-made and dangerous. President Obama tweeted that, and it has been repeated by countless others. It is tempting for a politician to claim that 97 percent of experts agree with you. But do they?
The 97 percent claim was taken from a study paper by Australian John Cook, Climate Communications Fellow for the Global change Institute at the University of Queensland, and his colleagues, published in the journal Environmental Research Letters in May, 2013. The paper says nothing about the would-be dangers of climate change and it counts the number of publications, rather than the number of scientists, in support of human-made climate change. Never let facts get in the way of a good story.
The paper is a treasure trove of how-not-to lessons for a graduate class on survey design and analysis: the sample was not representative, statistical tests were ignored, and the results were misinterpreted.
What was an incompetent piece of research has become a highly influential study, its many errors covered up.
Some of the mistakes in the study should be obvious to all. There are hundreds of papers on the causes of climate change, and thousands of papers on the impacts of climate change and climate policy. Cook focused on the latter. A paper on the impact of a carbon tax on emissions was taken as evidence that the world is warming. A paper on the impact of climate change on the Red Panda was taken as evidence that humans caused this warming. And even a paper on the television coverage of climate change was seen by Cook as proof that carbon dioxide is to blame.
Cook and Co. analysed somewhere between 11,944 and 12,876 papers - they can’t get their story straight on the sample size - but only 64 of these explicitly state that humans are the primary cause of recent global warming. A reexamination of their data brought that number down to 41. That is half a per cent or less of the total, rather than 97 percent.
The remainder of Cook’s “evidence” is papers that said that humans caused some climate change and, more importantly, papers that Cook’s colleagues thought said as much.
There is vigorous debate about how much humans have contributed to climate change, but no one argues the effect is zero. By emitting greenhouse gases, changing the landscape, rerouting rivers, and huddling together in cities, we change the climate - perhaps by a little, perhaps by a lot - but not one expert doubts we do. However, a true consensus - 100 per cent agreement - does not serve to demonize those experts who raise credible concerns with the state of climate research.
The trouble does not end there. Cook has been reluctant to share his data for others to scrutinize. He has claimed that some data are protected by confidentiality agreements, even when they are not. He was claimed that some data were not collected, even when they were. The paper claims that each abstract was read by two independent readers, but they freely compared notes. Cook and Co. collected data, inspected the results, collected more data, inspected the results again, changed their data classification, collected yet more data, inspected the results once more, and changed their data classification again, before they found their magic 97 percent. People who express concern about the method have been smeared.
We would hope that the president of the United States of America does not spend time checking such trivia. That is the job of the editor of the journal, Dan Kammen of the University of California at Berkeley, who unfortunately has chosen to ignore all issues I and others raised about them. Similarly, the journal’s publisher, the Institute of Physics, and Cook’s employer, the University of Queensland, have turned a deaf ear to my concerns. What was an incompetent piece of research has become a highly influential study, its many errors covered up.
And for what? If Cook’s results are to be believed, 97 percent of experts agree that climate change is real and largely human-made. This does not tell us anything about the risks of climate change, let alone how these compare to the risks of climate policy.
That is a difficult trade-off, and it should be informed by the best possible science rather than dodgy work like Cook’s.
Richard Tol is a professor of economics at the University of Sussex and the Vrije Universiteit Amsterdam. He has been involved in the IPCC since 1994.
May 14, 2015
What Does “Sustainability” Really Mean?
Dr. William M Briggs
The Pontifical Academy for Science’s summary of their recent conference on sustainability, itself anticipating our Holy Father’s (supposed) environmental encyclical, is suffused with scientific inaccuracies, some small, others large. But these are forgivable, considering the hearts of its authors are in the right place; and perhaps the theology of the document is sound.
The PAS said, “Unsustainable consumption coupled with a record human population and the uses of inappropriate technologies are causally linked with the destruction of the world’s sustainability and resilience.” What is “sustainability”?
If a resource is limited, in the sense of it being finite and non-renewable, then any use of it whatsoever diminishes its stock and makes that part of it unavailable to others. Thus any use of a truly non-renewable resource is by definition unsustainable. With one proviso, if used at any rate greater than zero, it must eventually be depleted.
Now non-renewable means that which cannot be renewed. All resources on this planet are finite, because the earth is finite, and so everything is unsustainable given sufficient time. “For the sword outwears its sheath...” But some resources are finitely renewable in the sense that the resource can be used repeatedly, like aluminum in cans. And other resources are plainly non-renewable, such as coal and crude oil. Once they are used up, they are gone forevermore.
The Effect Of People
Enter the proviso. Any use of a non-renewable is unsustainable if the number of expected future people exceeds the per-person consumption rate. Suppose on average each person uses one gallon of oil per day. There are around seven billion people alive today. Assuming a steady population, over the next year these people will use around three trillion gallons of oil. If we estimate the stock of oil at one thousand trillion gallons, and if these (mostly fictional) numbers were to hold steady, then we’d have about three centuries of oil left.
The calculation is complicated. To decide if a non-renewable resource is unsustainable depends on how much of it there is, the changing rate of its use, and the number of people expected in the future. It also hinges on whether the non-renewable will remain non-renewable, that a substitute for the non-renewable will not be discovered, and that the effect caused by use of the non-renewable will always be desired. We must know all these things, else the point at which we run out of the non-renewable will be unknown. If we do not know all these things, it is wrong to claim use of a resource is “unsustainable.” Let’s take each item in turn.
There are tremendous uncertainties in estimates of non-renewable stockpiles. How much crude oil is left? There are many widely varying answers, but no consensus. How much uranium? How much coal? How many rare earth minerals? How much of some other substance which is not now seen as important but which, after some technological change or cultural innovation, will become crucial? All great questions, and all with wide plus-or-minus bounds.
The rate at which a thing is used depends on the number of people using it, which itself depends on culture and politics and the state of technology. We can form reasonable but imperfect guesses of consumption for the here-and-now, but forecasting use is fraught with danger. Even supposing a fixed population, no serious student of history can be comfortable projecting shifts in culture, and only the foolish are sure of what lies ahead technologically. Technology can change so that the resource used is needed more or needed less to produce the same effects, or technology can lead to the discovery of substitutes for the resource’s effects. Or the effects themselves - and this falls under culture - can be seen as less or more desirable.
We enjoy lighting in our abodes but no longer employ whale oil for this effect. This non-renewable resource would have been depleted given the population rise since 1900 and the increased demand for the effect. But - much of the increase in the demand was caused by the improving technology and the substitution of electricity. Nobody in 1900 came remotely close to predicting these changes. Who can say with any certainty what effects people a century hence will demand or how the effects demanded will be produced?
Are People Good Or Bad?
And you, be ye fruitful, and multiply; bring forth abundantly in the earth, and multiply therein. Evidently, God likes people; he likes having them about, and desires more of them. Contrariwise, environmentalists are suspicious of people; they don’t like having them about; some have even called people a “cancer.” God called creation Good. Environmentalists agree, but they idealize a state of Pure Nature, a place apart from Man, a state to which Nature can return if Man is removed. But Man in God’s scheme is inseparable from Nature.
God’s scheme has the merit of being scientifically correct. The PAS speaks of “human interference with the Earth System.” But Man’s presence is integral with every other species, and with the planet itself. And the same is true of other life, both with respect to Man and to Nature. Man developed in concert with other species and with the earth as a whole. Each part of Nature therefore necessarily touches each other. After Man’s arrival, he was forever unified with the whole of Nature. It is thus false to say, “That over there is Nature, and this Man.”
It is also false to say, “That over there is Nature, and these are aardvarks.” Or radishes. Nature must affect all life, and all life must affect all of Nature. The effects each species have will be different, of course, and vary in size and range. Life creates what Nature is. The PAS is wrong. While Man exists, it is impossible to “minimize” Man’s (or aardvarks’ “interference” with Nature. If any man (or aardvark) exists, there is no non-interference, there are only differing effects. “interference” with Nature. If any man (or aardvark) exists, there is no non-interference, there are only differing effects.
How Many Of Us?
Population began its rapid rise with the increase in technological sophistication, primarily agricultural innovation. As the late philosopher David Stove labored in vain to show us, people always get Malthus wrong: It is not that more people are encroaching upon more food sources, it is that more food leads to more people. Plentiful, cheap, and nutritious food caused, or rather allowed, the increase. Think: if there is not enough food, there cannot be an increase in population! It follows there cannot be “too many” people. The PAS speaks of a “sustainable population,” yet the number of people must always be equal or less than the number that can be supported. And, as we’ll see below, it is increasingly less.
To within a power of ten, and including those currently alive, there have lived about 100 billion people. How many does God want? Nobody knows, but He said there’d be many as like the stars of heaven. When does God want these people to be born? Nobody knows, not even environmentalists. How many more people will be born? We might be able to guess - and we need to, if we’re going to claim non-sustainability of any resource.
The number of future people cannot be infinite for two reasons, one scientific, one eschatological. The earth is finite, and the solar system is winding down, as it were. But these astronomical observations pale next to the promise God made us. Time will end. In the very last chapter of Summa Contra Gentiles, St Thomas said, “the movement of the heavens will cease when the number of men is complete.” Jesus will come again to judge the living and the dead. Maranatha. When? But of that day and hour no one knoweth, not the angels of heaven, but the Father alone. I stress this “no one” includes environmentalists, scientists, and even theologians.
Our bounds for future population numbers are thus necessarily loose. If Jesus comes in the next moment, there will be no more children; but if he tarries, we know he won’t tarry indefinitely. The best we can say are things like this: if Our Lord tarries until 2100, and given various other fallible assumptions about human behavior, there will be about X many more people.
Cultural Hubris
Let’s try - we will not be entirely successful - to characterize these fallible assumptions. Who are not having babies? Strangely, it’s those who are most comfortable with and in the world. People delay marriage and baby-making so that they can establish themselves, make money, and acquire things. It’s the successful who say they can’t make babies because they cannot “afford” them. Large families are also somewhat shameful. Nobody wants to be told they’re breeding like rabbits.
Another paradox. Particularly in the so-called First World, small families use relatively more resources than large. Speaking on average, eight-person families do not have four times as many houses, cars, televisions and so forth as a childless couple. The eight eat more than the two, but perhaps not four times as well. The eight cannot afford to live as sumptuously, because they have to stretch their income.
Unless one is dedicated to God or to some other noble cause, having fewer or no children allows more time to be spent in the pursuit of wealth. Environmentalists like to point out that if the entire world lived as Americans do, resources would be depleted at a higher rate. This is true, ceteris paribus. But the environmentalist solution is to encourage people to have fewer children, and the lack of children allows people to focus more on themselves and thus use more resources! This is not the first time liberal policies would create the very problem they seek to solve.
Incompatible Weltanschauung
There are also theological difficulties created by the methods environmentalists advocate to reduce population: contraception, abortion, and the encouragement of sexual acts not directed toward procreation. Environmentalist ideology is not pro-, but is anti-creation. Profligacy and gluttony are sins, as both Catholics and Environmentalists agree. Yet though we sometimes fail to husband our resources wisely - there is much waste and improper pursuit of material wealth - having a second car is surely less morally perilous than killing a child ("aborting" both the unborn and born) or preventing its birth. Environmentalists would have us save our planet but lose our souls.
To state any non-renewable resource is unsustainable requires knowing many things which are difficult or nearly impossible to estimate. We need to know the amount of the resource now present, details of the technologies which use the resource, the effects desired, the nature of a changing culture, politics, and science, and more. Except in the simplest circumstances, certainty cannot be claimed. Yet the PAS would have us believe the end is nigh. Why?
The difference between environmentalist sustainability ideology and Catholic theology is people. People are a nuisance or a necessity, apart from or a part of Nature, created for the sake of themselves or for the sake of God. These worldviews are incompatible. This much is certain: if people stopped having babies, Mankind itself would be unsustainable. Father James Schall is right:
The root of the “sustainability mission,” I suspect, is the practical denial of eternal life. “Sustainability” is an alternative to lost transcendence. It is what happens when suddenly no future but the present one exists. The only “future” of mankind is an on-going planet orbiting down the ages. It always does the exact same, boring thing. This view is actually a form of despair. Our end is the preservation of the race down the ages, not personal eternal life.
Environmentalist eschatology is not Catholic. When the earth is all there is, you rage at the dying of the light and seek perfection everywhere but where it exists.
May 09, 2015
Media beats up Willie Soon, turns a blind eye to EPA-funded researchers shilling for EPA $$$
Steve Milloy

PDF
The Energy Institute is concerned about EPA’s proposed ozone regulations, which studies have found could be the most expensive regulation every implemented. EPA’s new regulations will dramatically increase “nonattainment areas” throughout the country. The rules will immediately add red tape to economic development that is vital to growing new jobs. Nonattainment areas face even more severe requirements that significantly curtail business development. Companies building or expanding facilities in nonattainment areas are required to reduce ozone-forming emissions regardless of cost, and economic development cannot move forward unless such emissions are reduced from other sources. These impacts are illustrated in the Energy Institute’s ozone infographic, available as a PDF here and shown above.
We have steadily reduced ozone levels - which are now at their lowest levels in three decades - and grown our economy significantly while doing so. But EPA’s latest regulatory push goes too far, too fast, and will strangle jobs and economic growth across much of the country. America’s communities need to know the dramatic negative impact of these proposed regulations, share this infographic with your friends today.
See more here. More. http://www.energyxxi.org/what-does-epas-ozone-regulation-mean-your-community
Icecap Update: See Judith Curry’s insightful look into government funding of scientific research “Is federal funding biasing climate research?” CATO has published a very interesting analysis by David Wojick and Pat Michaels entitled Is the Government Buying Science or Support? A Framework Analysis of Federal Funding-induced Biases”.
---------------
By Steve Milloy
Remember just two months ago when the media savaged climate skeptic Willie Soon for supposedly failing to disclose industry funding? It’s a pity the media doesn’t.
Yesterday, the media trumpeted a new article in the journal Nature Climate Change supporting EPA’s claim that its carbon dioxide rule would save thousands of lives per year. Here’s the New York Times headline:

EPA study headline NYTimes 050515
The study authors,

Driscoll study authors
were simply and innocuously described by the media as:
“researchers at Syracuse and Harvard Universities” (New York Times);
“scientists from Harvard and Syracuse universities and four other institutions” (Washington Post)
“from Harvard and Syracuse University” (Associated Press).
And, of course, why would the articles authors be described in any other way since they made the following disclosure at the end of the article:

Driscoll disclosure
Article co-author Driscoll even told the Buffalo News that he had “no dog in the fight”:

Driscoll no dog in fight comment
But is this really true? Do Charles Driscoll, Joel Schwarz and Jonathan Levy really have NO competing financial interests?
Anyone who follows EPA air quality “research” is no doubt convulsing at this claim.
Below are listed the article’s authors and the dollar amounts of EPA grants with which they are associated as principal investigators”:
Charles T. Driscoll: $3,654,608
Jonathan J. Buonocore: $9,588
Jonathan I. Levy: $9,514,391
Kathleen F. Lambert: 0
Dallas Burtraw: $1,991,346
Stephen B. Reid: 0
Habibollah Fakhaei: 0
Joel Schwartz: $31,176,575
Now how could Schwartz’s $31,176,575 or Levy’s $9,514,361 or Driscoll’s $3,654,608 from EPA possibly be considered as a “competing financial interest” in an article they wrote in support of EPA’s flagship regulatory effort?
Comically, the US News and World Report reported:

Driscoll EPA not part clip
A Harvard School of Public Health described the researchers as “independent”:
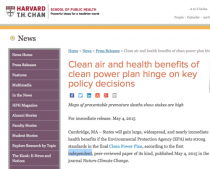
Driscoll Harvard clip independent
Right… the $45 million these researchers have been paid by EPA over the years - plus the prospect of more money - had no influence over them.
Let’s not overlook that Driscoll admitted to the Pittsburgh Post-Gazette that the result of this study was predetermined:

Driscoll wanted to bring attention
It’s like shooting fish in a barrel. Anyway…
Willie Soon was repeatedly raked over the coals by the media for his alleged failure to disclose industry funding of his work. Democrats in Congress (Rep. Raul Grijalva, and Sens. Boxer/Markey/Whitehouse) launched attacks on universities and businesses for funding climate skeptics.
Soon defended himself by saying:
...In submitting my academic writings I have always complied with what I understood to be disclosure practices in my field generally, consistent with the level of disclosure made by many of my Smithsonian colleagues.
“If the standards for disclosure are to change, then let them change evenly. If a journal that has peer-reviewed and published my work concludes that additional disclosures are appropriate, I am happy to comply. I would ask only that other authors-on all sides of the debate-are also required to make similar disclosures. And I call on the media outlets that have so quickly repeated my attackers’ accusations to similarly look into the motivations of and disclosures that may or may not have been made by their preferred, IPCC-linked scientists…
The hypocrisy (is there a stronger word?) is breathtaking.
Oh and by the way, the claim that EPA’s carbon dioxide rules is going to save lives is total nonsense.
Update: Lord Monckton has filed a research misconduct complaint with Harvard University.
May 08, 2015
Bill Gray tells it like it is
I am appalled that objectivity has been so blatantly disregarded by our government and the world’s environmentalists who would use erroneous climate model results to justify their faulty AGW pronouncement which are injurious to humanity.
Gray’s View on AGW.
We AGW skeptics need to be able to offer two basic plausible physical explanations in order to negate the AGW hypothesis.
1. Why projected CO2 increases over the next 50-100 years will only be able to bring about very small amounts (0.2-0.4C) of global mean temperature rise.
2. Why there is natural climate change unrelated to CO2 variations? We need a believable physical explanation for the global climate changes over the last few thousand years (Little Ice Age, Medieval Warm Period, etc.) and in particular the apparent quite modest global warming of the last century. We also need an explanation of the shorter time-scale multi-decadal global warming periods (1910-1940, 1975-1999) and of the global cooling or neutral periods (1880-1910, 1940-1974, and 1999-2015).
Explanation #1 can be understood as a result of CO2 increases causing more global precipitation and associated increase in the globe’s deep cumulonimbus (Cb) convective clouds. These CO2 induced precipitation increases bring about upper tropospheric drying which allows more infrared (IR) flux to space - a negative water-vapor feedback. This extra rainfall enhances surface evaporation cooling which acts to balance out most of the expected global warming resulting from CO2’s increasing blockage of IR to space (3.7 Wm-2 for a CO2 doubling). This prevents CO2 increases from bringing about any significant global warming. Only minimal warming (0.2-0.4C) is going to occur with a doubling of CO2. The main effect of CO2 increases will be an enhancement of global average precipitation of about 3 percent. This enhanced global rainfall will occur in regions where it is already raining and should be hardly noticed.
Explanation #2 can be explained by the multi-decadal and multi-century variations in the globe’s deep ocean circulations (or Meridional Overturning Circulation or MOC) which are primarily driven by space and time variations of oceanic salinity. Salinity changes occur in ocean areas where there are long period differences in surface evaporation minus precipitation. This is especially the situation of the Atlantic where ocean evaporation is 10-20 percent greater than precipitation. Salinity driven ocean changes bring about alterations in the strength of the Atlantic Ocean Thermohaline Circulation (THC), and through Pacific basin upwelling response variations to variation in the Pacific multi-decadal oscillation (PDO) as well. There is also salinity driven ocean subsidence around the Antarctic continent. All these factors influence the strength of the MOC.
Most of the globe’s last century weak global warming has, in my view, been a consequence of a modest slowdown of the global oceans MOC. This last century long MOC slowdown is also detected in an associated weak increase (in milliseconds) in the earth’s rate of rotation.
Lack of Ability of Other Suggested Non-ocean Climate Change Mechanisms to Rival or be Superior to Coming CO2 Influences. The many other non-ocean proposed physical ideas for climate change (where orbital parameters do not play a role) such as
1. Solar variability
2. Sun-spot changes
3. Cosmic ray variability
4. Aerosol changes
5. Human land use changes
6. Volcanic activity
may each play a minor role in some aspects of the globe’s climate alteration. But the individual physical influence of each of these suggested mechanisms is too small to be used as a dominant physical argument against the CO2 change hypothesis.
None of the above proposed climate change mechanisms well match the observed past changes in global temperature. In addition, the magnitude of potential energy change from these above non-ocean physical mechanisms does not have the power to come close to producing the climate changes which the variations of the deep ocean circulations are capable of bringing about.
We AGW skeptics who have proposed non-ocean climate change mechanisms as an alternate to CO2 induced climate changes will continue to have difficulty in rebutting the CO2 advocates. These alternate physical hypothesizes do not have enough supporting observational evidence to allow any one of them or a combination of them to be judged to be more dominant than the changes which future CO2 increases will be able to bring about.
We critics of the AGW CO2 warming hypothesis need a more dominant alternate physical hypothesis which is stronger and which better conforms in time with the global observations. Changes in the ocean’s deep circulation currents appears to be, by far, the best physical explanation for the observed global surface temperature changes (see Gray 2009, 2011, 2012, 2012). It seems ridiculous to me for both the AGW advocates and us skeptics to so closely monitor current weather and short-time climate change as indication of CO2’s influence on our climate. This assumes that the much more dominant natural climate changes that have always occurred are no longer in operation or have relevance.
Cumulus Convection Influences.
Most cumulus convection is organized in meso-scale cloud clusters containing 10 to 20 individual Cb convective elements which are typically concentrated in areas of 200-500 km wide. The individual deep Cb convective cells within these cloud-cluster systems are often arranged in lines and new convective elements are continuously being formed and dissipated. Each new Cb convective element goes through a typical lifecycles of an hour or so. The strong downdrafts from the late stages of these dying Cb elements typically contribute to the low-level mass forcing needed for the initiating of other new adjacent Cb clouds. This is why multiple Cb clouds tend to cluster together.
Cb clouds penetrate well into the middle and upper troposphere. The excess mass within the weakening upper-level Cb elements diverge and spread out as cirrus clouds. This higher level extra mass and cirrus cloudiness then begins to undergo sinking so as to make space and satisfy mass balance for the new emerging upper tropospheric Cb penetrating elements.
Subsidence Drying.
Cumulonimbus updraft elements have very high rainfall efficiency as they weaken and die in the very cold upper troposphere. The very cold air at these upper tropospheric levels can hold (even at saturation) very little water-vapor (only about 1% of the low-level moisture content by mass and 0.1 of 1% by volume) compared to the middle and lower tropospheric moisture contents. This very low water-vapor content air from the upper Cb outflow then sinks, evaporates its cloud particles, and arrives at lower levels where the saturated water-vapor contents are much higher. The original upper-level dry air then mixes with the lower level air. This mixture of air at the lower level becomes drier than the air at this level was before any of the upper-level air mixed into it.
A saturated air parcel from a dying Cb cloud which sinks from the 200 mb (12 km height) level to the lower pressure height of 300 mb (10 km ht.) will arrive at this lower-level with a RH of only 10-12 percent of the lower level air. These unusually large upper-level subsidence drying amounts are a consequence of the very large gradient of saturated vapor pressure in the upper troposphere. Vertical gradients of saturated vapor pressure at middle and lower tropospheric levels are, percentage wise, much smaller.
An increase in global deep convective (Cb) activity as a result of CO2 increases will thus bring drying (not moistening) to the upper troposphere, just the opposite of the climate models projections. This upper tropospheric drying acts to lower the infrared (IR) radiation emission level (EL) to a lower height and a warmer temperature where larger amounts of IR energy (σT4) are able to be fluxed to space. Increases in net global Cb convective activity results in higher amounts of IR energy being fluxed to space, not lower amounts as all the climate modelers and their fellow AGW advocates believe.
Our extensive analysis of the ISCCP data well shows the degree to which the broad upper-level sinking air from the global rain areas have had their RH reduced when an enhancement of the global rainfall rate (and accompanied increase in Cb convection) occurs. Please see the attached short write-up “Crux of AGWs Flawed Science” for more detailed discussion and clarifying figures and tables.
How Global Temperature Will Change as CO2 Increases.
The rise of CO2 gas occurs very slowly. By contrast, the troposphere’s hydrologic cycle and its energy dissipation cycle operate on a time-scale of only around 10 days. Any CO2 radiational induced warming will be quickly felt by the earth’s surface and will immediately act to enhance surface evaporation. The more surface evaporation, the less the surface will warm.
A doubling of CO2 gas in the atmosphere will cause an alteration of our global climate but not in the same way as envisioned by the climate modelers or by the majority of scientists studying this topic. Most researchers concentrate only on the direct radiation influences which CO2 increases bring about. They tend not to consider the other related feedback mechanisms which will be simultaneously activated as CO2 amounts increase. The increased global evaporation from CO2 increase will extract energy from the earth’s surface and enhance surface cooling. This will act to reduce the pure radiation assumed 1C warming through both enhanced IR energy flux to space and enhanced surface evaporation. The more evaporation from a doubling of CO2 will act to further reduce the 1C direct radiation only temperature response. As the CO2’s induced speed-up of the globe’s hydrologic cycle continues the cooling influences of the enhanced surface evaporation-precipitation will greatly suppress any pure radiation assumed rise of 1C. Doubling CO2 will thus be able to bring about only a quite modest global warming. The main influence of a doubling of CO2 will be to increase average global precipitation.
Basic Flaw of the AGW Hypothesis.
It is the climate models parameterization schemes for cumulus convection (particularly the deep cumulonimbus (Cb) convection) which are grossly unrealistic and which completely negates the global modeler’s projections of 2-5C warming for a doubling of CO2. This does not mean that the globe won’t be measurably influenced from CO2 doubling. But this CO2 influence will occur primarily as an enhancement of the global hydrologic cycle (precipitation) and only minimally from a rise in global surface temperature.
The AGW hypothesis that warming from increased CO2 will enhance global rainfall is correct. But the assumption that this added rainfall and added tropospheric condensation warming will greatly increase upper tropospheric temperature and water-vapor (through the assumption of constancy of relative humidity) is not at all valid. The opposite occurs. Increased deep Cb convection causes dryness to the upper troposphere. The climate modeler’s large increase in upper tropospheric water-vapor and temperature from added CO2 does not agree with the physics of how real-world deep Cb convection functions. And the additional positive feedback doubling of the upper troposphere warming and moistening which they add to the direct CO2 radiation blockage is completely bogus. This additional feedback assumption greatly increases the divergence of their model simulations from reality.
Summary
The global climate modelers assumed that CO2 enhanced global rainfall will bring about large upper-tropospheric water-vapor and temperature increases. These upper-level water-vapor increases are then projected to bring about even larger temperature increases and additional water-vapor (positive water-vapor feedback) amounts which add twice as much additional blockage of infrared (IR) energy to space than the initial influence of the CO2 blockage alone. Such large water-vapor and temperature increases are not at all realistic. This is the Achilles-heel of the whole AGW theory.
Comment.
None of the global climate modelers or other AGW advocates seem to know that the globe’s deep cumulonimbus (Cb) convection processes act, not to increase upper level water-vapor, but in an opposite sense to reduce the globe’s upper tropospheric water-vapor content. The global climate modelers live in a very isolated Ivory Tower world. Their positive water-vapor feedback schemes in their doubling of CO2 simulations shows that they know next to nothing about how the atmosphere’s cumulus convective and moisture processes really function.
Gray Research Project. I and my Colorado State University (CSU) research project have a long background in studying cumulus convection, and particularly deep and intense cumulonimbus (Cb) convection of the tropics associated with meso-scale rain systems and tropical cyclones. We have published a lot of material on this subject over many years. These convective studies appear to provide crucial background information fundamental to establishing the invalidity of the AGW hypothesis. My CSU project’s over 50 years of tropical meteorology research has, by necessity, had to make the study of cumulus cloud convection a priority item for the understanding of tropical circulations and tropical cyclones. Our information has been gained from my project’s extensive involvement in many field experiments and from rawinsonde compositing activities over many years and recently through extensive analysis of ISCCP and NOAA Reanalysis data. To my knowledge, none of the AGW proponents have ever referred to any of my project’s many published papers and project reports.
Any scientist having advanced and detailed knowledge and working level experience of the globe’s deep cumulus convection process can completely negate the scientific validity of the AGW hypothesis. This could have been done decades ago if there had been an open and honest debate and further research on how changes in cumulus convective dynamics are related to CO2 increase. This greatly needed open and objective debate on cumulus convection process began and was taking place during the late 1960s and 1970s. But these studies were discontinued during the 1980s-1990s when the global models began to show useful results which the politicians, environmentalists, and the world government advocates could use to back up their desired AGW hypothesis. They did not want any further tampering with the models and the earlier momentum build-up for cumulus-moist process research did not go forward. The AGW advocates needed to utilize the unrealistic CO2 doubling climate model warming results as a scare mechanism to advance their agendas. And the CO2 global climate modeling community was quite happy to provide this justification and be well rewarded for their efforts.
Please see the attached paper ”Crux of AGW’s Flawed Science” for full background discussion with figures and tables.
|


.jpg)