By Robert J. Caprara July 8, 2014 7:15 p.m. THE WALL STREET JOURNAL
Confessions of a Computer Modeler
Any model, including those predicting climate doom, can be tweaked to yield a desired result. I should know.
The climate debate is heating up again as business leaders, politicians and academics bombard us with the results of computer models that predict costly and dramatic changes in the years ahead. I can offer some insight into the use of computer models for public-policy debates, and a recommendation for the general public.
After earning a master’s degree in environmental engineering in 1982, I spent most of the next 10 years building large-scale environmental computer models. My first job was as a consultant to the Environmental Protection Agency. I was hired to build a model to assess the impact of its Construction Grants Program, a nationwide effort in the 1970s and 1980s to upgrade sewer-treatment plants.
The computer model was huge - it analyzed every river, sewer treatment plant and drinking-water intake (the places in rivers where municipalities draw their water) in the country. I’ll spare you the details, but the model showed huge gains from the program as water quality improved dramatically. By the late 1980s, however, any gains from upgrading sewer treatments would be offset by the additional pollution load coming from people who moved from on-site septic tanks to public sewers, which dump the waste into rivers. Basically the model said we had hit the point of diminishing returns.
When I presented the results to the EPA official in charge, he said that I should go back and “sharpen my pencil.” I did. I reviewed assumptions, tweaked coefficients and recalibrated data. But when I reran everything the numbers didn’t change much. At our next meeting he told me to run the numbers again.
After three iterations I finally blurted out, “What number are you looking for?” He didn’t miss a beat: He told me that he needed to show $2 billion of benefits to get the program renewed. I finally turned enough knobs to get the answer he wanted, and everyone was happy.
Was the EPA official asking me to lie? I have to give him the benefit of the doubt and assume he believed in the value of continuing the program. (Congress ended the grants in 1990.) He certainly didn’t give any indications otherwise. I also assume he understood the inherent inaccuracies of these types of models. There are no exact values for the coefficients in models such as these. There are only ranges of potential values. By moving a bunch of these parameters to one side or the other you can usually get very different results, often (surprise) in line with your initial beliefs.
I realized that my work for the EPA wasn’t that of a scientist, at least in the popular imagination of what a scientist does. It was more like that of a lawyer. My job, as a modeler, was to build the best case for my client’s position. The opposition will build its best case for the counter argument and ultimately the truth should prevail.
If opponents don’t like what I did with the coefficients, then they should challenge them. And during my decade as an environmental consultant, I was often hired to do just that to someone else’s model. But there is no denying that anyone who makes a living building computer models likely does so for the cause of advocacy, not the search for truth.
Surely the scientific community wouldn’t succumb to these pressures like us money-grabbing consultants. Aren’t they laboring for knowledge instead of profit? If you believe that, boy do I have a computer model to sell you.
The academic community competes for grants, tenure and recognition; consultants compete for clients. And you should understand that the lines between academia and consultancy are very blurry as many professors moonlight as consultants, authors, talking heads, etc.
Let’s be clear: I am not saying this is a bad thing. The legal system is adversarial and for the most part functions well. The same is true for science. So here is my advice: Those who are convinced that humans are drastically changing the climate for the worse and those who aren’t should accept and welcome a vibrant, robust back-and-forth. Let each side make its best case and trust that the truth will emerge.
Those who do believe that humans are driving climate change retort that the science is “settled” and those who don’t agree are “deniers” and “flat-earthers.” Even the president mocks anyone who disagrees. But I have been doing this for a long time, and the one thing I have learned is how hard it is to convince people with a computer model. The vast majority of your audience will never, ever understand the math behind it. This does not mean people are dumb. They usually have great BS detectors, and when they see one side of a debate trying to shut down the other side, they will most likely assume it has something to hide, has the weaker argument, or both.
Eventually I got out of the environmental consulting business. In the 1990s I went into a completely different industry, one that was also data intensive and I thought couldn’t be nearly as controversial: health care. But that’s another story.
Mr. Caprara is chief methodologist for PSKW LLC, which provides marketing programs for pharmaceutical firms.
Alan Carlin formerly of the EPA who challenged the EPA Endangerment finding was given a whistleblower award for his challenge to the Endangerment Finding. See his award after Pat Michaels keynote address.
In the story below in Icecap in the News on “Welcome back to the 1950s and soon the 1960s and 1970s and then 1800” I showed how temperatures correlate well with natural cycles.
At Weatherbell, Joe Bastardi and I use data sets in our work to correlate with the many natural cycles as measured in teleconnections. We generally use the reanalysis data sets from NCEP and the climate division data from NOAA.
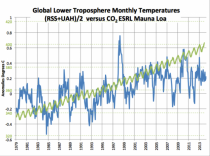
The most reliable data sets are likely the satellite sets because of very nearly global coverage and the lack of contamination from local heat sources. The average of the two satellite sets (RSS and UAH) shows a step change with the super El Nino and little change post 1998.
But the NOAA temperature land/ocean based data sets keep changing. Ryan reassures us the reanalysis data set, which is based on hourly observations is not adjusted. Climate division data though is a different story. So when we do a composite after June for a set of years, we will get a different result. There are three major surface data centers, NOAA in Asheville, NASA Goddard in New York City, and Hadley in the UK.
But we here I’ll focus on NOAA here. NOAA is the source of the base data that NASA and Hadley use before adding their own adjustments and additional data (NASA Antarctic and extrapolated arctic and Hadley their own ocean data).
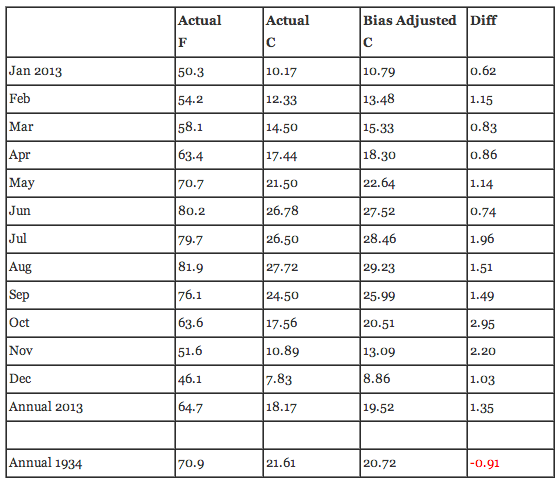
The first USHCN 1221 station data set was released in 1990 with a UHI adjustment. It was generally regarded as the world’s best because of the long history for most stations and the stability of the network.
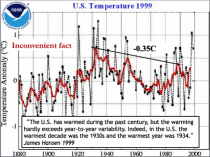
In the 1999 USHCN plot, it showed the 1930s was the warmest decade and 1934 the warmest year (1.1F warmer than the super El Nino of 1997/98). Hansen said so in this plot on the GISS web site of the NOAA data set. The trend peak to peak of the 5 year mean was down.
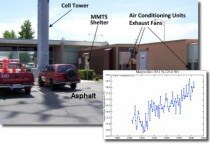
I praised NOAA NCDC for its efforts to get it right although a decade later we discovered siting in many cases increasingly did not meet standards thank to a move to ASOS with sensors near tarmac, changing technology requiring cabling of the sensors to the weather office often putting the sensors near buildings, driveways, parking lots, air conditioning exhausts or other heat sources. Numerous sites were placed at heat generating waste treatment plants. Even the GAO scolded NOAA for over 40% of their stations not meeting the minimum criteria NOAA itself had in the specifications. The UHI adjustment offset some of these biases.
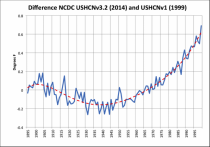
Most of the original correlation studies I did used this data set. But the inconsistency of warming relative to the global data set (GHCN), which showed much more warming late century put political pressure on NCDC to make the two data sets more consistent. Instead of trying to find the metadata to add UHI adjustments to the GHCN, the changes were made to the US adjustments.
They removed the UHI adjustment, replacing it with algorithms to find previously undocumented inhomogeneities (station moves), and a change to the time of observation adjustment and a new final step with homogenization (blending of data stations). 2 versions later the data set shows the changes made to the annual values in degrees F. The warming increased 0.8F from 1930 to 1990 simply due to adjustments. There was with the adjustments, cooling of the 1920s to 1950s and warming post the 1960s.
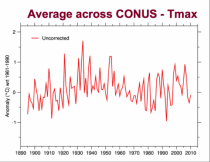
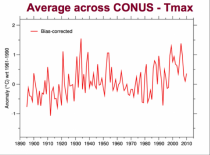
UHI mainly affects minimum temperatures. Maximum temperatures are a better indicator of the true trends. Even bias corrected maxima shows the recent peak no higher than the 1930s.
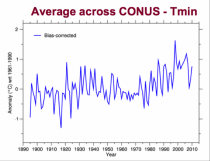
The minima (and in the end the mean) clearly shows the recent warmth which is consistent with UHI.
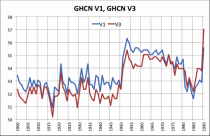
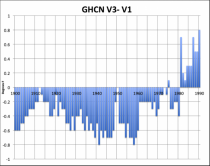
The global set meanwhile has undergone changes too since V1. V3 and V1 are plotted here. The reasons include changing station sets and application of the same kinds of adjustments.
The difference is even more remarkable than the US (1.2F or so). In other words most of the apparent warming in the data set since the late 1800s is in the adjustments. This is the CHANGE made to the global mean temperature NOT the global mean temperature.
The Latest Change - US state data.
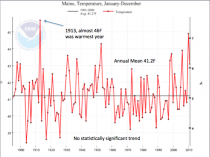
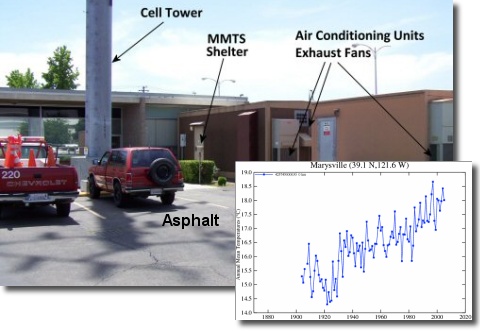
Locally we used the NCDC USHCN Climate at a Glance in talks. I gave one such invited talk in Maine to a local group a few years ago.
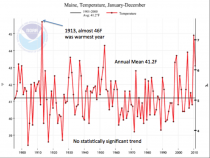
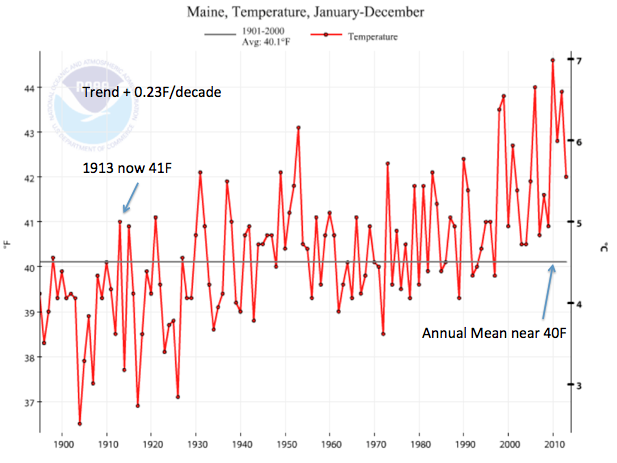
Here was the Maine plot of annual temperatures the last time I downloaded it. It showed no trend since 1895. The warmest year was 1913 with a bookend spike a century later in 2010. Both followed high latitude volcanism, in 1913 following 1912 Novarupta in Alaska and 2010 following series of eruptions in Alaska and Iceland. These high latitude volcanoes produce more high latitude blocking (Oman 2004). This is especially true with very low solar geomagnetic years. These blocks mean a maritime flow into southeast Canada and Maine making the winters and springs less snowy and cold.
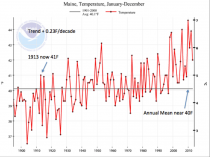
This spring, NCDC announced a new version of the US data set replacing the USHCN used at Climate at a Glance with a new GHCN based Climate DIvision alternative. Maine suddenly has a 0.23/decade warming trend and 1913 was 5F colder and not even close to 2010.
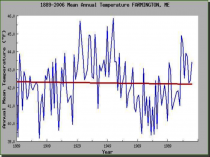
We can still access in places the original raw data. The raw rural data for Farmington Maine, near one of the big ski areas is very instructive and shows a nice sine wave in sync with the 60-70 year PDO/AMO cycles and more like USHCN v1 and TMAX. The station was discontinued after 2006. I’ll let you speculate why.
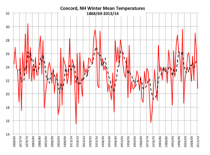
Concord, NH is an urban area, but the airport is a well-known cold spot compared to Manchester, which is often the warmest station in the state. The sensors must be well placed.
I had to do a winter plot of Concord temperatures since 1868/69 and found little change over the entire period of record - again this is raw archived data downloaded from the PWM web site.
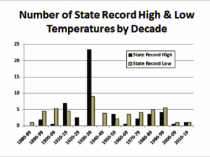
The record highs and lows are also not adjusted and look more like USHCN v1 with 23 record highs in the 1930s and 38 before 1960 and more record cold than highs since the 1940s.
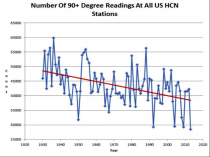
The number of 90F temperatures at all USHCN station (raw, unadjusted) shows a similar downtrend.
Keep these in mind when you hear NOAA give a ranking of a month or year or hear the speeches why POTUS through the EPA is taking strong action.
Obama isn’t doing his job. He’s waiting for history to recognize his greatness.
I don’t know if we sufficiently understand how weird and strange, how historically unparalleled, this presidency has become. We’ve got a sitting president who was just judged in a major poll to be the worst since World War II. The worst president in 70 years! Quinnipiac University’s respondents also said, by 54% to 44%, that the Obama administration is not competent to run the government. A Zogby Analytics survey asked if respondents are proud or ashamed of the president. Those under 50 were proud, while those over 50, who have of course the longest experienced sense of American history, were ashamed.
We all know the reasons behind the numbers. The scandals that suggest poor stewardship and, in the case of the IRS, destructive political mischief. The president’s signature legislation, which popularly bears his name and contains within it the heart of his political meaning, continues to wreak havoc in marketplaces and to be unpopular with the public. He is incapable of working with Congress, the worst at this crucial aspect of the job since Jimmy Carter, though Mr. Carter at least could work with the Mideast and produced the Camp David Accords. Mr. Obama has no regard for Republicans and doesn’t like to be with Democrats. Internationally, small states that have traditionally been the locus of trouble (the Mideast) are producing more of it, while large states that have been more stable in their actions (Russia, China) are newly, starkly aggressive.
That’s a long way of saying nothing’s working. Which I’m sure you’ve noticed.
But I’m not sure people are noticing the sheer strangeness of how the president is responding to the lack of success around him. He once seemed a serious man. He wrote books (ghost writer - Bill Ayers), lectured on the Constitution. Now he seems unserious, frivolous, shallow. He hangs with celebrities, plays golf. His references to Congress are merely sarcastic: “So sue me.” They don’t do anything except block me. And call me names. It can’t be that much fun.”
In a truly stunning piece in early June, Politico’s Carrie Budoff Brown and Jennifer Epstein interviewed many around the president and reported a general feeling that events have left him - well, changed. He is “taking fuller advantage of the perquisites of office,” such as hosting “star-studded dinners that sometimes go on well past midnight.” He travels, leaving the White House more in the first half of 2014 than any other time of his presidency except his re-election year. He enjoys talking to athletes and celebrities, not grubby politicians, even members of his own party. He is above it all.
On his state trip to Italy in the spring, he asked to spend time with “interesting Italians.” They were wealthy, famous. The dinner went for four hours. The next morning his staff were briefing him for a “60 Minutes:” interview about Ukraine and health care. “One aide paraphrased Obama’s response: ‘Just last night I was talking about life and art, big interesting things, and now we’re back to the minuscule things on politics.’”
Minuscule? Politics is his job.
When the crisis in Ukraine escalated in March, White House aides wondered if Mr. Obama should cancel a planned weekend golf getaway in Florida. He went. At the “lush Ocean Reef Club,” he reportedly told his dinner companions: “I needed this. I needed the golf. I needed to laugh. I needed to spend time with friends.”
You get the impression his needs are pretty important in his hierarchy of concerns. Read more at the Wall Street Journal.
Anthony continues: “Paul Homewood deserves the credit for taking the finding and establishing it in a more comprehensible way that opened closed eyes, including mine, in this post entitled Massive Temperature Adjustments At Luling, Texas.
Along with that is his latest follow up, showing the problem isn’t limited to Texas, but also in Kansas. “
It appears in summary:
Approximately 40% of the data has been estimated, even though they have a lot of good data in hand. The data isn’t making the migration for the RAW to the FINAL USHCN file due to some error in the data flag.
Also, there’s the issue of “Zombie weather stations” Closed stations like Marysville, CA that closed due to may expose’ in 2007 are still reporting data in the FINAL USHCN file because the FILNET program is “infilling” them with estimated data based on surrounding stations.
Since 80% of the network has compromised siting, the data used to infill is compromised.
It’s a real mess.
Anthony adds “So far just USA for this error, we don’t know about GHCN yet.”
ICEAP NOTE: I have posted that I had downloaded from NCDC Climate at a Glance the Maine state Annual temperatures in 2013 for a talk and it showed no warming since 1895! (the trend was shown as -0.03/decade). Well after NOAA announced a transition to the CLIMDIV version of USHCN at the end of this brutal winter, I decided to download the new plot. The new CLIMDIV data was supposed to resolve issues with recent station moves, transition to airport, to new MMTS technology and UHI and siting issues with improvements late in the record, we were very surprised to see the biggest changes to the early data set. 1913 went from the warmest year in the record to the middle of the pack with a cooling of close to 5F!. The log term average dropped over 1F. The long term trend rose to +0.23F/decade, the largest of the 50 states.
Update: See this powerful interview with Murray Energy CEO on how Obama’s EPA’s plans will cause electricity to double, hurting the poor and middle class most. Prices Obama promised will necessarily skyrocket. He is delivering on that promise.
Also, while announcing her candidacy for the 6th Congressional District in Louisiana, Whitney called global warming a “hoax.” The video is a response to those she describes as “liberals in the lamestream media” who “became unglued and attacked me immediately.”
Calling Al Gore and other liberal politicians pushing global warming “delusional,” Whitney reminds viewers that “The earth has done nothing but get colder each year since the film’s release.”
Whitney then goes on to cite a litany of other scientific facts to rebut and mock global warming believers, including President Obama, whom she calls “foolish” for blaming his lousy economy on warming.
“Last summer,” Whitney reminds, “Antarctica reached the coldest temperature in recorded history. There’s record sheet ice and a 60% rise of ice in the Arctic Sea.”
Using compelling video and a relentless musical score matched only by Whitney’s relentless list of facts, the candidate, who is proud of being described as “one of the most conservative members of the Louisiana Legislature,” rebuts global warming alarmists point by scientific point before reminding voters of the thousands of hacked emails that proved the Climate Research Center of East Anglia “falsified data.”
The video closes with Whitney making a case for developing America’s energy resources and blasts global warming alarmists for using this hoax as a fear tactic to give the federal government control over every aspect of our lives.
--------
Protect the American People with a Moratorium on Coal Plant Closures
Institute for Energy Research
EXECUTIVE SUMMARY
Recent events in New England and elsewhere in the U.S. have demonstrated that policies which hurt the U.S. coal fleet are placing the reliability, affordability, and security of America’s electric supply system at risk:
* These policies will significantly increase wholesale electric rates and could increase them by as much as 80 percent according to Dr. Julio Friedmann, Assistant Secretary for Clean Coal at the U.S. Department of Energy (DOE).1
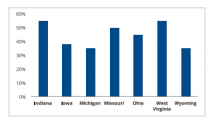
* The increases will be especially harmful in certain states such as Indiana, Iowa, Michigan, Missouri, Ohio, West Virginia, and Wyoming (Figure EX-1).
* Severe economic hardship will be imposed on people who can least afford it, low income families, minorities, children, and the elderly.
Therefore, policymakers, regulators, and electric utilities should institute an immediate moratorium on the premature closure of coal power plants and should reverse planned closures where possible.
Figure EX-1: Potential 2020 Electric Rate Increases From Coal Plant Closures
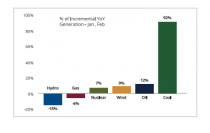
During the winter of 2014, coal was the only fuel with the ability to meet demand increases for electricity, providing 92 percent of incremental electricity in January/February, 2014 versus the same months in 20132 (Figure EX-2).
Figure EX-2: What Showed Up for Work During the Polar Vortex?2
During the winter of 2013 - 2014:
* Businesses in New England and other parts of the U.S. were curtailed because of a lack of gas infrastructure.
* Natural gas power plants also had a problem getting fuel due to infrastructure issues and at one point many of them had to go offline.
* Gas-based electricity prices increased 1,000 percent as coal and oil plants scheduled for closure picked up the load.
* Without coal, parts of New England, the Midwest, and other regions would have experienced brownouts and blackouts that would have been economically disastrous and would have compromised public health and safety; in many instances it could have been life threatening.
This past winter demonstrated in real time the value of the existing coal fleet. Americans were harmed as the relentless cold indicated that prudent utility practices require large, baseload coal plants to stabilize the grid, keep society functioning, and maintain electricity availability. Many regions suffered; for example, in late January and early February 2014 some locations in the Midwest experienced gas prices as high as $35/MMBtu, and the Chicago Citygate price exceeded $40/MMBtu (Figure EX-3).
Figure EX-3: Chicago Citygate Natural Gas Prices, February 2013/2014(Dollars per MMBtu)
Source: NGI nationalgasintel.com
Government policies that drive over-dependence on natural gas to replace baseload coal put the U.S. electric supply at risk and also endanger:
* The 60 million households who need gas for heating.
* A vast array of firms that use gas in daily operations.
Recent experience in New England and elsewhere represents a troubling indication of the implications of removing coal plants from the electricity generation mix:
* Spot prices of natural gas and electricity may spike significantly.
* Utility bills become unaffordable for many families during price spikes.
* Energy shortages could occur.
* What little industry is left in the Northeast may be forced to leave.
* Average electricity rates in New England are already more than 40 percent higher than the national average and may be headed to be 150 percent higher.
* New York’s electricity prices are now the second highest in the country, only the geographically isolated state of Hawaii has higher prices.
New England is merely the precursor to the national problem which is emerging.
With the projected closure of 60 gigawatts (GW) of coal plant capacity, virtually the entire U.S. is rapidly reaching the brink of significantly higher prices for electricity and being unable to meet either the summer or winter peak demand for power. Unless immediate steps are taken to halt coal plant closures:
* Within the decade entire regions (New England, Florida, California, the Southwest) may be at risk
* Vast areas of the American Heartland from the Southeast to the Plains could face the difficult choice of using gas for either electric power or meeting the heating needs of millions of families, businesses, and farms.
* Forecasts indicate that by 2020, natural gas capacity will exceed coal, nuclear, and hydro capacity combined, creating a lack of diversity of supply issue. The American Public Power Association has demonstrated the difficulties of replacing coal in electricity generation, and found that there must be continued reliance on America’s largest energy resource:
* The U.S. has by far the world’s largest coal supply, nearly 30 percent of the global total.
* Most existing coal-fueled power plants are less expensive than natural gas for electricity generation.
* The U.S. Energy Information Administration (EIA) forecasts that coal’s price advantage will continue and grow larger for the next three decades.
* U.S. coal used for electricity generation has increased 170 percent since 1970 as key emission rates (SO2, NOX, PM10) have been reduced by 90 percent.3 Greater use of advanced technologies will continue this progress.
* Advanced “supercritical” technology is highly efficient, and other state-of-the-art technologies result in a key emissions rate that is two-thirds lower than the existing fleet with carbon dioxide (CO2) emission rates as much as 25 percent lower than the oldest plants.4
Current policies are driving reduction of coal generation creating increased dependence on natural gas. However, activist groups and government officials have indicated their desire to reduce natural gas usage as well.
* Activist groups supporting the “Beyond Coal” campaign have initiated a “Beyond Natural Gas” campaign to oppose hydraulic fracturing.5
* Department of Energy Secretary Ernest Moniz contends that natural gas is “too carbon intensive” and must be phased out of electricity generation by 2050. 6
* White House Senior Counselor John Podesta has endorsed the phase-out of natural gas in the electric power sector beginning in 2020. 7
* Ronald Binz, recent nominee to chair the Federal Energy Regulatory Commission (FERC), said of gas: “On a carbon basis, you hit the wall in 2035 or so with gas. I mean, you do. And it’s certainly helping my state [Colorado]...but we also have to understand that without [carbon capture and storage], I think that’s a dead end, a relative dead end, it wouldn’t dead end until 2035 or so, but that’s when we’re going to have to do better on carbon than even natural gas can do.” 8
Current policies for electrical generation threaten the abundant, reliable and affordable electricity Americans have come to rely upon; they drive coal out as a source of electrical generation, creating heavy reliance on natural gas. In the next phase, natural gas will be driven out as well. This will affect natural gas availability for direct use and power, making electricity more expensive and scarce to Americans and hurting economic growth.
In sum, policies that erode the U.S. coal fleet are placing the reliability, affordability, and security of America’s electric supply system at risk. Prudence requires an immediate moratorium on coal power plant closures and planned closures should be reversed where possible.


_thumb.gif)


.gif)