Aug 22, 2012
Get Lost - My response to Michael Mann
By Rich Lowry, NRO
So, as you might have heard, Michael Mann of Climategate infamy is threatening to sue us.
Mann is upset - very, very upset - with this Mark Steyn Corner post, which had the temerity to call Mann’s hockey stick “fraudulent.” The Steyn post was mild compared with other things that have been said about the notorious hockey stick, and, in fact, it fell considerably short of an item about Mann published elsewhere that Steyn quoted in his post.
So why threaten to sue us? I rather suspect it is because the Steyn post was savagely witty and stung poor Michael.
Possessing not an ounce of Steyn’s wit or eloquence, poor Michael didn’t try to engage him in a debate. He sent a laughably threatening letter and proceeded to write pathetically lame chest-thumping posts on his Facebook page. (Is it too much to ask that world-renowned climate scientists spend less time on Facebook?)
All of this is transparent nonsense, as our letter of response outlines.
In common polemical usage, “fraudulent” doesn’t mean honest-to-goodness criminal fraud. It means intellectually bogus and wrong. I consider Mann’s prospective lawsuit fraudulent. Uh-oh. I guess he now has another reason to sue us.
Usually, you don’t welcome a nuisance lawsuit, because it’s a nuisance. It consumes time. It costs money. But this is a different matter in light of one word: discovery.
If Mann sues us, the materials we will need to mount a full defense will be extremely wide-ranging. So if he files a complaint, we will be doing more than fighting a nuisance lawsuit; we will be embarking on a journalistic project of great interest to us and our readers.
And this is where you come in. If Mann goes through with it, we’re probably going to call on you to help fund our legal fight and our investigation of Mann through discovery. If it gets that far, we may eventually even want to hire a dedicated reporter to comb through the materials and regularly post stories on Mann.
My advice to poor Michael is to go away and bother someone else. If he doesn’t have the good sense to do that, we look forward to teaching him a thing or two about the law and about how free debate works in a free country.
He’s going to go to great trouble and expense to embark on a losing cause that will expose more of his methods and maneuverings to the world. In short, he risks making an ass of himself. But that hasn’t stopped him before.
Rich Lowry is the editor of National Review.
Aug 19, 2012
Why doom has not materialized
By George F. Will, Published: August 18
ICECAP NOTE: Weatherbell.com now has underway the best model suite available anywhere. Dr Ryan Maue has joined Joe Bastardi and I blogging on Weatherbell and has created a super set of global model views that go way beyond what you find elsewhere. We have big plans to grow the set. If you buy your models elsewhere, you can do a lot better at much lower cost with Weatherbell. Also you will get to read the blogs of Joe Bastardi, Ryan Maue and Joe D’Aleo (a.k.a Dr. Dewpoint) on weather and climate issues. We each blog one or more times daily on weather and climate, hurricanes, severe weather threats and snowstorms, do videos and provide commercial forecasts for energy and agriculture, retail and industry. Here are two of my posts from this morning: Monsoon Mischief and Great Lakes Update - implications for the Winter.. But the models alone are worth the price of admission (less than a cup of coffee a day).
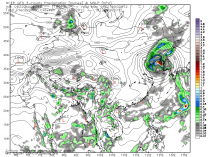
Typhoon approaching Korea (enlarged)
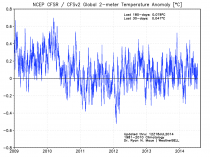
CFS global 2 meter anomaly graph
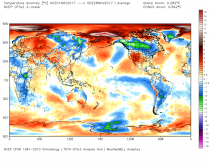
Month-to-date global anomaly
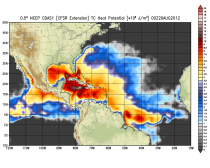
Tropical heat Content enlarged.
--------------
Sometimes the news is that something was not newsworthy. The United Nations’ Rio+20 conference - 50,000 participants from 188 nations - occurred in June without consequences. A generation has passed since the 1992 Earth Summit in Rio, which begat other conferences and protocols (e.g., Kyoto). And, by now, apocalypse fatigue - boredom from being
repeatedly told the end is nigh.
This began two generations ago, in 1972, when we were warned (by computer models developed at MIT) that we were doomed. We were supposed to be pretty much extinct by now, or at least miserable. We are neither. So, what went wrong?
That year begat “The Limits to Growth,” a book from the Club of Rome, which called itself “a project on the predicament of mankind.” It sold 12 million copies, staggered the New York Times ("one of the most important documents of our age") and argued that economic growth was doomed by intractable scarcities. Bjorn Lomborg, the Danish academic and “skeptical
environmentalist,” writing in Foreign Affairs, says it “helped send the world down a path of worrying obsessively about misguided remedies for minor problems while ignoring much greater concerns,” such as poverty, which only economic growth can ameliorate.
MIT’s models foresaw the collapse of civilization because of “nonrenewable resource depletion” and population growth. “In an age more innocent of and reverential toward computers,” Lomborg writes, “the reams of cool printouts gave the book’s argument an air of scientific authority and inevitability” that “seemed to banish any possibility of disagreement.”
Then - as now, regarding climate change - respect for science was said to require reverential suspension of skepticism about scientific hypotheses. Time magazine’s story about “The Limits to Growth” exemplified the media’s frisson of hysteria:
“The furnaces of Pittsburgh are cold; the assembly lines of Detroit are still. In Los Angeles, a few gaunt survivors of a plague desperately till freeway center strips. Fantastic? No, only grim
inevitability if society continues its present dedication to growth and ‘progress.’”
The modelers examined 19 commodities and said that 12 would be gone long before now - aluminum, copper, gold, lead, mercury, molybdenum, natural gas, oil, silver, tin, tungsten and zinc. Lomborg says:
Technological innovations have replaced mercury in batteries, dental fillings and thermometers; mercury consumption is down 98 percent, and its price was down 90 percent by 2000. Since 1970, when gold reserves were estimated at 10,980 tons, 81,410 tons have been mined, and estimated reserves are 51,000 tons. Since 1970, when known reserves of copper were
280 million tons, about 400 million tons have been produced globally, and reserves are estimated at almost 700 million tons. Aluminum consumption has increased 16-fold since 1950, the world has consumed four times the 1950 known reserves, and known reserves could sustain current consumption for 177 years. Potential U.S. gas resources have doubled in the past six years. And so on.
The modelers missed something - human ingenuity in discovering, extracting and innovating. Which did not just appear after 1972.
Aluminum, Lomborg writes, is one of earth’s most common metals. But until the 1886 invention of the Hall-Heroult process, it was so difficult and expensive to extract that “Napoleon III had bars of aluminum exhibited alongside the French crown jewels, and he gave his honored guests aluminum forks and spoons while lesser visitors had to make do with gold utensils.”
Forty years after “The Limits to Growth” imparted momentum to environmentalism, that impulse now is often reduced to children indoctrinated to “reduce, reuse, and recycle.” Lomborg calls recycling “a feel-good gesture that provides little environmental benefit at a significant cost.” He says that “we pay tribute to the pagan god of token environmentalism by spending countless hours sorting, storing and collecting used paper, which, when combined with government subsidies, yields slightly lower-quality paper in order to secure a resource” -
forests - “that was never threatened in the first place.”
In 1980, economist Julian Simon made a wager in the form of a complex futures contract. He bet Paul Ehrlich (whose 1968 book The Population Bomb” predicted that “hundreds of millions of people” would starve to death in the 1970s as population growth swamped agricultural production) that by 1990 the price of any five commodities Ehrlich and his advisers picked would be lower than in 1980. Ehrlich’s group picked five metals. All were cheaper in 1990.
The bet cost Ehrlich $576.07. But that year he was awarded a $345,000 MacArthur Foundation “genius” grant and half of the $240,000 Crafoord Prize for ecological virtue. One of Ehrlich’s advisers, John Holdren, is Barack Obama’s science adviser.
Read more here.
Aug 15, 2012
Hansen is Wrong
World Climate Report
In his recent press blitz, NASA’s James Hansen tries to tie extreme weather events, such the current drought affecting much of the central U.S., to anthropogenic global warming. But the real world argues otherwise.
Hansen is quite adept at timing global warming pronouncements with extreme weather events. Recall that it was during a similar hot, dry period back in the summer of 1988 that Hansen first testified to Congress that global warming from human greenhouse gas emissions was impacting current weather events- testimony which many credit as giving rise to the global-warming-is-going-to-be-bad movement. But then, as now, the tie-in between weather events and human changes to the atmospheric greenhouse effect is tenuous at best, and tie-ins to specific events are ill-supported and ill-advised. In the best case, the anthropogenic emissions-driven rise in global temperatures has a small ancillary impact on a specific extreme weather event, but in the vast majority of the cases, its role is nugatory and undetectable.
Such is the case with the impact of global warming on U.S. drought.
In his recent op-ed and article in the Proceedings of the National Academy of Sciences (recall that the peer review process at PNAS is more like watered down “pal review") Hansen clearly states that U.S. droughts are being enhanced by global warming.
Hansen has a lot of weight in his corner on this one, because the standard measure of drought - the Palmer Drought Severity Index (PDSI) - has temperature incorporated into its equation. The higher the temperature, the greater the potential evaporation term, and thus the tendency towards drier conditions. But (obviously) precipitation amount is also included in the calculation of the PDSI. More precipitation pushes the index away from drought conditions. So just because temperature is on the rise does not mean that droughts must become more frequent - changes in precipitation could intervene and counteract the influence of a temperature increase.
Across the U.S., over the past century or so, both temperature and precipitation have been on the upswing. Figure 1 shows that U.S. annual PDSI from 1895 through 2011. The more positive the PDSI values, the wetter conditions are, the more negative the PDSI values, the drier things are. There is no statistically significant trend over the 117 period of record, although the non-significant tendency is upwards (towards wetter conditions), evidence that the increase in precipitation is more than offsetting the impact from rising temperatures in the U.S.
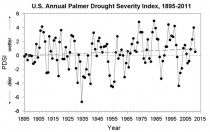
Figure 1. U.S. annual average palmer Drought Severity Index value, 1895-2011 (data source: National Climatic Data Center). (enlarged)
But what we are really after is not the impact of U.S. temperatures on U.S. drought, but, from Hansen’s assertion, the impact of global temperatures on U.S. drought.
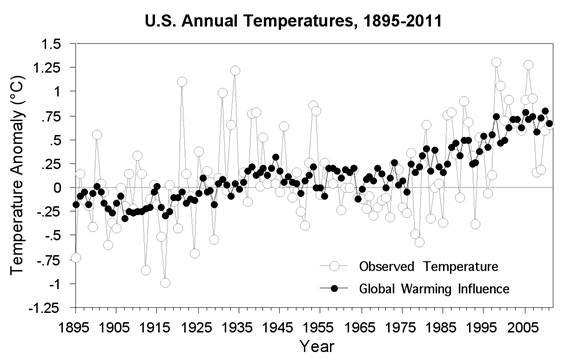
We can examine this by first assessing the influence of global temperatures on U.S. temperatures. By using a simple linear regression, we find that about one-third of the variability in U.S. temperatures is explained by global temperature variations. Figure 2 shows the observed annual U.S. temperatures from 1895 through 2011 and that part of them which is explained by global temperatures. Notice that global temperatures can capture the trend in U.S. temperatures, but little of the year to year variation. But hey, c’est la vie-as we have stressed for years, local and regional conditions largely march to a tune that is different than the one being drummed by global average conditions.

Figure 2. The observed annual U.S. temperatures from 1895 through 2011 (light gray) and that part of them which is explained by global temperatures (black). Global temperatures explain about 33% of the variance in U.S. temperaures (temperature data source: Goddard Institute for Space Studies). (enlarged)
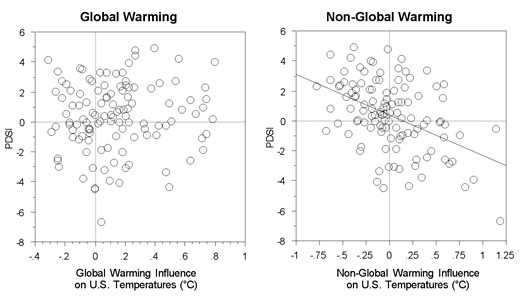
In order to see how much of the global temperature signal that is present in the U.S. PDSI history, we can regress that part of the U.S. temperature record that is related to global temperatures (the inner (black) curve in Figure 2) with the U.S. PDSI history (Figure 1). No significant relationship emerges from this analysis (the explained variance between the global signal in the U.S. temperature record and the U.S. PDSI history is less than 1%) (Figure 3, left).
In other words, global warming does not influence U.S. drought.
Now, let’s take a look at how much of the U.S. drought record is related to the non-global warming part of the U.S. temperature record. Doing this analysis, we find the influence to be a statistically significant 20% (Figure 3, right). The other 80% likely has to do with various and sundry influences on precipitation variability.

Figure 3. (left) Scattergram of U.S. annual PDSI values and the global warming influence on U.S. average annual temperatures, 1895-2011. (right) Scattergram of U.S. annual PDSI values and the non-global warming influence on U.S. average annual temperatures, 1895-2011.(enlarged)
The bottom line result here is that the influence of temperature on the U.S. PDSI (drought) history is one that is being driven by natural variability not global warming.
In other words, the situation is as it always has been. And the 2012 drought conditions, and every other drought that has come before, is the result of natural processes, not human greenhouse gases emissions.
Simply put, Jim Hansen is wrong.
Aug 09, 2012
July was hot but NOT the hottest month ever and you can blame the AMO and La Nina not CO2
NOAA announced July was the warmest month ever for the contiquous US (lower 48) even though global temperature anomalies is actually fell almost a tenth of a degree according to satellites. Of course the media alarmists and liberal senate loons like Reid, Sanders and Kerry jumped on it, the causes were natural and the records were only there because NOAA has been lncentivized to jigger the data to support the green agenda.
See two important posts that show you why though it was a hot July thanks to a drought produced by the second strongest La Nina since 1900 and the warm Atlantic Multidecadal Oscillation which produced the heat and drought years of the 1930s, 1950s, 1990s. it was not the hottest month. Steve Goddard on Real Science here and Watts up with That here.
I also post Dr. Roy Spencer’s analysis below.
July 2012 Hottest Ever in the U.S.? Hmmm...I Doubt It
August 8th, 2012 by Roy W. Spencer, Ph. D.
Using NCDC’s own data (USHCN, Version 2), and computing area averages for the last 100 years of Julys over the 48 contiguous states, here’s what I get for the daily High temps, Low temps, and daily Averages (click for large version):
Enlarged
As far as daily HIGH temperatures go, 1936 was the clear winner. But because daily LOW temperatures have risen so much, the daily AVERAGE July temperature in 2012 barely edged out 1936.

Enlarged
Now, of course, we have that nagging issue of just how much urban heat island (UHI) effect remains in the data. The NCDC “homogenization” procedures are not really meant to handle long-term UHI warming, which has probably occurred at most of the 1218 stations used in the above plot.
Also, minimum temperatures are much more influenced by wind conditions and other factors near the surface
Max temperatures give a much better idea of how warm an air mass is over a deep layer.’
Also, I thought one month doesn’t make a climate trend? If we look at the 5-year running mean of the daily averages for July’s over the last 100 years, we see that while recent Julys have indeed been warm, it is questionable whether they rival the 1930s:
Enlarged
And if we do the same 5-year averaging on July maximum temperatures, the 1930s were obviously warmer:
Enlarged
So, all things considered (including unresolved issues about urban heat island effects and other large corrections made to the USHCN data), I would say July was unusually warm. But the long-term integrity of the USHCN dataset depends upon so many uncertain factors, I would say it’s a stretch to to call July 2012 a “record”.
---------------
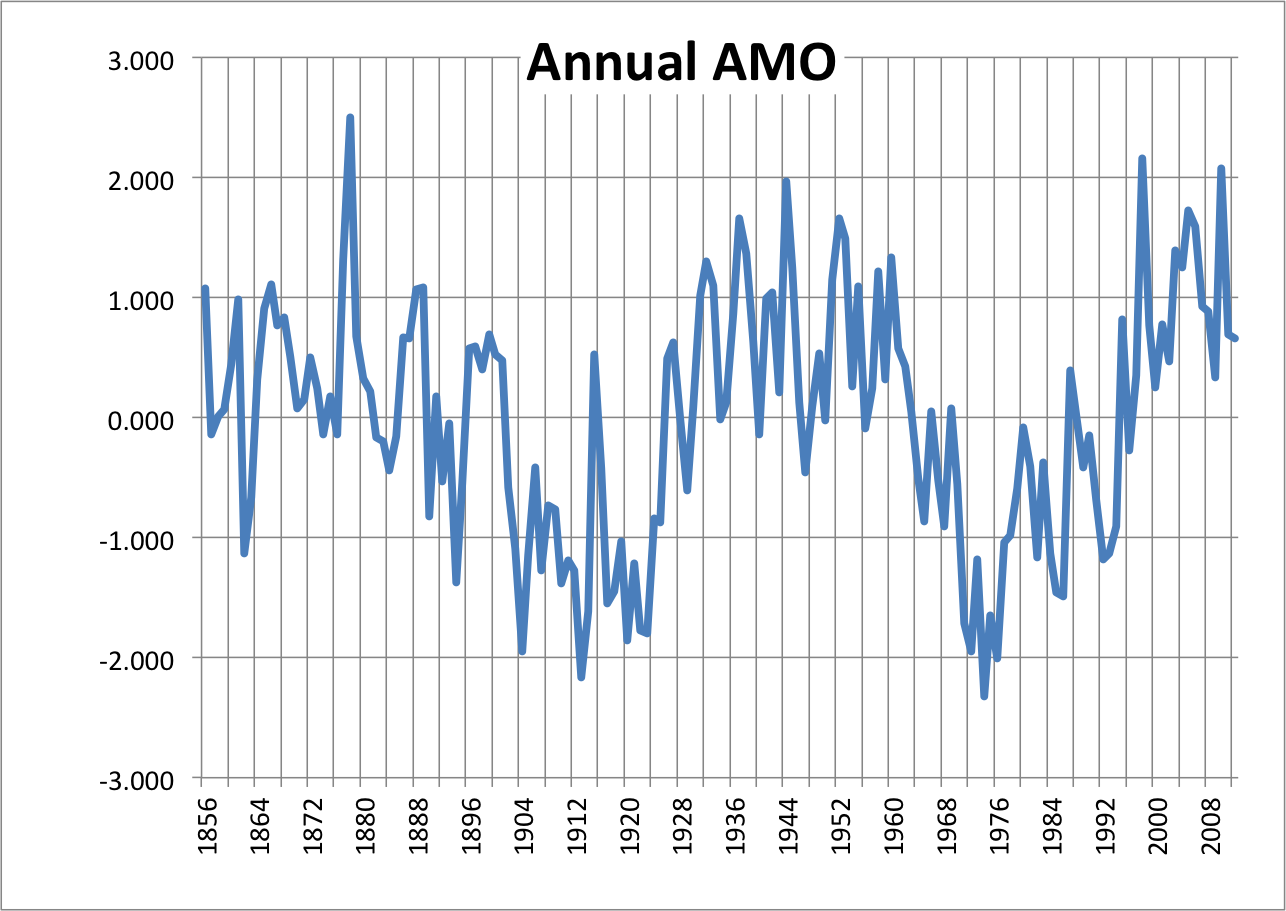
See how the Atlantic returned to the warm mode it was in during the 1930s to 1950s when hot summers were the rule.
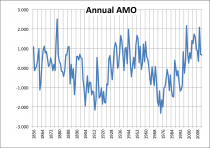
Enlarged
See the correlation of global temperatures with the warm AMO. Note how the Northern Hemisphere continents is where the warmth is focused.
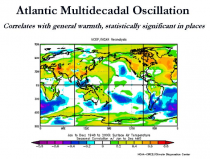
Enlarged
AMO predisposes the northern continents to warmth and El Nino and La Ninas determine where the heat will focus. The second strongest La Nina in the record in 2010/11, led to record heat and drought in 2011 in Texas which spread northwards during the warm 2011/12 La Nina winter and spring. It is what supercharged the heat much as the same scenario as in the 1930s and 1950s, both decades of multi year drought. Dry ground adds 10F or more to the daily maximum temperatures, especially if vegetation is desiccated.
Aug 05, 2012
Weather Channel continues its decline chasing CNN - announces 6 hourly features on “tipping points’
The Weather Channel Travels to the Far Corners of the Earth to Explore the World’s “Tipping Points”
New global production to premiere October 2013
August 03, 2012 11:09 AM Eastern Daylight Time
LOS ANGELES - (BUSINESS WIRE) -The Weather Channel Companies announced today that it is the U.S. partner on the global production of “Tipping Points,” a landmark TV series that will explore the emerging tipping points of our changing climate system that have recently drawn concern from scientific communities worldwide for their fragile and near-crisis state. The groundbreaking docu-series will follow a group of pre-eminent scientists as they venture off the grid to explore the perilous tipping points making our weather systems more extreme and unpredictable. Produced by Unboxed Media, “Tipping Points” premieres in October 2013 and will feature 6x 60min. episodes on The Weather Channel, as well as additional content across weather.com, mobile, tablet and social media platforms.
“We believe this is one of the most important series being produced today, and The Weather Channel is in the unique position to be an authority on changes in climate and weather” 
The series will explore the global impact of our changing climate system, how climate and human populations interconnect and the profound impact they have on each other. Scientists will explore the elements destabilizing our climate system and how changes in a remote area can - and do - dramatically impact those on other continents, thousands of miles away.
The phenomena of “tipping points” follows the concept that, at a particular moment in time, a small change can have a large, long-term consequence on a fragile climate system already in a state of flux. Localized ecological systems are known to shift abruptly and irreversibly from one state to another when they are forced across critical thresholds. Further, when the situation is pushed past the “tipping point,” it will potentially lead to a chain reaction, putting other ecosystems around the globe in peril.
“Tipping Points” will feature several of the most critical examples, including the collapse of the Greenland ice sheet, total melting of the Himalayan icecap glaciers, dieback of the Amazon rainforest, shutdown of the Atlantic thermohaline circulation, and the rapid melt of the Permafrost in Siberia.
“We believe this is one of the most important series being produced today, and The Weather Channel is in the unique position to be an authority on changes in climate and weather,” said Michael Dingley, senior vice president, content and development, The Weather Channel Companies. “‘Tipping Points’ will not only show how our changing climate system affect local communities in exotic and distant locales like the Amazon or Siberia, but how it impacts and is relevant to people even right here in the U.S., be it Portland, Maine or Portland, Oregon and every community in between. We need to explore and understand what can be done to stem the tide of change before we do irreparable damage, and ultimately put our own lives at risk.”
The series is hosted by polar explorer and climate journalist Bernice Notenboom, who will be joined by a number of leading international environmental scientists in each episode such as Torben Christensen, Peter Cox, Dorthe Dahl-Jensen, Matthew England, James Hansen, Tim Lenton, Yadvinder Malhi, Konrad Steffen, Katey Walker, Jay Zwally, and more. Stu Ostro, senior meteorologist for The Weather Channel, will serve as contributing science editor on the project.
The Weather Channel owns the U.S. rights as the sole U.S. network to air the series. The global partnership includes international networks NHK Japan, ARD Group Germany, Canvas Belgium, VPRO Holland, and The Australia Network.
“Tipping Points” is the latest to join The Weather Channel’s growing original content slate, which includes “Coast Guard Alaska,” “Iron Men.” “Lifeguard!,” “Ice Pilots,” “Hurricane Hunters,” “Hawaii Air Rescue” (Sept. 5), and “Coast Guard Florida"(Oct. 10), as well as the “Braving the Elements” docu-series anthology, which includes “Turbine Cowboys,” Pyros,” “Iceberg Hunters” (Sept. 18), and “Reefmakers” (Oct. 9).
or images of “Tipping Points”: http://press.weather.com/image-gallery/tipping-points/
About The Weather Channel Companies
The Weather Channel companies (TWCC) are made up of The Weather Channel television network, The Weather Channel digital properties, WSI, and Weather Underground. The Weather Channel is based in Atlanta and is seen in more than 100 million U.S. households. TWCC also operates Weatherscan, a 24hour all-local weather network; The Weather Channel Radio Network; and The Weather Channel HD. The most popular source of weather news and information, TWCC properties reach 60 million monthly Web consumers (weather.com and Desktop) and 30 million monthly mobile users (mobile Web and applications) and offers the second most popular mobile app on all smartphones. WSI, headquartered in Andover, MA, primarily provides business-to-business weather services, particularly for the media, aviation, marine and energy sectors. Online weather service Weather Underground is based in Ann Arbor, MI, and San Francisco, and has developed the world’s largest network of personal weather stations. TWCC is owned by a consortium made up of NBC Universal and the private equity firms The Blackstone Group and Bain Capital. For more information, visit www.weather.com/press.
Contacts
The Weather Channel
Maureen Marshall, 248-504-9507 (Cell)
Office: 212-856-5277
msmarshall@weather.com
Press Site: www.weather.com/press
Twitter: @TWC_PRteam
The list of topics and so called experts are laughable. The original founders of The Weather Channel (100+) met for a 30th anniversary reunion in Atlanta in April. There will be no weather channel around for the 40th given their direction. Be sure to let them know what you think of their idea.
|

