Apr 21, 2013
New data falsifies basis of man-made global warming alarm, shows water vapor feedback is negative
No tricks Zone
Physicist Clive Best has analyzed the latest NASA satellite and radiosonde data to find that global water vapor has declined despite the consensus belief among climate scientists that it would rise in response to man-made carbon dioxide. Dire predictions of global warming all rely on positive feedback from water vapor. The argument goes that as surface temperatures rise so more water will evaporate from the oceans thereby amplifying temperatures because H2O itself is a strong greenhouse gas. The fact that water vapor has instead declined indicates water vapor feedback is negative, overwhelming alleged warming from CO2, and accounting for the stall in global temperatures over the past 16+ years. As Dr. Best notes, “All climate models (that I am aware of) predict exactly the opposite. Something is clearly amiss with theory. Is it not now time for “consensus” scientists to have a rethink?”
Prior posts on negative feedback from water vapor
H2O decreasing while CO2 rises !
Reblogged from Clive Best by Clive Best [emphasis added]:
Dire predictions of global warming all rely on positive feedback from water vapor. The argument goes that as surface temperatures rise so more water will evaporate from the oceans thereby amplifying temperatures because H2O itself is a strong greenhouse gas. Climate models all assume net amplification factors of between 1.5 and 6. Has the water content of the atmosphere actually been increasing as predicted?
NASA have just released their latest NVAP-M survey of global water content derived from satellite data and radio-sondes over the period from 1988 to 2009. This new data is explicitly intended for climate studies . So lets take a look at the comparison between actual NVAP-M atmospheric H2O levels and those of CO2 as measured at Mauna Loa. I have extracted all the daily measurement NVAP-M data and then calculated the global average. Figure 1 shows the running 30 day average of all the daily data recorde between 1988 and 2009 inclusive. The 365 day (yearly) running average is also shown. Plotted on the right hand scale are the Mauna Loa CO2 concentration data in red over the same period.
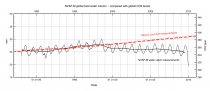
Fig1: Total precipitative H2O (running 30 day average) compared to Mauna Loa CO2 data in red. The central black curve is a running 365 day average.
There is indeed some correlation in the data from 1988 until 1998, but thereafter the two trends diverge dramatically. Total atmospheric water content actually falls despite a relentless slow rise in CO2. This fall in atmospheric H2O also coincides with the observed stalling of global temperatures for the last 16 years. All climate models (that I am aware of} predict exactly the opposite. Something is clearly amiss with theory. Is it not now time for “consensus” scientists to have a rethink?
Apr 16, 2013
The Second-string ‘Hockey Team’
Dr. Gordon Fulks
The ongoing battle over Global Warming with Western Washington University geology professors has been fascinating for what it reveals about second tier supporters of the apocalypse who have backgrounds in science but not in climate science. These are not the knowledgeable first string players on the ‘Hockey Team,’ working together to manipulate climate data and keep opponents from challenging them in the scientific journals, as Climategate revealed. There are no Michael Manns, no Phil Jones, no Gavin Schmidts, and no James Hansens here. These are the Inspector Clouseaus of the climate clique, the suave but hopeless practitioners of bumbling politicized science.
What distinguishes them from the Great Global Warming Guru James Hansen? The most obvious thing about Hansen is that he can discuss a wide range of topics related to Global Warming and display considerable scientific insight. He does not resort to popular political tactics based on consensus, authority, or belief.
For instance, he and I agree about the lack of global warming for more than a decade, about Milankovitch cycles, nuclear power, and radiation safety. He even uses a temperature reconstruction of this Holocene interglacial period similar to what I prefer. It shows the gradual average temperature decline over the last few thousand years as we sink toward the next ice age. We also agree that ethanol based motor fuel is a carbon reduction scam that needs to be abandoned. I chuckled with him about the difficulties he must face coming from Iowa where government-subsidized corn ethanol is very popular among those making money from it.
Had we gotten into a detailed discussion of carbon dioxide, we would have disagreed substantially. But that would have involved questions of ‘climate sensitivity’ where he is completely aware of the need to invoke an amplification from water vapor, because CO2 alone lacks sufficient horsepower. Perhaps it was the wine or the fact that we are both astrophysicists that kept things constructive. Clearly, neither of us wanted to fall into the black hole of scientific nonsense, even though our disagreements about a climate catastrophe are profound.
The Professor Clouseaus from WWU are a world apart. Gone is the congenial atmosphere and discussion among colleagues where the objective is to find common ground before addressing difficult questions. These professors are going for a knockout blow against ‘deniers’ whom they equate with cranks. Emeritus Professor of Geology Don Easterbrook was their lone crank, until I came along. Then there were two! When I pointed out that many well-known physicists have views similar to mine, they supposed that physicists do not understand the complexities of climate, as they do. “FINE,” I said, “Show me!” “Let’s have a seminar at WWU.” That precipitated panic and retreat with a helpful twist. One professor admitted to an insufficient knowledge of climate science to argue with me.
But just as one blunder after another never discouraged Peter Sellers in the Pink Panther, Professor Clouseau (played in this case by Dave Hirsch) was sure that ‘consensus’ is the way we properly do things in science. Oh, really?
The geological establishment has been famous for clinging to the majority opinion even when it is no longer scientifically viable and consequently being wrong time after time. One prominent example involves J. Harlen Bretz, once a high school biology teacher from Seattle, who proposed that the unusual geology of Eastern Washington was caused by catastrophic floods from an ice age lake in Montana and not by gradual erosion over millions of years. He spectacularly prevailed over the ‘consensus’ with convincing logic and evidence. Similarly, the concept of ‘continental drift’ overcame stiff establishment resistance to become the present paradigm.
In 1905 a little Jewish man who was but a clerk in a patent office challenged the perception that Classical Physics was ‘settled.’ He recognized that the two hundred year old theory of Newtonian Mechanics had to be significantly modified to keep Maxwell’s equations unchanged in a moving frame. Although popular opinion quickly embraced Albert Einstein, he was content to wait decades for the necessary physical evidence to back up his new concepts of space, time, and gravity. To no surprise, Einstein understood how science works.
The Professor Clouseaus at WWU fall flat with their attempts to short circuit the scientific method using ‘consensus.’ If they want to legitimately participate in climate discussions, they should learn something about this topic and discuss it with their peers, including physicists. Although many scientists seek assistance in understanding complex topics by consulting the most informed among us (like Don Easterbrook), the bottom line still comes down to the best ‘logic and evidence.’ All else is a sideshow.
Gordon J. Fulks has no conflicts of interest on Global Warming, lives near Portland, Oregon, and can be reached at gordonfulks@hotmail.com. He holds a doctorate in physics from the University of Chicago, Laboratory for Astrophysics and Space Research.
Apr 14, 2013
Data versus dogma and character assassination
By Dr. Don Easterbrook
An interesting contrast in the manner of debating climate issues arose as a result of my testimony before a Washington State Senate hearing March 16, 2013. The hearing concerned a senate bill based on five very badly flawed assertions, and I was invited to present scientific evidence related to the basis of the bill. I began my testimony with the famous quote “In God we trust, all others bring data” and then presented graphical data that can be viewed here.
The five assertions that formed the basis for the bill were:
1. Emissions of greenhouse gases from human activities is the principal cause of global warming.
2. Sea level is rising at an increasing rate because of global warming.
3. The frequency of severe storms is increasing because of global warming.
4. Mountain winter snow packs and streamflows are diminishing because of global warming.
5. Ocean acidification is occurring because of global warming.
The graphic data and physical evidence for rejecting these assertions may be found in the video above.
Almost immediately upon completion of my testimony, the chairman of the geology dept. at Western Washington University, Bernie Housen, who has never published a single paper on climate and who knows nothing about any of the climate topics I discussed, issued a statement to the AP wire service that I was neither an expert in my field nor active in my field. The following Sunday, March 31, 12 members of the geology department at WWU, none of whom have ever published a single paper on climate and who have no climate expertise, published a vicious personal character assassination against me in the Bellingham Herald.
They claimed that (1) my work is “filled with misrepresentations, misuse of data,” (2) every graph I showed was flawed, (3) none of my 180 publications had been peer reviewed, (4) my evidence was “not supported by any published science,” (5) my views “require the existence of a broad, decades-long conspiracy amongst literally thousands of scientists to falsify data, and (6) they “decry the injection of such poor quality science into the public discourse.”
Needless to say, they didn’t address any of the issues that I discussed in the Senate hearing. You can read their op-ed online at the Bellingham Herald website
Here is my response, published in the Bellingham Herald:
“WWU faculty find overwhelming scientific evidence to support global warming.” Of course there is overwhelming evidence of global warming! Everyone agrees!
But that doesn’t prove it was caused by carbon dioxide! The authors fail to understand:
(1) Of the two periods of global warming this century, the first, and warmest, occurred before rise in carbon dioxide; (2) Twenty periods of global warming occurred over the past five centuries; (3) The past 10,000 years were warmer than present; and (4) Multiple periods of intense warming (20 times more intense than recent warming) occurred 10,000-to-15,000 years ago. All of these happened long before rise in carbon dioxide, so could not possibly have been caused by carbon dioxide.
The Bellingham Herald opinion column is a diatribe against me personally (just read the slurs and innuendos) containing misrepresentations, no real data to support their contentions, and displays an abysmal ignorance of published literature. The reason becomes apparent when you realize that not a single one of the 13 Western Washington University authors has ever published a single paper on global climate change and none have any expertise whatsoever in climate issues.
Their claim that my publications “have not passed through rigorous peer review” is false. Virtually all of my 180 publications were peer-reviewed. The real joke here is they “fully support the 2007 IPCC report,” but Donna Laframboise in 2011 documented that 30 percent of the references used were not peer-reviewed, so using their own standard, they would be forced to reject the 2007 Intergovernmental Panel on Climate Change report!
The authors claim that “CO2 is a powerful greenhouse gas” that has “significant and measureable impact on surface temperature.” Carbon dioxide is a greenhouse gas, but it has little impact on temperature because it makes up only 0.038 percent of the atmosphere, has changed only 0.008 percent since carbon dioxide rose after 1945 (if you double nothing, you still have nothing), and accounts for only 3.6 percent of greenhouse warming. Carbon dioxide is incapable of changing global temperature by more than a fraction of a degree.
The authors “decry the injection of such poor quality science into the public discourse.” I work with 20 of the world’s top scientists, including atmospheric physicists, astrophysicists, geologists, and marine geophysicists who wouldn’t waste time working with me if my research was “of poor quality.”
The authors claim that my work requires “broad, decades-long conspiracy...to falsify climate data.”
In 1999, NASA data showed the 1930s were the hottest decade of the century and 1936 the hottest year. In 2012, NASA subtracted temperatures from the 1930s data and added to recent temperatures to claim that recent years were “unprecedented and the warmest ever recorded.” Check NASA data tampering here. This lies behind all of the false claims that recent global warming is “unprecedented.”
The authors claim a “vast consensus of the science community.” However, 31,487 U.S. scientists (including 9,000 with doctorates) with degrees in atmospheric, Earth sciences, physics, chemistry, biology and computer science have signed a statement that reads: “There is no convincing scientific evidence that human release of carbon dioxide, methane, or other greenhouse gases is causing, or will in the foreseeable future, cause catastrophic heating of the Earth’s atmosphere and disruption of the Earth’s climate.” Check names and expertise here. Signatures of 1.5 million scientists would be required to achieve the claimed “vast consensus” of scientists!
The Intergovernmental Panel on Climate Change chairman admitted that 80 percent of the people involved in the panel were not even scientists!
The WWU faculty was challenged to debate the issues. The response from David Hirsh was: “I don’t want the media to present both sides of an issue.” “Well, the problem is it’s not ‘my’ science. I do not now, nor have I claimed to be an expert in climate science. The question was would I support a debate-type forum to be hosted at WWU? I would not.” He went on to say that he didn’t want to debate because he had not addressed any of the scientific issues, but supported the personal attack.
So what can we conclude about The Bellingham Herald opinion column? Perhaps more than anything it shows that amateurs with no expertise in climate issues are way out of their league and would be wiser to stick to their own areas of expertise, hard rock geology. In the end, nature will tell us who is right and that is happening right now as the climate continues to cool with no warming in 15 years.
ABOUT THE AUTHOR
Don Easterbrook, a professor emeritus of geology at Western Washington University. For more information about him, go online to myweb.wwu.edu/dbunny.
Apr 11, 2013
NOAA Scientist Rejects Global Warming Link to Tornadoes
By James Rosen
A top official at the National Oceanic and Atmospheric Administration (NOAA) rejected claims by environmental activists that the outbreak of tornadoes ravaging the American South is related to climate change brought on by global warming.
Greg Carbin, the warning coordination meteorologist at NOAA’s Storm Prediction Center in Norman, Oklahoma, said warming trends do create more of the fuel that tornadoes require, such as moisture, but that they also deprive tornadoes of another essential ingredient: wind shear.
“We know we have a warming going on,” Carbin told Fox News in an interview Thursday, but added: “There really is no scientific consensus or connection [between global warming and tornadic activity....Jumping from a large-scale event like global warming to relatively small-scale events like tornadoes is a huge leap across a variety of scales.”
Asked if climate change should be “acquitted” in a jury trial where it stood charged with responsibility for tornadoes, Carbin replied: “I would say that is the right verdict, yes.+ Because there is no direct connection as yet established between the two? “That’s correct,” Carbin replied.
Formerly the lead forecaster for NOAA’s Storm Prediction Center, Carbin is a member of numerous relevant professional societies, including the National Weather Association, the American Meteorological Society, the Union of Concerned Scientists, and the International Association of Emergency Managers. He has also served on the peer review committee for the evaluation of scientific papers submitted to publications like National Weather Digest and Weather and Forecasting.
This evaluation by a top NOAA official contradicted pronouncements by some leading global warming activists, who were swift to link 2011’s carnage to man-made climate change.
“The earth is warming. Carbon emissions are increasing,” said Sarene Marshall, Managing Director for The Nature Conservancy’s Global Climate Change Advocacy Team. “And they both are connected to the increased intensity and severity of storms that we both are witnessing today, and are going to see more of in the coming decades.:”
Bjorn Lomborg of the Copenhagen Consensus Center, an activist and author who believes industrialized societies expend too much money and energy combating global warming, instead of focusing on more immediate, and easily rectifiable, problems, doubted the tornadoes have any link to warming trends.
“We’ve seen a declining level of the severe tornadoes over the last half century in the U.S.,” Lomborg told Fox News."So we need to be very careful not just to jump to the conclusion and say, “Oh, then it’s because of global warming.“‘
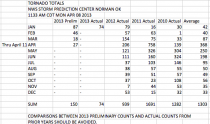
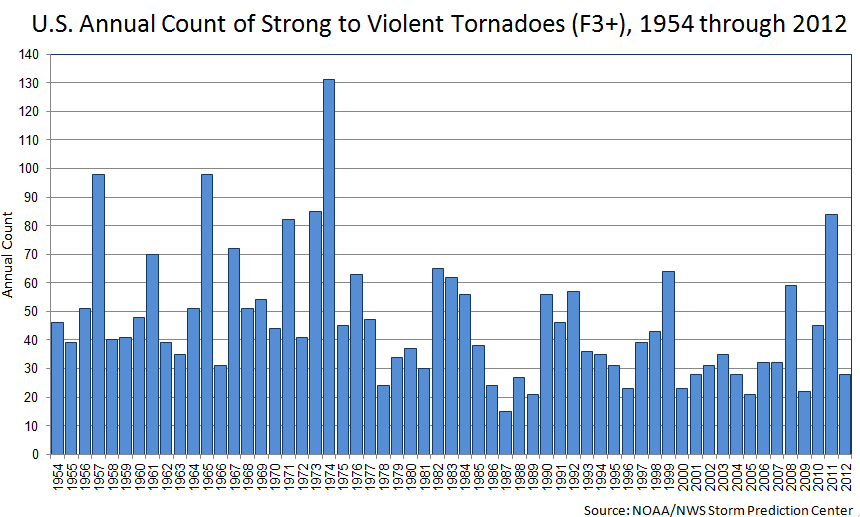
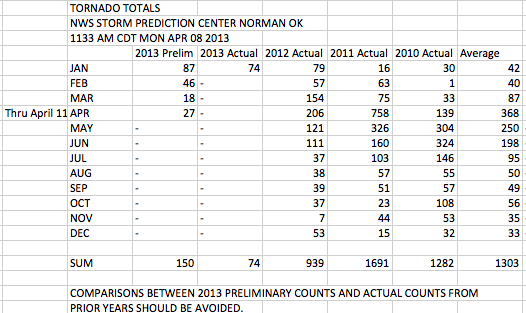
In fact, NOAA statistics show that the last 60 years have seen a dramatic increase in the reporting of weak tornadoes, but no change in the number of severe to violent ones.

Enlarged
For many, the high casualties of 2011 recalled the so-called “Super Outbreak” of April 1974, which killed more than 300 people. “You have to go back to 1974 to even see a tornado outbreak that approaches what we saw yesterday,” W. Craig Fugate, administrator of the Federal Emergency Management Agency (FEMA), told Fox News.
Asked earlier, during a conference call with Alabama Gov. Robert Bentley about the possibility that climate change is playing a role in the tornado outbreak, Fugate shot back: “Actually, what we’re seeing is springtime. Unfortunately, many people think of the Oklahoma tornado alley and forget that the Southeast U.S. actually has a history of longer and more powerful tornadoes that stay on the ground longer—and we are seeing that, obviously, in 2011”
The activity this week with 21 tornadoes was caused like in 2011 by very strong contrast with unseasonable cold and snow north and warmth south. This season is unlikely to be as severe as 2011 when we were coming off the second strongest La Nina with a powerful La Nina jet stream. It will be more active than 2012, a very warm spring with little contrast and very few tornadoes.
Enlarged
Apr 05, 2013
Matt Ridleys diary: My undiscovered island, and the Met Office’s computer problem
Matt Ridley, the Spectator
We’ve discovered that we own an island. But dreams of independence and tax-havenry evaporate when we try to picnic there on Easter Sunday: we watch it submerge slowly beneath the incoming tide. It’s a barnacle-encrusted rock, about the size of a tennis court, just off the beach at Cambois, north of Blyth, which for some reason ended up belonging to my ancestor rather than the Crown. Now there’s a plan for a subsidy-fired biomass power station nearby that will burn wood (and money) while pretending to save the planet. The outlet pipes will go under our rock and we are due modest compensation. As usual, it’s us landowners who benefit from renewable energy while working people bear the cost: up the coast are the chimneys of the country’s largest aluminium smelter killed, along with hundreds of jobs, by the government’s unilateral carbon-floor price in force from this week.
_thumb.png)
Weatherbell.com Year-to-Date Anomaly
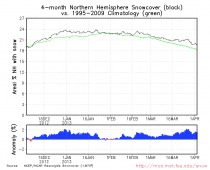
FSU’s D.r Bob Hart Daily Snow Anomalies for the Northern Hemisphere
There were dead puffins on the beach, as there have been all along the east coast. This cold spring has hit them hard. Some puffin colonies have been doing badly in recent years, after booming in the 1990s, but contrary to the predictions of global warming, it’s not the more southerly colonies that have suffered most. The same is true of guillemots, kittiwakes and sandwich terns: northern colonies are declining.
It’s not just here that the cold has been relentless. Germany’s average temperature for March was below zero. Norwegian farmers cannot plant vegetables because the ground’s frozen three feet down. In America snow fell as far south as Oklahoma last week. It’s horrible for farmers. But in past centuries, bad weather like that of the past 12 months would kill. In the 1690s, two million French people starved because of bad harvests. I’ve never understood why people argue that globalisation makes for a more fragile system: the opposite is the case. Harvest failures can be regional, but never global, so world trade ensures that we have the insurance policy of access to somebody else’s bumper harvest.
Gloriously, the poor old Met Office got it wrong yet again. In December it said: ‘For February and March… above-average UK-mean temperatures become more likely.’ This time last year it said the forecast ‘slightly favours drier-than-average conditions for April May June, and slightly favors April being the driest of the three months’ before the wettest of all Aprils. The Met Office does a great job of short-term forecasting, but the people who do that job must be fed up with the reputational damage from a computer that’s been taught to believe in rapid global warming. In September 2008 it foretold a ‘milder than average’ winter, before the coldest winter in a decade. The next year it said ‘the trend to milder and wetter winters is expected to continue’ before the coldest winter for 30 years. The next year it saw a ‘60 per cent to 80 per cent chance of warmer-than-average temperatures this winter’ before the coldest December since records began. ICECAP NOTE: Pierre Gosselin has compiled 57 failed winter forecasts by warmists among hundreds.
At least somebody’s happy about the cold. Gary Lydiate runs one of Northumberland’s export success stories, Kilfrost, which manufactures 60 per cent of Europe’s and a big chunk of the world’s aircraft de-icing fluid, so he puts his money where his mouth is, deciding how much fluid to send to various airports each winter. Back in January, when I bumped into him in a restaurant, he was beaming: ‘Joe says this cold weather’s going to last three months,’ he said. Joe is Joe Bastardi, a private weather forecaster, who does not let global warming cloud his judgment. Based on jetstreams, El Ninos and ocean oscillations, Bastardi said the winter of 2011/12 would be cold only in eastern Europe, which it was, but the winter of 2012/13 would be cold in western Europe too, which it was. He’s now predicting ‘warming by mid month’ of April for the UK.
David Rose of the Mail on Sunday was vilified for saying that there’s been no global warming for about 16 years, but even the head of the Intergovernmental Panel on Climate Change now admits he’s right. Rose is also excoriated for drawing attention to papers which find that climate sensitivity to carbon dioxide is much lower than thought - as was I when I made the same point in the Wall Street Journal. Yet even the Economist has now conceded this. Tip your hat to Patrick Michaels, then of the University of Virginia, who together with three colleagues published a carefully argued estimate of climate sensitivity in 2002. For having the temerity to say they thought ‘21st-century warming will be modest’, Michaels was ostracised. A campaign began behind the scenes to fire the editor of the journal that published the paper, Chris de Freitas. Yet Michaels’s central estimate of climate sensitivity agrees well with recent studies. Scientists can behave remarkably like priests at times.
Joe Bastardi, Ryan Maue and I work together at Weatherbell Analytics. Weatherbell also predicted the turn to colder in the US this late winter and has hit every major snowstorm, tornado outbreak, and hurricane landfall since its inception in 2011. We offer a blog service for enthusiasts as well as specialized services to commercial markets internationally like Killfrost and many of the better more successful and forward thinking hedge (energy and ag) funds, snow clients, insurance and other weather sensitive industries. Ryan has developed a very impressive value added model and data section available to all premium and commercial clients. Go to weatherbell.com.
|

