Feb 14, 2014
AGW movement collapsing - cooling December/January now for 20 years!
Typical of the green movement and the administration - they gravitate to the convenient extremes that can be expected almost every year somewhere.
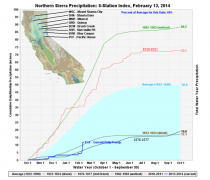
This year the snow and cold in the east and central is reaching top ten or even worst ever levels. To do a press conference in one of these regions might lead to snow balls and laughter. So they head to eco friendly California. See how the Sierra snowpack is almost as bad as 1976/77 and 1923/24. But that means it happened before (when the Pacific was in the cold PDO La Nina modes) and in the past said to be multi year.
In 2010/11, very heavy mountains snows brought nearly record snowmelt and skiing that continued into the summer. In 2010/11 near record snowpack filled up reservoirs but the state and federal government did not take advantage of the water to use when the inevitable dry year followed. But the blame gets shifted to carbon dioxide not incompetent bureaucrats. With a push from environmentalists, a judge years ago shut off most of the water for farmers to “save” the Delta smelt, a non-native sardine that took over the Sacramento-San Joaquin River Delta after somebody dropped some bait fish. AS SEPP reports, California has an under-appreciated engineering marvel in its complex system of capturing storm and spring runoff to prevent flooding and storing the water for irrigation and drinking water in the more arid regions of the state. The system was designed to withstand multi-year droughts of about 5 years. It worked well. Water from wet years was used for dry years.
Unfortunately, Green politicians and environmental organizations could not keep their hands off a system that works well. They have caused much of the water needed for dry years to be diverted into the San Francisco Bay and the ocean, apparently to protect fish such as the delta smelt. Now, California is suffering from two years of drought. Orchards have dried up, and unemployment in many of the agricultural regions, such as the San Joaquin Valley, is very high. Green politicians and environmental groups are witnessing the destructive consequences of their actions. Of course, they are blaming climate change - though more severe droughts have occurred in the past.
The Republican-controlled House recently voted to address the drought by rolling back environmental protections so farmers would have water diverted to their crops instead. The democrats plan instead to provide financial aid - you can’t irrigate crops with dollar bills.
That is by the way, I gave the same advice about stepped irrigation planning to southern Brazilian farmers in 2010 where the cold PDO and more frequent La Ninas in the cold PDO mean more frequent droughts. The intervening El Ninos bring heavy rains that should be stored and used to irrigate crops in the drier prime areas. Drought is aggravated by low solar and we are entering a multidecadal period where that is likely.
Enlarged
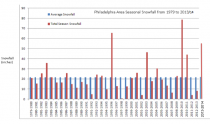
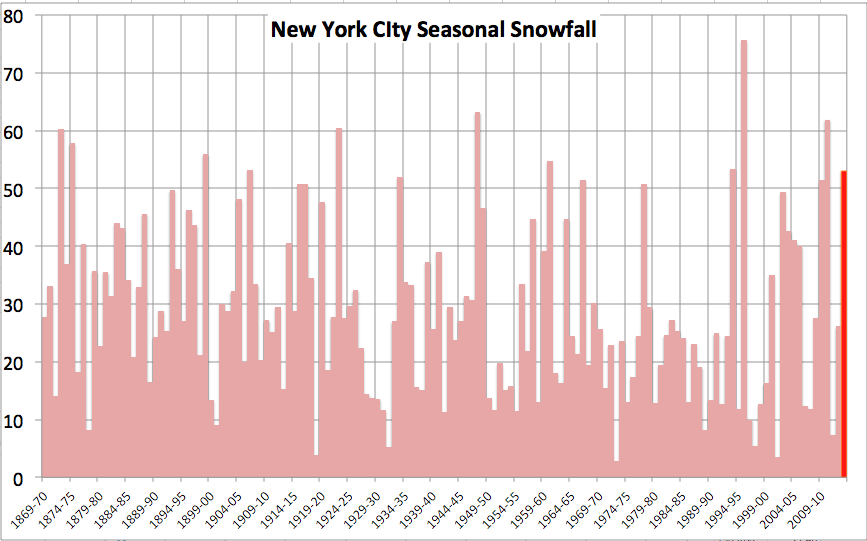
Further east Detroit, Chicago, Philadelphia and Chicago are setting snow records.
Enlarged

Enlarged
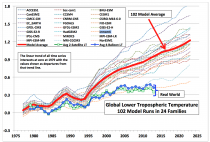
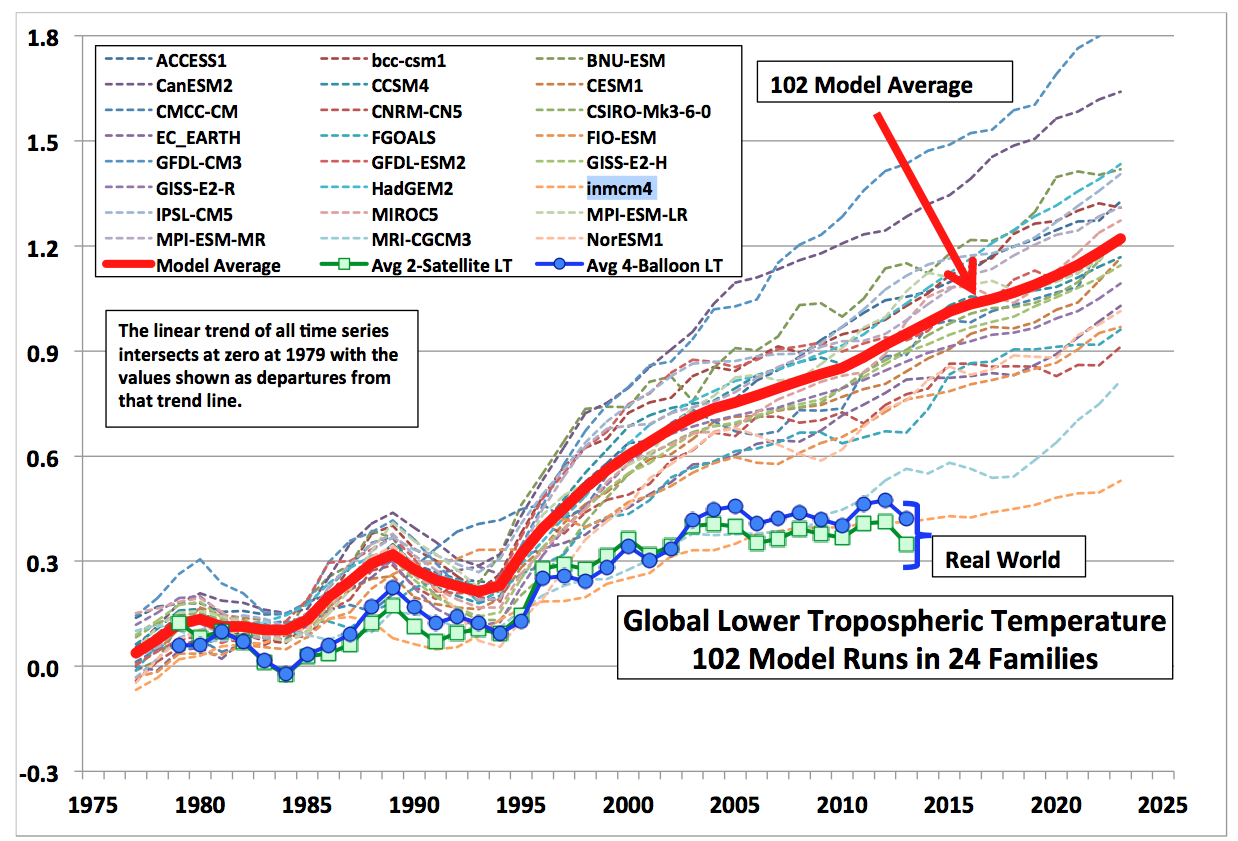
But the climate models are failing miserably.
Enlarged
The winter has been much colder than NCDC has shown with raw data.
_thumb.png)
Enlarged
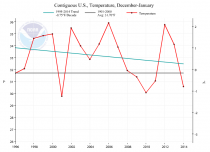
See the long term December/ January trend - you can see the 60 year cycle. This winter is cold but the NCDC numbers are smaller than the raw observation based data used by the models.
Enlarged
The trend is down the last 20 years for the CONUS. THIS IS DECEMBER/JANUARY TREND data downloaded from NOAA NCDC.
Enlarged
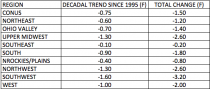
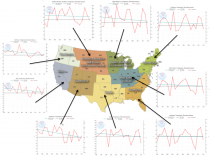
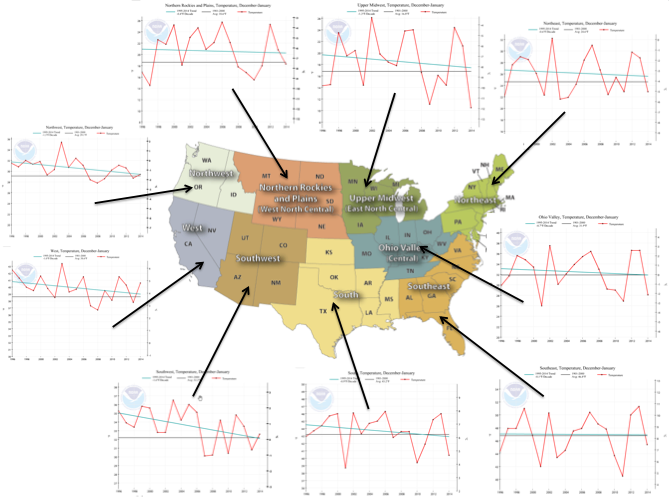
Every one of the 9 climate regions in the US are cooling for 20 years.
Enlarged
Enlarged
Link to all the regions here.
Feb 05, 2014
Climate Scientist Who Got It Right Predicts 20 More Years of Global Cooling
By Barbara Hollingsworth
Dr. Don Easterbrook, a climate scientist and glacier expert from Washington State who correctly predicted back in 2000 that the Earth was entering a cooling phase, says to expect colder temperatures for at least the next two decades.
Easterbrook’s predictions were “right on the money” seven years before Al Gore and the United Nation’s Intergovernmental Panel on Climate Change (IPCC) shared the 2007 Nobel Peace Prize for warning that the Earth was facing catastrophic warming caused by rising levels of carbon dioxide, which Gore called a “planetary emergency.”
“When we check their projections against what actually happened in that time interval, they’re not even close. They’re off by a full degree in one decade, which is huge. That’s more than the entire amount of warming we’ve had in the past century. So their models have failed just miserably, nowhere near close. And maybe it’s luck, who knows, but mine have been right on the button,” Easterbrook told CNSNews.com.
“For the next 20 years, I predict global cooling of about 3/10ths of a degree Fahrenheit, as opposed to the one-degree warming predicted by the IPCC,” said Easterbrook, professor emeritus of geology at Western Washington University and author of 150 scientific journal articles and 10 books, including “Evidence Based Climate Science,” which was published in 2011. (See Easterbrook coming-century-predictions.pdf)
In contrast, Gore and the IPCC’s computer models predicted “a big increase” in global warming by as much as one degree per decade. But the climate models used by the IPCC have proved to be wrong, with many places in Europe and North America now experiencing record-breaking cold.
Easterbrook noted that his 20-year prediction was the “mildest” one of four possible scenarios, all of which involve lower temperatures, and added that only time will tell whether the Earth continues to cool slightly or plunges into another Little Ice Age as it did between 1650 and 1790.

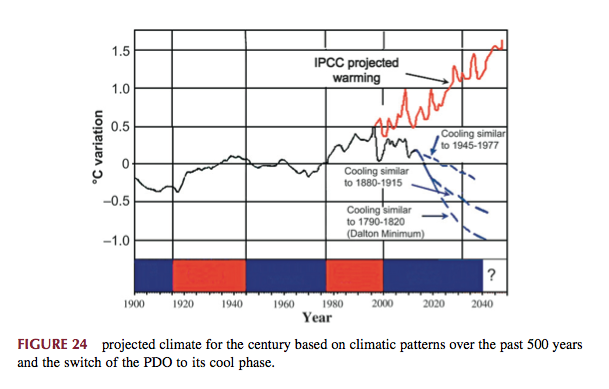
Enlarged
“There’s no way to tell ‘til you get there,” he told CNSNews.com. But he lamented the fact that governments worldwide have already spent a trillion dollars fighting the wrong threat.
“How does it feel to have been right?” CNSNews.com asked Easterbrook.
“To be really truthful, it’s wonderful. There’s nothing that makes you feel better than to be right and be able to say, ‘I told you so,’” replied Easterbrook, who was also an official reviewer of the IPCC reports. “But I’m not gloating about it because it’s not good news. It’s bad news.
“And in many respects, I hope that I’m wrong. And the reason I hope that I’m wrong is because it’s going to cost several million people their lives if I’m right. In Third World countries where food and water are a problem right now, it’s going to get worse. Cold is way worse for humanity than warm is.”
Easterbrook said he made his earlier prediction by tracing back “a consistently recurring pattern” of alternating warm and cool ocean cycles called the Pacific Decadal Oscillation (PDO) that occurs naturally every 25 to 30 years. He discovered that the PDO corresponded with a similar temperature cycle demonstrated by isotope ratios found in Greenland ice cores going all the way back to 1480.
“We don’t know what the driving mechanism is, but it’s very consistent. It’s happened five times a century and every time it’s happened, there’s been a corresponding change in global temperature, either warm or cool,” Easterbrook told CNSNews.com.
“What I did was I projected this same pattern forward to see what it would look like. And so in 1999, which was the year after the second warmest year on record, the PDO said we’re due for a climate change, and so I said okay. It looks as though we’re going to be entering a period of about three decades or so of global cooling.
“And so in 2000, I published a paper with the Geological Society of America in which I predicted that we were going to stop warming and begin cooling for about 25 or 30 years, on the basis of taking the temperature records that go back a century or more and simply repeating the pattern of warming and cooling, warming and cooling, and so on.
“And that in fact has happened. We have now had 17 years with no global warming and my original prediction was right so far. But we have still probably another 20 years or so to see if the cooling trend continues, and if it does, then my prediction will be right and my methods will be right. And so what it boils down to is, so far so good.”
Easterbrook added that his long-term prediction until the end of century is “a lot more nebulous” due to the still-unknown effect of the sun, which has entered a “grand solar minimum” occurring every 200 years. “Everything we think depends on what’s going to happen with the sun.”
But based on past climate data, he says the most likely scenarios are “either deep cooling, or a return to another 25-year cycle of light warming/cooling, but nothing even approaching the 10 degrees warming the IPCC folks are predicting.”
When CNSNews.com asked Easterbrook if anybody from the IPCC, which “ignored all the data I gave them,” ever admitted that he had been right, he laughed."No, every time I say something about the projection of climate into the future based on real data, they come out with some modeled data that says this is just a temporary pause, like a tiger waiting under the rug.”
Easterbrook noted that 32,000 American scientists have signed a statement that there’s no correlation between climate change and carbon dioxide levels. “I am absolutely dumbfounded by the totally absurd and stupid things said every day by people who are purportedly scientists that make absolutely no sense whatsoever…
“These people are simply ignoring real-time data that has been substantiated and can be replicated and are simply making up stuff,” he told CNSNews.com. Driven by a quest for money and power, he added, “what they’re doing in the U.S. is using CO2 to impose all kinds of restrictions to push a socialist government.”
“One thing many people don’t realize is that CO2 by itself is incapable of causing significant climate change. Carbon dioxide in the atmosphere is 39/1,000ths of one percent. It’s nothing. Ninety-five percent of the greenhouse effect is water vapor, and water vapor is not changing....
“No doubt CO2 has been climbing, but the total change in atmospheric composition [since 1945, when CO2 levels began to increase] is one 9/1,000ths of one percent. So how are you going to have a 10 degree climate change by changing this tiny amount? You can’t do it,” he says, which is why the trillion dollars already spent worldwide on reducing carbon dioxide has had little effect.
“The people who are climate deniers are the people who are denying global cooling,” Easterbrook told CNSNews.com. “We haven’t had any global warming in 17 years, and they are denying that. And so we’re not the deniers. They’re the deniers.”
Feb 03, 2014
U.S. December/January Temperatures 3rd Coldest in 30 Years
by Roy W. Spencer, Ph. D.
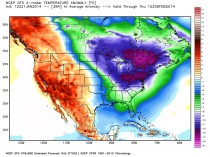
Icecap Note: back in Mid January we posted a model forecast that showed extreme cold for the last half of January. The GFS from January 17th that seemed so extreme appears to have underestimated the cold a bit as the CFS reanalysis data suggests. It was also colder west and south than forecast.The CONUS anomaly for that 16 day period was -7.142 or -12.86F!! All that at the coldest part of the winter climatologically speaking.
Enlarged
_thumb.png)
Enlarged
---------
Yes, Virginia, it really has been a cold winter.
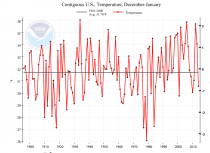
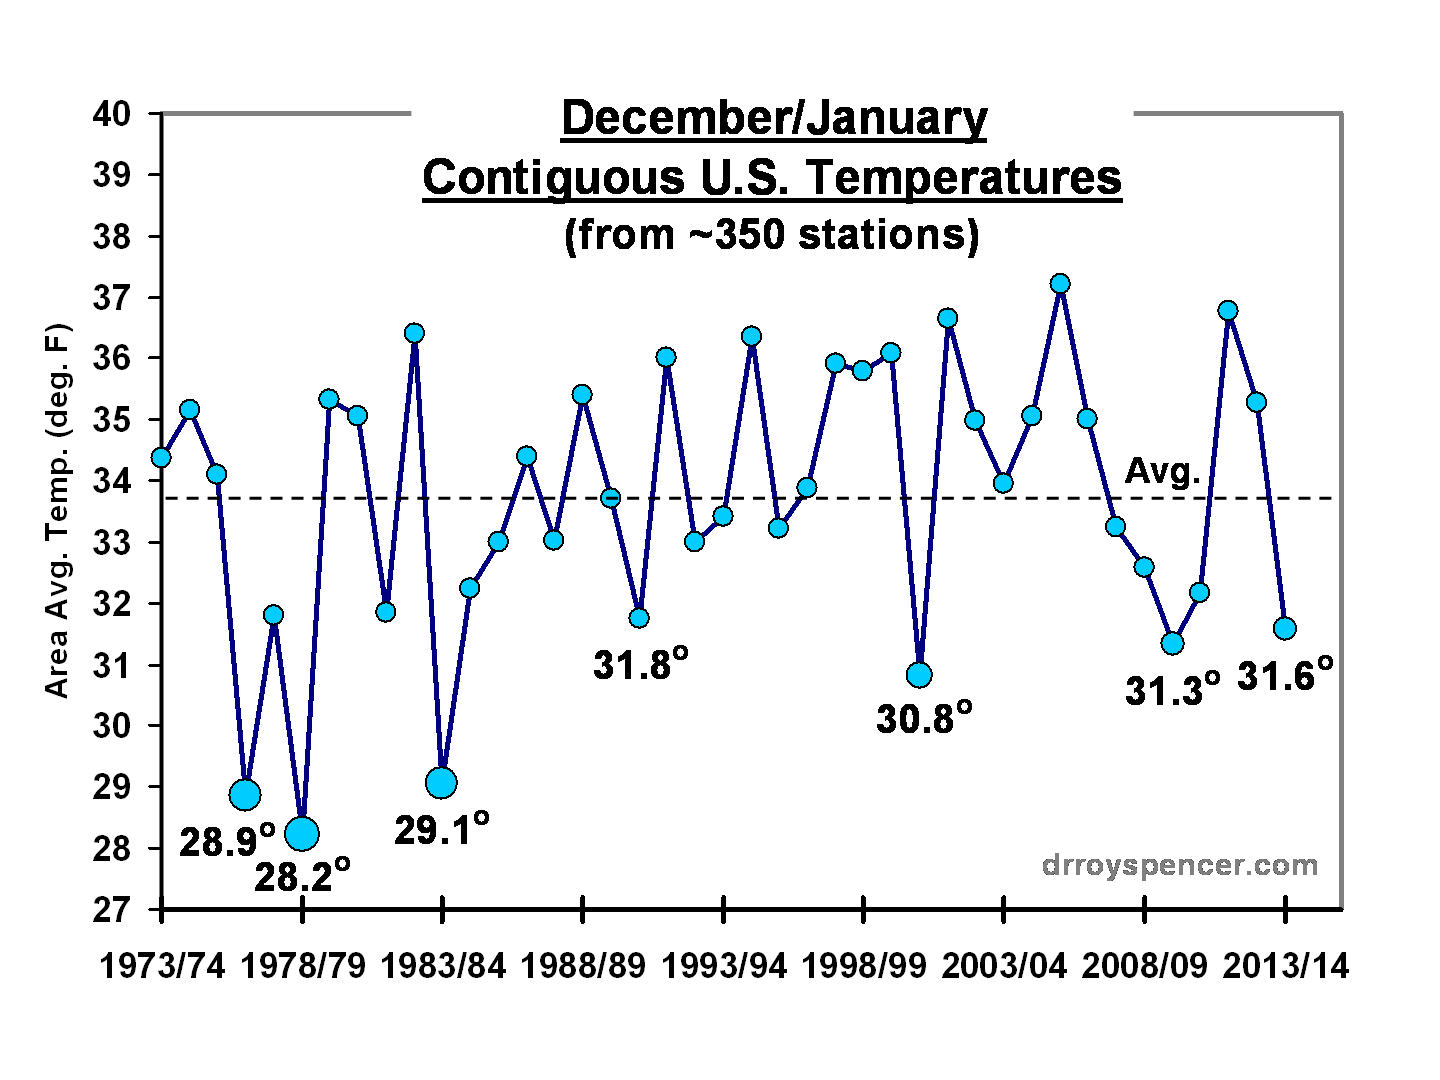
The winter months of December 2013 and January 2014 averaged over the contiguous 48 United States were the 3rd coldest Dec/Jan in the last 30 years. (click for large version):
_thumb.png)
The winter months of December 2013 and January 2014 averaged over the contiguous 48 United States were the 3rd coldest Dec/Jan in the last 30 years. (click for large version)

The analysis is based upon ~350 NOAA/NWS stations that measure temperatures every 6 hours (or more frequently), many located at airports. This is different from the official NOAA temperature product (update not yet available), which is based upon daily max/min temperatures measured at 1,000+ co-op stations. Those stations have had large adjustments made due to (among other things) changing time of observation (TOBS) over the years
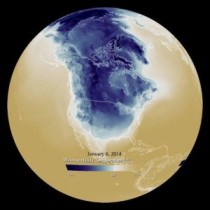
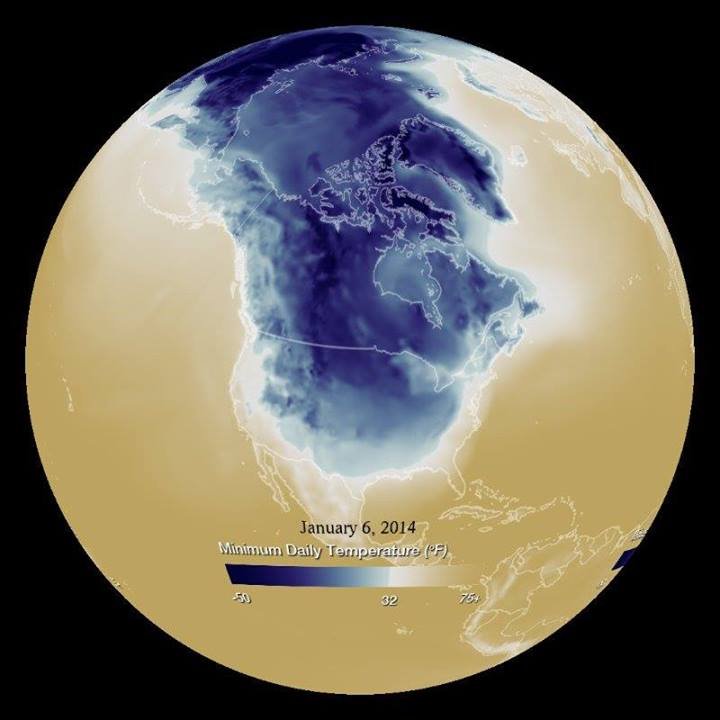
NASA January polar vortex
An interesting feature is that 5 of the last 7 years have been below the 41-year average, which has happened only one other time in the 41-year period.
The data I use are adjusted for average spurious urban heat island (UHI) warming that increases with population density around the thermometer site. That relationship is shown at the end of this article. The analysis starts in only 1973 since that is the first year with a large amount of quality-controlled 6-hourly temperature data archived at NOAA.
So, does the cold winter disprove global warming theory? No more than an unusually warm winter proves the theory. It’s just what we used to call “weather”.
Jan 30, 2014
Europe Flees Economy-Destroying Green Initiatives While Obama Presses On
by Megan Toombs
C02 reduction regulations and subsidies for “green energy” are destroying the European economy, and the United States is next.

But Europe’s waking up. After years of trying to lead the push to go green, it has turned around and begun steep cuts in its climate protection goals. Why? To save member states’ economies.
For example, Germany, one of the strongest proponents of environmental regulations in the European Union (EU), has seen energy prices soar, making its prices the highest in Europe. According to the Telegraph,, a three-person household will soon be paying ninety euros a month for electricity ($123.05) and 300,000 households per year are having their power turned off because they can’t pay the bill.
These high prices are in part due to the large subsidies (taxes) given for wind and solar energy. In addition, “green” energy producers are guaranteed a offline, and the rest are scheduled to be shut down by 2022.
Germany, like all who subscribe to the environmentalists’ viewpoint, has put being “green” over the good of its people. They have forgotten God’s created order, and the outcome has been more and more people, usually the poorest, hurt by bad policy. Environmentalists strongly support subsidies for “green” energy, but “Thou shalt not steal” is a commandment that should not be forgotten. Germany has been stealing from its people to fund its solar and wind habit, and, as with all addicts, a time comes when that habit either has to be kicked, or severe damage ensues.
Because of the disturbing economic situation and German industries’ fears that they will no longer be competitive, Germany’s Economy Minister, Sigmar Gabriel, wants to cut “green” subsidies by one-third by 2015. But is it too little too late?
The EU has reduced its climate protection goals so that though targets will be binding on the EU level, they will not be binding on member states. Goals include a target of 27% “green” energy production, but with no guidelines for how member states meet that target.
The European Commission, executive branch of the EU, has called for “an industrial renaissance” in Europe. Recognizing that “green” regulation’s damage to industry is part of the reason for Europe’s failing economy (unemployment in EU was 10.9% as of October), the Commission is attempting to encourage a more industry-friendly economic environment.
The Commission intends to make the regulatory environment more “stable and predictable” and make EU laws “easier and reduce bureaucratic burdens.”
Included in a more industry-friendly environment are laws allowing hydro-fracking for shale gas. The EU is setting basic principles for health and safety but will not be “meddling in the energy mix that is to be chosen by member states,” claims Commission President Jose Manuel Barroso.
This has lifted pressure on the UK to build wind and solar farms and left it free to pursue nuclear and shale gas energy options. Prime Minister David Cameron announced January 27 that his government was ripping up “80,000 pages of environmental protections and building guidelines.”
Meanwhile, President Obama continues pushing the United States toward the brink by forging ahead with plans to fight the global warming that hasn’t happened in at least the last 17 years, using measures that will cost $trillions by mid-century but will cause no significant reduction in global temperature by the end of the century.
One of President Obama’s means to force the environmentalist agenda on Americans is The Environmental Protection Agency (EPA). Its war on coal destroyed between 13,000 and 17,000 direct and indirect jobs in 2012 alone due to announced coal plant closures. Fast forward to 2014 and the EPA has announced a regulation that would effectively kill the coal industry. Any new coal power plant built, whether to replace or add to existing plants, must meet an emissions standard that is impossible with current technology.
Then of course there is the stonewalling of the Keystone XL Pipeline extension. This pipeline that President Obama claimed would only “create about 50 permanent jobs,” has been estimated by his own State Department to create 42,000 jobs.

At the state level there are also significant economic hardships from enactments of “green” policies. Colorado has seen a 20% faster increase in energy prices compared to the rest of the U.S. Why? Because Colorado followed Europe’s lead and passed a renewable energy mandate in 2004. Prices jumped even higher after these mandates were strengthened in 2007, 2010, and 2013. This translates into $4.2 billion in higher electricity costs since 2007.
Americans will continue to lose jobs due to environmental regulations, as well as increasing energy prices and higher taxes. Let’s save ourselves some heartache and learn a lesson from Europe.
Megan Toombs is Communications and Outreach Coordinator for the Cornwall Alliance.
Jan 22, 2014
Big chill expected to stay until 2040
Timothy Ball
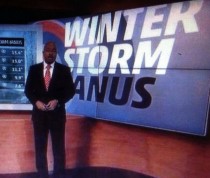
The Weather Channel advises us to watch out for the storm behind winter storm Janus. Oh my this really looks bad. It may even be worse than the dreaded polar vortex. As Anthony Watts adds: “We all know about the Weather Channel’s ridiculous practice of naming winter storms. The latest name for a storm in “Janus” which is the name of the Roman two-faced god. In ancient Roman religion and myth, Janus is the god of beginnings and transitions, thence also of portals, doors, passages, endings and time. This little ooops moment in live broadcasting on TWC can certainly be categorized as a “portal"." See what you Direct TV subscribers are missing!
--------
As the largest snowfall of the winter hits the eastern U.S., politicians and interest groups will claim the latest weather is proof of their position in the climate debate, but a prominent climatologist says this is nothing more than the latest development in a cooling cycle that started over a decade ago and could continue into 2040.

Climate-change activists regularly assert that volatile weather events are on the rise due to human activity that impacts our climate, while skeptics point to the snow and cold snaps as further proof the earth is not running a fever.
Dr. Tim Ball taught climatology for many years at the University of Winnipeg and is the author of the newly released book, “The Deliberate Corruption of Climate Science.” He told WND it’s foolhardy to draw conclusions on overall climate trends based on one weather system or even one winter, but he believes the harsher winter is part of a cooling cycle.
“What happens as the cooling begins, the jet stream moves from west to east in very large waves, but the amplitude, that is the north-south orientation of those waves, increases. It’s called a meridional pattern of weather, and that’s why you see the record colds that you had in the U.S. recently, but also record warms,” Ball explained.
“Look at eastern Australia as an example, or Siberia earlier in the winter. So if you imagine these waves where you’ve got cold air pushing toward the equator in one area, you’ve also got warmer air pushing further toward the poles in other areas. That’s why you’ve got this increasing variability of the weather,” said Ball, who noted that history tells us exactly what these conditions mean.
“If you look at the historic record, and I mean going over 10,000 years, this pattern occurs as the earth starts its cooling down process. And that’s what’s going to happen,” he said. “We’re going to be in this cooling until at least 2040.”
The cooling started 10 years earlier near the South Pole, according to Ball, who said the growth in Antarctic ice is why we witnessed the research vessel and its rescue ship trapped in ice in the middle of summer in the southern hemisphere.
Ball said the cooling for us will not only continue for nearly 30 more years, but the depths of the cooling cycle could mean we experience some historic chills.
“There’s a debate about how much cooling will occur, but it’s related to the changes in the sun, the sunspot cycles,” Ball explained. “That’s the predominant control of long-term temperature patterns. The scientists that I’ve been working with a lot, we think, as I said, that’s it’s going to continue cooling until 2040, certainly getting to cooler temperatures than we experienced around 1800 or 1820 and possibly get as cold as it was back in what’s called the ‘Little Ice Age’ when you had three feet of ice on the Thames in England in 1683.”
In “Eco Tyranny,” Brian Sussman reveals how the left is using phony environmental crises to demonize capitalism and liberty and purposefully withhold America’s vast natural resources and how the Obama administration is piloting the plan.
Looking at that historic record is critical to understanding how climate naturally changes over time, says Ball, and he contends trying to define climate or even policy on recent weather events is disingenuous.
“The difference is the difference between weather and climate. Weather is what you experience if go and stand outside right now. It’s the combination of thousands of variables, everything from cosmic radiation in deep space to geothermal heat off the bottom of the oceans,” he said.
“Climate is the average weather in a region or the change in the average weather over time. That’s what I’ve been studying all my career is climate change and how it changes over time. You cannot say any one particular event is due to climate change. The only way you can do that is step back and look at the trend,” said Ball, who argued that many scientists today are simply misusing historic climate data to suit their political ends.
“It depends what starting point you pick on the temperature record or the precipitation record and then the ending point. You can prove anything you want from the record by selecting the time period that you want to look at,” Ball said.
“For example, since 1900, the world warmed up to 1940. It cooled down to 1980. It warmed up to 1998, and now it’s cooling down again. You could pick any one of those periods and say, ‘Oh look, it’s warming or it’s cooling’ and then say it’s going to keep on going and it’s the end of the world, which of course is what they’ve done with the recent warming from 1980 up to 2000,” he said.
After years of contending there was an unrelenting rise in global temperature, climate-change activists now contend that extreme heat, extreme cold or active hurricane and tornado seasons all mean human activity is making our climate more volatile. Ball said good science flatly proves those claims false.
“Actually, the number of tornadoes is dramatically down. The number of hurricanes, particularly the ones coming ashore in the U.S., is significantly down. So, their arguments are completely wrong,” he said.
“The supposed increase in storminess is scientifically wrong because the storms occur along the boundary between the cold polar air and the warmer tropical air, which is essentially across the central U.S., between 30-50 degrees of latitude. If you decrease that temperature difference across that boundary, which is called the polar front, then you get fewer storms, not more,” he said.
“The official argument is that the polar regions are going to warm up more than the tropical regions, which actually would reduce the number of storms, but they’re claiming it will increase it,” he said. “It’s just another example of climate science being used for a political agenda.”
|


.png)
.png)
.png)