It is urgent that all Australian politicians understand the dangers in the Paris Climate Agreement. Here are TEN REASONS to EXIT PARIS NOW:
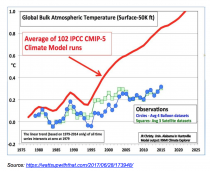
1. The science is NOT settled - hundreds of scientists in Australia and thousands more throughout the world reject the theory that human production of carbon dioxide is driving dangerous global warming. And the 102 computerized climate models have always predicted more warming than has occurred. (They got it right once, 39 years ago.)
2. There is no unusual global warming. Since the last ice age ended there have been warm eras hotter than today’s modern warming - the warm peaks are getting lower, not higher. Climate has always changed in response to forces far greater than human activities. The endless procession of man-made scare campaigns about cooling, warming, ice melting, sea levels, ocean acidity, cyclones and droughts have all proved false.
3. Carbon dioxide is NOT a pollutant - it is an invisible natural gas that supplies the whole food chain. More carbon dioxide is beneficial to the biosphere - forests, grasses and crops grow better thus benefitting all animal life that relies on plants.
4. The populous world nations are unlikely to curb their CO2 emissions - China, India, Russia, Brazil, USA, Japan, SE Asia, Indonesia, Africa and the Arab world will ignore Paris limits.
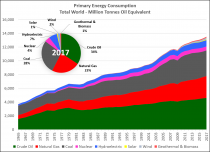
5. Despite 20 years of favorable promotion, subsidies, taxes, targets and propaganda the contribution of the intermittent energy producers (wind and solar) to world energy supplies is trivial - about 3% (see if you can find “solar” in the graph below.)
6. Australian energy policies, taxes and targets are making electricity more costly and less reliable, hurting consumers and driving industry off-shore. And once they have ruined electricity and coal their next targets will be agriculture and motorists.
7. With no nuclear power, no geothermal power, limited hydro potential and increasing barriers to gas exploration, Australia has few options except coal for cheap reliable grid power, and oil products for transport.
8. With a huge continent, a small population and heavy reliance on exports, each Australian will be heavily penalized by the Paris Agreement for the emissions associated with exports consumed by others.
9. Compliance with the Paris Agreement will destroy industries and jobs, encourage bureaucracy and transfer controls and money to affiliates of the United Nations.
10.Should the world experience even modest cooling in the decades ahead Australia will urgently need increased supply of reliable power for homes and industry and the global atmosphere will need more carbon dioxide plant food.
Viv Forbes
Executive Director
www.saltbushclub.com
forbes@saltbushclub.com
https://saltbushclub.com/wp-content/uploads/2019/01/saltbush-founding-members.pdf
This is the first Saltbush Chain Letter entitled Exit Paris Now.
Make sure you pass it on to at least FIVE recipients within 48 hours or the fleas of one thousand camels from the Saltbush country will infect your armpits.
----------------
Hundreds of Consumers, Business people and Scientists say: “Get out of the Paris Agreement.”
“The Saltbush Club”
Skilled and Thinking Australians concerned at the huge costs and unproven benefits of the climate, energy and infrastructure policies on both sides of Federal Parliament.
A new lobby group comprising scientists, farmers, consumers, small business and big business is urging both sides of Australian politics to put aside party interests and global agendas to focus on what’s best for Australian business, workers, consumers and the environment.
The Saltbush Club calls for Australia to withdraw from the Paris Climate Agreement and to cease financing or supporting the international bodies promoting it.
It challenges the whole idea of a consensus on man-made global warming.
Jerry Ellis, retired chairman of BHP, and Founding Chairman of the Saltbush Club says:
“It is clear that Australia’s push to meet the Paris carbon dioxide emission targets is leading to higher electricity prices and unreliable supply. We have lost the balance between working for environmental outcomes and working for economic outcomes. These things need to be balanced, and this balance is missing with the Paris Agreement. The world would be a better placed with strong economies generating money to spend on poverty, health, infrastructure and the environment.”
Hugh Morgan, CEO of Western Mining 1990-2003 and a director of the Saltbush Club agrees:
“People think the Paris Accord is just about commitments to lower CO2. It is really about transferring wealth via the UN to the so-called Less Developed Countries. It’s about advancing centralized control of people’s lives on a global scale. This climate alarm movement has got so far because of backing by Western millennials who have been indoctrinated during their education. Enjoying living standards unprecedented in world history, they have embraced alarmism as a new secular religion.”
Ellis and Morgan are supported by a large, skilled and experienced group of other Australians calling themselves “The Saltbush Club”. The group was organized by Viv Forbes (with a few helpers), from a country farm-house in Queensland with no landline, no NBN and less than $3,000 in financial support.
Forbes says:
“The Saltbush Club has over 200 foundation members, plus a bigger group of “silent” members. It will be a voice for those who are rarely heard in the climate and energy debate - those consumers of electricity who are concerned that the war on hydro-carbon energy has increased the costs and reduced the reliability of electricity for industry and private consumers. It welcomes anyone with a similar view, regardless of their political affiliations or leanings. We must reject the UN Agenda which is crippling western industry with high-cost unreliable electricity in a futile attempt to control global climate. Our top priority is to have Australia withdraw from the Paris Climate Agreement and to cease financing or supporting the international bodies promoting it.”
Jo Nova (a well-read blogger and Saltbush Media Director) added”
“Who speaks for consumers? Our elected reps are supposed to, but few are willing to speak up. There is a $1.5 trillion dollar global industry that wants Australia to accept Paris, but no debate about the vested interests that stand to profit while Australian consumers and businesses pay carbon taxes they have voted against every time they had the chance.”
Environmentalists first predicted impending climate disaster in the 1970s, but they didn’t call it global warming. Back then, it was “Global Cooling” that would end life on earth as we knew it. The smog of industrial pollutants was blocking out sunlight so severely, we were warned, that our planet would enter a new ice age unless we acted quickly. Magazine covers featured pictures of snowball earth.
In the eighties, we cleaned up our air, the threatened the ice age did not occur, and thousands of people with time on their hands and seeking purpose in life had discovered that they could make a career out of disaster prophecy. Thus, it was time for a new catastrophe: “Global Warming” Well, maybe not so new. Same villain: us and our machines. Same victim: our delicate planet earth. Same threat: the end of life as we know it. Only the predicted temperature had changed.
Global warming appealed to the press’s appetite for calamity and became an instant hit. The headlines wrote themselves: The poles will melt! The oceans will rise! Lakes and rivers will dry up! Farmlands will become deserts! Millions will starve to death! This was big. Government would have to join the fight.
In the nineties, environmentalists switched their emphasis to “Climate Change” This was a marketing move. Global warming could credibly be blamed for warming, but climate change could be blamed for anything. If hurricanes increase one year, that’s evidence of climate change. If they decrease the next year, well, that’s climate change too. Droughts are caused by climate change, but so are exceptional rains. Warmer winters prove climate change, but so do colder winters. (Claiming that frigid temperatures are caused by global warming would sound ridiculous.) “Climate Change” was disaster gold. It couldn’t be disproved.
Which is exactly why it’s not science. It’s pseudo-science, according to the great philosopher of science, Karl Popper, who pointed out that for any theory to be considered scientific, it must be falsifiable. There must be something within the theory itself that can be disproved.
This may be technically true, but what was far more important was that “Climate Change” had already been proven-- by three decades of data, by the computer models of climate experts, and by the overwhelming consensus of scientists.
But those “proofs” aren’t science either. Looking backward, climate change the phenomenon has been a constant feature of our planet. Real climate science tells us that temperatures have been much colder and much hotter in the past. (Canada once had a tropical climate.). For the past ten thousand years, we’ve been living in an interglacial period. These pleasant periods have tended to last for ten to fifteen thousand years, so real climate science predicts that we can enjoy about (up to) five thousand more years of temperate weather until the next ice age hits.
The theory of “Climate Change” is entirely different. To claim that it has been proven is to entirely misunderstand how science works. No scientific theory is ever proven. Theories that appear to accurately describe how nature works—like Darwin’s theory of evolution or Einstein’s relativity—are assigned the provisional status of not yet disproven, with the understanding that the discovery of a single contrary fact could throw a wrench into the works.
Strictly speaking, “Climate Change” theory isn’t really a scientific theory at all. It doesn’t take into relevant account factors which arguably have a far stronger effect upon climate than CO2, like the sun, ocean currents, and the greatest greenhouse gas of them all, water vapor.
What “Climate Change” is, is a bunch of doomsday predictions. Now, predictions are the critical part of the scientific method. They are what enable a theory to be proven or disproven. If they prove false, they’re also the best way to refute a theory.
Climate change alarmists have made lots of predictions. Perhaps too many, because not one of their predictions whose expiration date has passed has proven correct. Here’s a sampling, courtesy of Anthony Watts at wattsupwiththat.com:
1988, Dr. James Hansen. Asked by author Rob Reiss how the greenhouse effect was likely to affect the neighborhood below Hansen’s office in NYC in the next 20 years, Hansen replied: “The West Side Highway [which runs along the Hudson River] will be under water. And there will be tape across the windows across the street because of high winds. And the same birds won’t be there. The trees in the median strip will change...There will be more police calls [since] you know what happens to crime when the heat goes up.”
Sept 19, 1989, St. Louis Post-Dispatch: “New York will probably be like Florida 15 years from now.”
1990, Michael Oppenheimer, The Environmental Defense Fund: “By 1996, the Platte River of Nebraska would be dry, while a continent-wide black blizzard of prairie topsoil will stop traffic on interstates, strip paint from houses and shut down computers...The Mexican police will round up illegal American migrants surging into Mexico seeking work as field hands.”
October 15, 1990, Carl Sagan: “The planet could face an ecological and agricultural catastrophe by the next decade if global warming trends continue.”
1990, Actress Meryl Streep: “By the year 2000 - that’s less than ten years away—earth’s climate will be warmer than it’s been in over 100,000 years. If we don’t do something, there’ll be enormous calamities in a very short time.”
July 26, 1999, The Birmingham Post: “Scientists are warning that some of the Himalayan glaciers could vanish within ten years because of global warming. A build-up of greenhouse gases is blamed for the meltdown, which could lead to drought and flooding in the region affecting millions of people.”
April 1, 2000, Der Spiegel: “Good bye winter. Never again snow”
March 29, 2001, CNN: “In ten years’ time, most of the low-lying atolls surrounding Tuvalu’s nine islands in the South Pacific Ocean will be submerged under water as global warming rises sea levels.”
Oct 20, 2009, Gordon Brown, UK Prime Minister (referring to the Copenhagen climate conference): “World leaders have 50 days to save the Earth from irreversible global warming.”
To suggest that the scientific validity of “Climate Change” is debatable is to speak charitably. But there’s never been a debate, not for want of trying. Many skeptics have called for debates. In particular, Christopher Walter Monckton, 3rd Viscount Monckton of Brenchley, a hereditary peer, journalist, political advisor, inventor, and a skeptic well-versed in the details of climate science, has repeatedly challenged Al Gore to debate. That Al Gore has never replied to these requests is difficult to reconcile with his comments on the CBS “Early Show” (May 31, 2006):
“...the debate among the scientists is over. There is no more debate. We face a planetary emergency. There is no more scientific debate among serious people who’ve looked at the science… Well, I guess in some quarters, there’s still a debate over whether the moon landing was staged in a movie lot in Arizona, or whether the Earth is flat instead of round.”
These are not the words of a person who understands science. They are the tactics of a person who realizes he doesn’t have a scientific leg to stand on.
There must be another nonscientific reason for the “Climate Change” agenda. That reason may involve the billions of dollars that proponents have demanded for solving this “problem.”
The Global Wind Energy Council recently released its latest report, excitedly boasting that ‘the proliferation of wind energy into the global power market continues at a furious pace, after it was revealed that more than 54 gigawatts of clean renewable wind power was installed across the global market last year’.
You may have got the impression from announcements like that, and from the obligatory pictures of wind turbines in any BBC story or airport advert about energy, that wind power is making a big contribution to world energy today. You would be wrong. Its contribution is still, after decades - nay centuries - of development, trivial to the point of irrelevance.
Here’s a quiz; no conferring. To the nearest whole number, what percentage of the world’s energy consumption was supplied by wind power in 2014, the last year for which there are reliable figures? Was it 20 per cent, 10 per cent or 5 per cent? None of the above: it was 0 per cent. That is to say, to the nearest whole number, there is still no wind power on Earth.
Even put together, wind and photovoltaic solar are supplying less than 1 per cent of global energy demand. From the International Energy Agency’s 2016 Key Renewables Trends, we can see that wind provided 0.46 per cent of global energy consumption in 2014, and solar and tide combined provided 0.35 per cent. Remember this is total energy, not just electricity, which is less than a fifth of all final energy, the rest being the solid, gaseous, and liquid fuels that do the heavy lifting for heat, transport and industry.
Such numbers are not hard to find, but they don’t figure prominently in reports on energy derived from the unreliables lobby (solar and wind). Their trick is to hide behind the statement that close to 14 per cent of the world’s energy is renewable, with the implication that this is wind and solar. In fact the vast majority - three quarters - is biomass (mainly wood), and a very large part of that is ‘traditional biomass’; sticks and logs and dung burned by the poor in their homes to cook with. Those people need that energy, but they pay a big price in health problems caused by smoke inhalation.?
Even in rich countries playing with subsidized wind and solar, a huge slug of their renewable energy comes from wood and hydro, the reliable renewables. Meanwhile, world energy demand has been growing at about 2 per cent a year for nearly 40 years. Between 2013 and 2014, again using International Energy Agency data, it grew by just under 2,000 terawatt-hours.
If wind turbines were to supply all of that growth but no more, how many would need to be built each year? The answer is nearly 350,000, since a two-megawatt turbine can produce about 0.005 terawatt-hours per annum. That’s one-and-a-half times as many as have been built in the world since governments started pouring consumer funds into this so-called industry in the early 2000s.
At a density of, very roughly, 50 acres per megawatt, typical for wind farms, that many turbines would require a land area greater than the British Isles, including Ireland. Every year. If we kept this up for 50 years, we would have covered every square mile of a land area the size of Russia with wind farms. Remember, this would be just to fulfill the new demand for energy, not to displace the vast existing supply of energy from fossil fuels, which currently supply 80 per cent of global energy needs.
Do not take refuge in the idea that wind turbines could become more efficient. There is a limit to how much energy you can extract from a moving fluid, the Betz limit, and wind turbines are already close to it. Their effectiveness (the load factor, to use the engineering term) is determined by the wind that is available, and that varies at its own sweet will from second to second, day to day, year to year.
As machines, wind turbines are pretty good already; the problem is the wind resource itself, and we cannot change that. It’s a fluctuating stream of low-density energy. Mankind stopped using it for mission-critical transport and mechanical power long ago, for sound reasons. It’s just not very good.
As for resource consumption and environmental impacts, the direct effects of wind turbines - killing birds and bats, sinking concrete foundations deep into wild lands - is bad enough. But out of sight and out of mind is the dirty pollution generated in Inner Mongolia by the mining of rare-earth metals for the magnets in the turbines. This generates toxic and radioactive waste on an epic scale, which is why the phrase ‘clean energy’ is such a sick joke and ministers should be ashamed every time it passes their lips.
It gets worse. Wind turbines, apart from the fiberglass blades, are made mostly of steel, with concrete bases. They need about 200 times as much material per unit of capacity as a modern combined cycle gas turbine. Steel is made with coal, not just to provide the heat for smelting ore, but to supply the carbon in the alloy. Cement is also often made using coal. The machinery of ‘clean’ renewables is the output of the fossil fuel economy, and largely the coal economy.
A two-megawatt wind turbine weighs about 250 tonnes, including the tower, nacelle, rotor and blades. Globally, it takes about half a tonne of coal to make a tonne of steel. Add another 25 tonnes of coal for making the cement and you’re talking 150 tonnes of coal per turbine. Now if we are to build 350,000 wind turbines a year (or a smaller number of bigger ones), just to keep up with increasing energy demand, that will require 50 million tonnes of coal a year. That’s about half the EU’s hard coal-mining output.
Forgive me if you have heard this before, but I have a commercial interest in coal. Now it appears that the black stuff also gives me a commercial interest in ‘clean’, green wind power.
The point of running through these numbers is to demonstrate that it is utterly futile, on a priori grounds, even to think that wind power can make any significant contribution to world energy supply, let alone to emissions reductions, without ruining the planet. As the late David MacKay pointed out years back, the arithmetic is against such unreliable renewables.
The truth is, if you want to power civilization with fewer greenhouse gas emissions, then you should focus on shifting power generation, heat and transport to natural gas, the economically recoverable reserves of which - thanks to horizontal drilling and hydraulic fracturing - are much more abundant than we dreamed they ever could be. It is also the lowest-emitting of the fossil fuels, so the emissions intensity of our wealth creation can actually fall while our wealth continues to increase. Good.
And let’s put some of that burgeoning wealth in nuclear, fission and fusion, so that it can take over from gas in the second half of this century. That is an engineerable, clean future. Everything else is a political displacement activity, one that is actually counterproductive as a climate policy and, worst of all, shamefully robs the poor to make the rich even richer.
Spectator.co.uk/podcast
Matt Ridley discusses wind power
--------
How Soon Will Media Report Record Crop Production in our Warming World?
By James Taylor
Global warming alarmists and their media allies launched a new scare this week claiming global warming is causing crop failures and food shortages around the globe. In one of their biggest whoppers ever, the media are claiming global warming has displaced “millions” of farmers in India and is causing - or will soon cause - similar devastation to farmers and crops in Bangladesh, Syria, and Honduras. Objective evidence, however, decimates the assertion and shows crop yields continue to set annual records as growing seasons lengthen, frost events become less frequent, soil moisture improves, and more atmospheric carbon dioxide fertilizes crops and plant life.
A January 10 Google News search for “global warming” listed near the very top of its search results an article titled, “How soon will climate change force you to move?” by an outlet called Fast Company. Among other sensationalist climate claims, the article made the claims listed above about global warming, crop failures, and resulting forced migration. Fast Company, as it turns out, is trying to pull a fast one on you.
It is true that waxing and waning food production has been one of the most powerful components in the rise and fall of civilizations. At Katowice, Poland, during the United Nations COP24 climate meetings in November 2018, Heartland Institute senior fellow Dennis Avery powerfully showed that throughout history periods of increased crop yields have led to rising civilizations and expanding human populations. Conversely, periods of declining crop yields triggered the fall of civilizations and led to famine, death, and contracting human populations.
Importantly, Avery showed that periods of global warmth simulated the increased crop yields that led to expanding human populations. Periods of global cooling repressed crop yields and led to misery, death, and contracting human populations. The question is, has anything changed such that our modest present warming is causing declining crop production and resulting catastrophes?
Let’s first examine the claims regarding India. Fast Company claims “drought in some areas has forced millions of farmers to move.” For support, the article cites a Reuters article from July 2018 that interviews a failed farmer from India’s Madhya Pradesh state claiming global warming and poor rainfall caused his failure as a farmer and his relocation to metropolitan New Delhi. Poor rainfall “has caused repeated and widespread crop failures” Reuters claimed. In summary, Fast Company cites another news organization’s profile of a failed farmer to support its alarmist climate assertions.
However, crop data from India eviscerates the claim that global warming, through drought or any other mechanism, is causing rampant crop failure in India. The Indian government reports that Indian farmers produced a record amount of food grains in 2017-2018, topping the previous record that was set in 2016-2017. “The year 2017-18 had, in fact, witnessed record production of all major crops like Rice (112.91 MT), wheat (99.70 MT), coarse cereals (46.99 MT) and pulses (25.23 MT),” the Times of India reported, citing official government data.
Notably, favorable climate conditions - and most importantly, abundant rainfall - spurred the record crop production. “Backed by good monsoon rainfall last year, India had produced record 284.83 million tonnes of food grains in 2017-18 crop year,” Times of India observed.
The 2017-18 Indian crop year merely continued a longstanding trend of record crop production as our planet modestly warms. The international Organization for Economic Cooperation and Development (OECD) reports Indian farmers have successively set new records almost every year this decade.
The Fast Company and Reuters articles are not outliers. Global warming activists in the establishment media are always looking to find and interview somebody who blames their own personal shortcomings and misfortune on global warming. Scapegoating global warming is a convenient way for failed farmers and others to pass along the blame for their own personal failures. But if you are a farmer in India and you are a failure at your craft, you are the exception rather than the rule. The objective data show, without any room for debate, that crop production continues to improve and set records nearly every year as our modest global warming continues.
Perhaps Fast Company’s discredited claims about global warming, drought, and crop failures in India are an isolated error and the article was correct about its claims regarding other countries and regions. Actually, er, no.
According to agricultural economists at World Bank, as reported by CEIC Data, Bangladesh enjoyed record crop production in 2016, the last year for which data is available. The 2016 record beat out the previous record year - 2014 - and was preceded by the third highest production year - 2015. Do you see a pattern here? Crop production in Bangladesh is 33 percent higher than it was merely a decade ago. According to a World Bank report accompanying the 2016 data, “Bangladesh’s rural economy, and specifically agriculture, have been powerful drivers of poverty reduction in Bangladesh since 2000.”
How about Honduras? The International Food Policy Research Institute, citing official government data, documents that in 2016 - the most recent year for which there is data - Honduras achieved record production for each of its three staple food crops. Honduran farmers produce record amounts of rice, wheat, and maize. The 2016 record beat the previous record, set in 2015. The next most productive crop year was 2014, followed by 2013. Moreover, Coffee Bureau Intelligence reports that coffee drinkers and coffee farmers also have reason to rejoice - as Honduran coffee production is believed to have set new records in 2018. “Since 2014-2015, Honduras coffee production has increased by more than 12% per year,” Coffee Bureau Intelligence reports.
Syrian crop production also defies alarmist claims. United Nations Food and Agriculture Organization data show an approximately 50 percent increase in Syrian crop production since 1995. Moreover, the Arab Spring democracy uprisings in Syria and elsewhere, which climate alarmists ‘blame’ on global warming, occurred in 2011, a year in which Syria produced its eighth highest crop yields in history.
Fast Company cited four specific nations in support of its narrative that global warming is causing rampant crop failures, which in turn is causing mass migration. Objective data show, beyond dispute, that Fast Company’s claims are flat-out wrong. But in today’s agenda-driven media climate, don’t expect Fast Company, other media outlets, or Google News to post any corrections to the false reporting.
James Taylor (JTaylor@heartland.org) is senior fellow for environment and climate policy at The Heartland Institute.
Multiple federal agencies are pushing agenda-driven climate science on their websites, according to The Heartland Institute.
The Trump administration has taken a public stance supporting fossil fuels and questioning the scientific “consensus” of climate change research.
Parts of federal websites should be overhauled or taken down completely to conform to the administration’s stance on climate change and fossil fuel energy production, Heartland says.
Trump administration agencies continue to push “climate alarmism” and publish “propaganda” on their websites despite President Donald Trump’s position on climate change and the use of fossil fuels, according to The Heartland Institute.
Heartland researchers audited the websites of federal agencies for information that seemed to contradict the public stance of President Donald Trump and his administration’s agenda to expand American energy production, including fossil fuel production. Heartland researchers found numerous examples of federal agencies pushing an anti-fossil fuel narrative, according to sections of a draft report obtained by The Daily Caller News Foundation.
“Federal executive branch websites are littered with political propaganda instead of objective science,” Heartland senior environment and energy policy fellow James Taylor said in a statement to TheDCNF. “To the extent scientific issues are discussed, they are presented in a biased and agenda-driven manner. This is wholly unacceptable and an insult to the American people.”
The agencies audited include NASA, National Oceanic and Atmospheric Administration (NOAA) and the Department of Energy (DOE). While many parts of the agencies’ websites have endorsed Trump’s “energy dominance” agenda and plans to expand fossil fuel productions, other places have remained largely out of touch with the current administration.
NATIONAL AERONAUTICS AND SPACE ADMINISTRATION
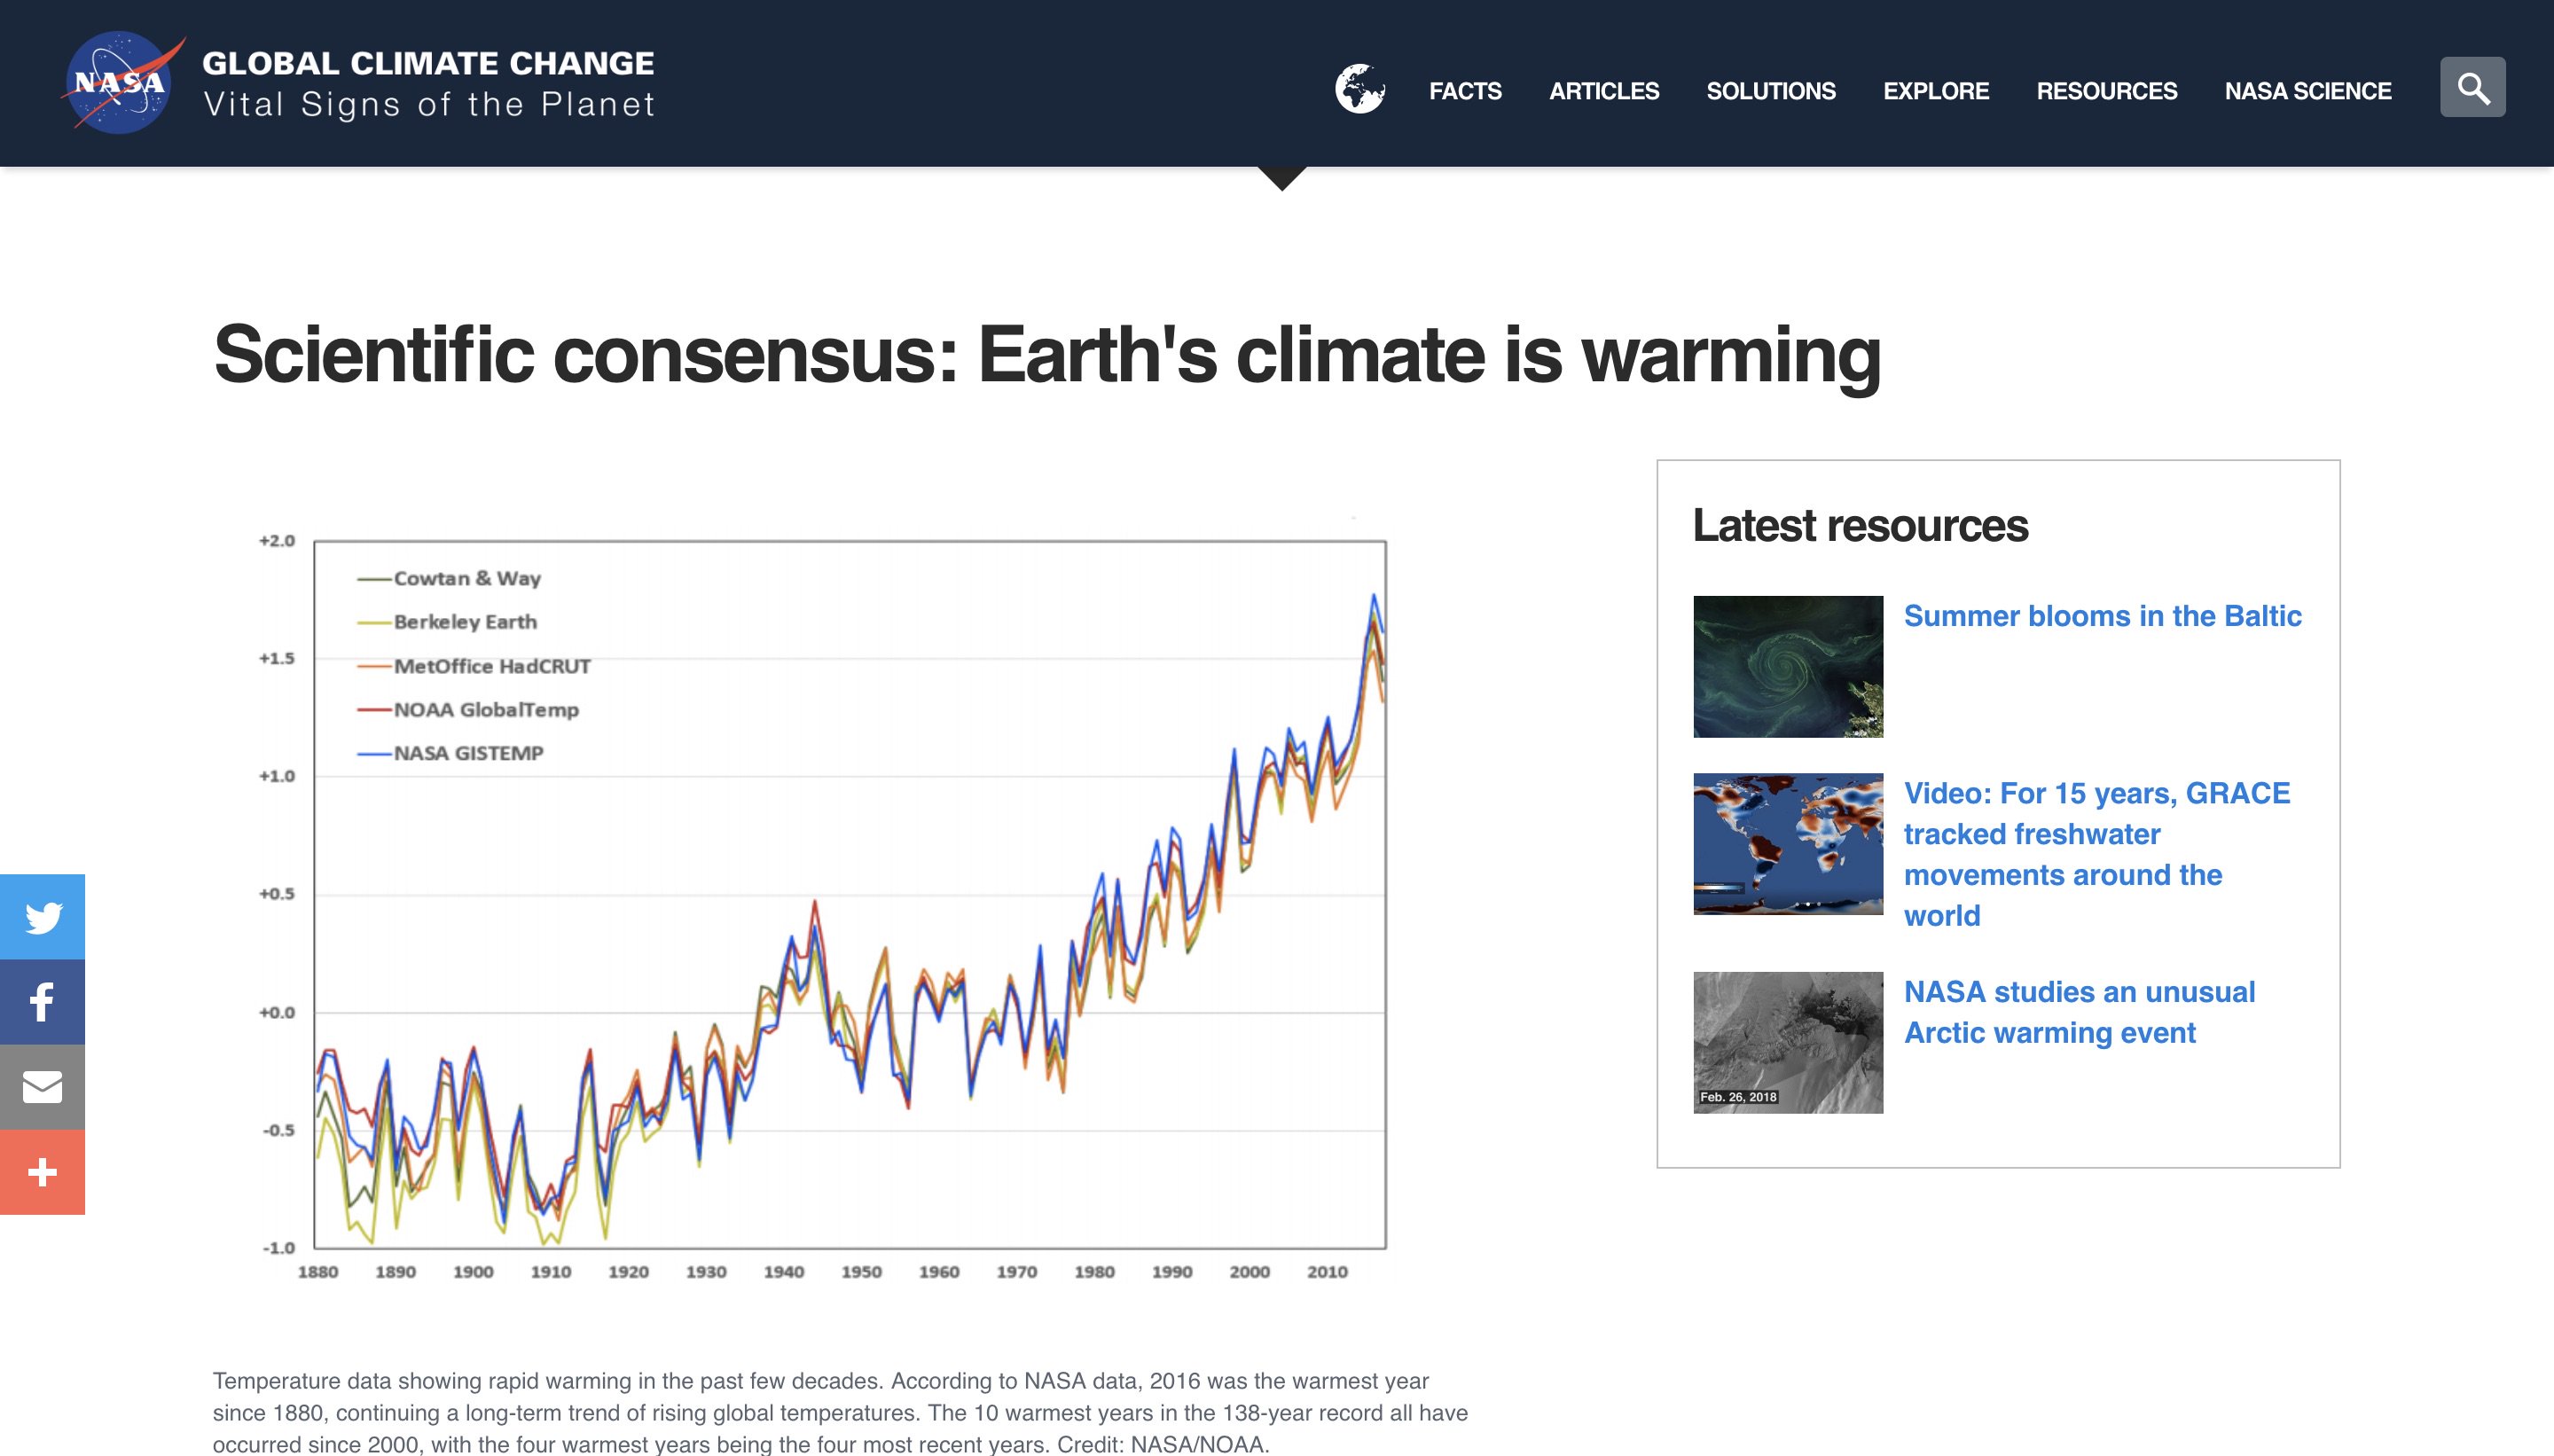
NASA’s website “favorably cites thoroughly debunked claims by radical global warming activists John Cook and Naomi Oreskes” and the Union of Concerned Scientists, a group committed to combatting global warming, according to Heartland’s draft report.
NASA website on the “consensus” of human-driven climate change. (NASA/Screenshot)
For example, the website for space agency NASA pushes the misleading claim that 97 percent of climate scientists agree that “climate-warming trends over the past century are extremely likely due to human activities,” Heartland found. (RELATED: Let’s Talk About The ‘97% Consensus’ On Global Warming)
---------
The claim is based on flawed research done by Cook, an Australian researcher, in 2013. A review of his work and methods found that the “consensus” of climate scientists who agree that human activity contributes to global warming is actually 32.6 percent. Roughly 66 percent of academic papers reviewed by Cook to make his claim took no stance on the issue.
NASA’s website section for children includes a story of the “The king who banned coal,” which tells of an attempt by King Edward I of England to ban coal in 1306, possibly enacting the “First environmental law ever.”
“Why is NASA, a science administration, teaching children radical left-wing political propaganda that the invention of the steam engine was a horrible development and the Industrial Revolution made people’s lives worse?” the Heartland draft report says.
NASA “should be focused on space-related science issues, not producing children’s stories attacking coal power and presenting ridiculous historical revisionism designed to brainwash children into believing that the Industrial Revolution was bad for human health and welfare,” Taylor told TheDCNF.
Fighting back is not easy. 1.5 trillion has funded this hoax (including many millions from Exxon and BP), while at the same time they accuse our side of being shills for big oil.
Some are brave to speak out including my friend and superstar Willie Soon, Harvard Astrophysics scientist.
Willie and his former Harvard colleague Sallie Baliunas did some great work early on refuting the hoax. The target was put on their backs and they were viciously attacked. Sallie was the consultant for the TV series Star Trek. She published with colleagues some excellent papers rebutting the idea it had to be CO2 driving climate. They called her work on climate the worst ever published but time has shown it proven to be right. The continuous attacks and an episode when Sallie’s dog was found suspiciously dead in her yard pushed her to an early retirement. Willie stayed engaged and remains prolific and vocal. His office was invaded by Greenpeace who took his computer and they claim it showed he had made $1.2 M in grants over 20 years. Of course this was grant money given to Harvard - of which Willie gets maybe half. You can be sure if Willie sold out and became a ‘player’, he would be getting maybe 50 to 100 times that $60k/year.
I worked for Friends of Science on a project over a decade ago ISPM, where we were to review the latest IPCC report and extract information from the science sections (not the Summary for Policymakers which was written by statesmen and and lead authors on a mission). Some very good scientists were part of the large group of researchers that along with statesman, environmentalists, and even college students, wrote the sections. We spent 6 months on our extraction process intending to show the story was far less certain and far more complicated than the summary implied. We were paid a small amount (maybe $1200) for our efforts. The immediate claim was that the ‘denialist report’ was paid for by big oil. That was not the case. It came from donations to the organization and was a drop in the bucket compared to the millions warmists get from an NSF and NGOs and Foundation funds all run amuck.
Personally I had a few experiences. While at WSI, I was invited to a Museum in Vermont where two of my former students worked to give a talk on Climate Change. A researcher who had a strong warmist opinion objected to my appearance and tried to get me cancelled and even threatened a boycott. The talk went well. He commented in a post afterwards, he could not understand how I could challenge the science and said I must be dirty with coal money.
Later, I was invited by Vermont Public Radio to debate him but he threatened to not show if I was invited and they replaced me with someone who wrote a book on carbon - the element not the gas CO2. I listened on the internet and my nemesis spent his time bashing skeptics most notably Fred Singer.
I was invited to speak at the college I taught at a few years later and was harassed during my talk by an attendee who said ‘that can’t be true’ again and again to what I showed. Finally the Head of the Department told him to hold off on questions to the end where he tried to dominate the Q&A.
Later I received a request from the museum to be part of a ‘lively debate’ on climate change that a women’s group had requested in the area. I could not attend so I arranged for two scientists (a college professor and a NASA scientist who gives talks and chairs conferences worldwide) to be invited. They agreed but the warmist scientist refused to debate them and the museum uninvited our two scientists. The left likes to proclaim diversity of opinion but that is only if your opinion agrees with theirs. That same warmist scientist who blocked the two debates was part to the RICO 20 that signed a petition to take skeptic scientists to court and charge them with RICO violations. They suddenly backed off as someone advised them - most were sitting on tens of millions in grant money - that it could actually be turned on them. That same warmist scientist had a web site with a page proudly listing the tens of millions in grant money he had made in his career in Vermont. That page disappeared from his site.
I did have one successful debate in MA. The NWS Winter Workshop tried to organize a debate and called college professors across the state and they said the time to debate was over - the science was settled. They would come if the topic was what major steps must be taken to combat warming and its results. NWS did find a new professor who had just complete Al Gore’s course. At the start of the debate a hand survey of the attendees showed 75% believed in AGW and 25% were skeptical. After the debate, the numbers flipped roughly to 75% who had become skeptical and 25% who still believed. The flip were similar to the Intelligence Squared debate with Lindzen and Chrichton and Stott versus Ekwurzel, Schmidt and Somerville around 2007.
I given talks at MENSA meetings, at EMA, Rotary Clubs, at other colleges and at professional society meetings which went well.
I debated a UCS environmentalist at the NH Science, Technology and Energy Committee a few years back. He started by saying he was not a modeler but a data guy and went on to spend his hour talking about data from the models!! I was invited to speak in CT at a similar committee and after a member gave a talk on the great things that had done (tyaxes and regulations) to fend off the 12-14F warming and 10 foot sea level rises coming> After they finished, I was supposed to talk. The chair of the committee (DEM) announced an ad hoc press briefing in the hall and asked all the media and other DEMS to join her. I spoke to a smaller receptive group. I got no media coverage.
I am working on potential briefings and seminars. I will let you know. All of these efforts are pro bono and have to be worked into a week where I work 7 days. I do it because frankly i am worried.
-------------------------
UN Boss: Use “Climate Action” to “Transform the World”
By Alex Newman
KATOWICE, Poland - As the most important United Nations “global warming” summit since the 2015 confab in Paris kicked off in Katowice last week, UN Secretary-General Antonio Guterres (shown) declared that so-called “climate action” offers a “compelling path to transform our world.” Even your “mind” must be transformed, he said. Many other proud socialists, communists, and globalists have also called for using the man-made global-warming hypothesis to transform the world. And they are not kidding.
Photo of UN Secretary-General Antonio Guterres: Copyright cop24.gov.pl
In fact, the man-made global-warming theorists in attendance at the UN summit here are working to exploit alarmism over the “climate” to restructure every aspect of human life. This includes the economy, industry, governance, and even your thinking, Guterres declared. The sought-after global transformation will also involve more government promotion of feminism, planetary taxes on emissions of carbon dioxide (CO2), a total transformation of governance, and so much more, explained Guterres, a longtime socialist leader who led the Socialist International before becoming UN boss.
But as the wheels come off the bandwagon with top world leaders such as President Donald Trump rejecting the UN alarmism, UN leaders are becoming even more alarmist. One UN chief, UN General Assembly president Maria Espinosa, even claimed mankind was “in danger of disappearing” if humanity refuses to submit to the UN agenda. “We need to act urgently, and with audacity,” she exclaimed. “Be ambitious, but also responsible for the future generations.”
The World Wildlife Fund, a radical group promoting tyranny and globalism under the guise of “environmentalism,” has billboards and fliers here claiming humans are an “endangered species.” Asked whether this was due to abortion and population control, a WWF representative at the booth in the COP24 venue responded that no, it was because of “climate change.”
Guterres, a fervent globalist, ludicrously claimed hurricanes that struck the Caribbean last year were “emergencies” that “are preventable,” as if hurricanes were caused by refusal to submit to carbon taxes quickly enough. Speaking some days afterwards at the COP24 summit, former U.S. Vice President Al Gore made similarly dishonest claims, pointing to everything from snow fall to bad weather to argue that human activity and choice needed to be further curtailed.
“It is hard to overstate the urgency of our situation,” Guterres continued in his fear-mongering speech. “Even as we witness devastating climate impacts causing havoc across the world, we are still not doing enough, nor moving fast enough, to prevent irreversible and catastrophic climate disruption. Nor are we doing enough to capitalize on the enormous social, economic and environmental opportunities of climate action.”
In America, socialists are using virtually the exact same rhetoric. Speaking last week alongside self-described Socialist Senator Bernie Sanders, self-styled “democratic” socialist Alexandria Ocasio-Cortez called for using the “climate” agenda to implement her fringe vision for America. “[We] can use the transition to 100 percent renewable energy as the vehicle to truly deliver and establish economic, social and racial justice in the United State of America,” she exclaimed.
Indeed, globalists and socialists have made clear on repeated occasions that they view the phony “climate crisis” as an “opportunity” to achieve their “social” and “economic” goals - namely, wealth redistribution, government controls over ever-larger swaths of human activity, social engineering, and more. And throughout the conference, that was clearly on display as every globalist special interest group came to link its totalitarian agenda to the “climate” bandwagon.
“Climate action offers a compelling path to transform our world for the better,” Guterres continued. “In short, we need a complete transformation of our global energy economy, as well as how we manage land and forest resources. We need to embrace low-carbon, climate-resilient sustainable development.” For those who are unfamiliar with UN-speak, “sustainable development” is code for government-directed development and global technocratic rule.
All of this can be accomplished through the mechanisms agreed to by Obama and other “leaders” in 2015 at the UN “climate” summit in France. “The Paris Agreement provides a framework for the transformation we need,” Guterres said, calling for “concerted resource mobilization” and “transformative climate action in five key economic areas - energy, cities, land use, water and industry.”
According to the UN boss, all of this transformative action must be geared toward shackling humanity to what is euphemistically dubbed the “green economy.” Reading the descriptions given of this “green” economy, it becomes immediately apparent that it is a lot like the “red economy” of yesteryear. The difference: the justification is primarily “environmental” in nature, rather than relying on the discredited communist “ideology” so tainted in the public mind following the institutionalized mass murder of over 100 million people just in the last century.
The “green” economy “means embracing carbon pricing,” Guterres continued, arguing that the gas exhaled by every human being is “pollution"that must be taxed and regulated. This “green” economy also means vastly increasing the scope of the welfare state and the level of dependence on government among individuals. Those workers whose “sectors” face “disruption” must have “retraining” from government, as well as a “social safety net.” In other words, when you lose your job due to the “green” economy, the government will take care of you and your family - maybe.
Spending some $100 billion per year will provide a “positive political signal.” This money is supposed to go into the UN Green Climate [Slush] Fund to help bribe Third World governments into cooperating with the scheme. More will be required later, naturally. At the moment, the U.S. government is prohibited by law from providing money to this fund, but Obama did it anyway, and the next president may try to do it as well.
“Decisive climate action today is our chance to right our ship and set a course for a better future for all,” Guterres continued. “The transition to a low-carbon economy needs political impetus from the highest levels...We need a full-scale mobilization of young people. And we need a global commitment to gender equality, because women’s leadership is central to durable climate solutions.” Gender policy, feminism, and the indoctrination of children are all key, as countless other UN leaders have also made clear.
Shortly after his initial speech, Guterres gave another, focusing on similar themes, including the “transformation of the real economy” that the UN and its member governments must oversee in energy, industry, nature, cities, and much more. “I count on multiple new transformational commitments from governments, business, finance and civil society in each of these areas,” he added. “To achieve genuine transformation in the real economy, we need national governments to play a crucial role in each of the robust coalitions which will deliver concrete transformative outcomes.”
Finally, the UN Secretary-General made clear that even your mind was in the UN’s cross-hairs. “The Paris Agreement is not a piece of paper. It is a historic compact among nations, a compact to ensure our survival” he said, as if mass murderers who enslaved nations - Kim Jong Un, the Castro regime, Islamic dictatorships, and others like them - were actually nations. “This coming year we must put it to use to transform our economies, our minds, and our future.” This has been a recurring theme with the UN.
All sorts of companies, non-profit groups, “religious” leaders, “civil society” organizations, Big Oil, and others were tripping over themselves to sign on. At an event featuring Guterres and other top UN bosses, for example, a number of globalist mega-banks with trillions of dollars in combined lending vowed to “put their balance sheets to work” in advancing the warmist agenda. “It shows that banks are becoming increasingly ready to take the bold steps needed to play our part in achieving a low-carbon economy,” said ING CEO Ralph Hamers, one of many cronies jumping on the bandwagon.
Critics and scientists, though, were outraged at all the talk of transformation, citing the pseudo-science underpinning the whole effort. “Why do all the scientists and politicians and rent-seekers continue to play the games of the urgent need to stop CO2 from rising by changing to ‘renewable’ energies while Paris is literally burning because people cannot afford to pay more taxes for nothing in return?” wondered astrophysicist Dr. Willie Soon of the Solar and Stellar Physics (SSP) Division of the Harvard-Smithsonian Center for Astrophysics.
In a statement to The New American, Dr. Soon slammed the anti-energy movement for attacking reliable, cheap and abundant energy while people are in dire need. “How about the energy needs of Africa, India, China and South America: can they all really live purely from the ‘clean’ energy of the Sun and Wind?” he asked. “This is truly a sad tale of third rate scientific studies and fake evidence dressing up to rob the world of cheap and abundant energy.”
Even President Trump slammed the effort to fundamentally transform the world under the guise of climate, too. “The Paris Agreement isn’t working out so well for Paris. Protests and riots all over France,” said Trump on December 8, trolling the UN summit and embattled French President Emmanuel Macron. “People do not want to pay large sums of money, much to third world countries (that are questionably run), in order to maybe protect the environment. Chanting ‘We Want Trump!’ Love France.”
As the UN global-warming alarmists finalize their “rule book” for implementing the UN Paris Agreement and restructuring the world, opposition is growing in tandem worldwide. Trump, incoming Brazilian President Jair Bolsonaro, the anti-warmist tax revolt in France, and other developments hung like a cloud over the COP24 in Katowice. But as has become clear, a wide range of totalitarians from all over the world - socialists, globalists, communists, Islamists, and others - are all hoping to weaponize the “climate” alarm they cooked up to advance their dangerous agenda.
It is not too late to stop them. But Americans must act now.
See how the energy activists has hurt our country in this report CHAMBER BLASTS ANTI-FOSSIL FUEL ACTIVISTS FOR COSTING ECONOMY OVER $91 BILLION IN LOSSES: The Chamber of Commerce and trade unions took aim at anti-fossil fuel activists in a scathing report that concluded that the form of environmentalism slowed economic activity by over $91 billion in the U.S. in 2018.
“Taken together, anti-energy activism has helped prevent at least $91.9 billion of economic activity in the United States, which is larger than the entire economies of 12 states,” according to the report, “Infrastructure Lost: Why America Cannot Afford To ‘Keep It In the Ground’”
-------
Watch Dr. Don Easterbrook address the Washington State Senate committee on Climate Change in 2013.


