Feb 25, 2021
The Never Ending War
By Meteorologist Art Horn
The oceans of the world contain vast quantities of heat. Most of that heat is contained in the upper reaches of the ocean which average 2 miles in depth. In fact, between 30 degrees north of the equator and 30 degrees south of the equator the upper 1000 feet of the ocean contain about 1,000 times more heat energy than the atmosphere!
Due to this extraordinary imbalance, changes in ocean temperature can have a significant impact on atmospheric wind and thermal variations. It is important to remember that the atmosphere of earth is not in balance and it never has been. It is always out of alignment, constantly seeking to find an alignment that will strike a balance between the cold of the polar regions and the heat of the tropics. It will never happen. Forever searching but never finding.
As a result of this never ending battle to find a balance between the cold and the hot, we have weather. The “job” of the weather is to mix the cold and the hot together in an attempt to find atmosphere peace and tranquility. That will never happen either! Constantly searching, always looking but never finding, the atmospheric wars wage on for days, weeks, months, years, centuries, forever.
At times the forces of cold and hot bottle up, bulging at the seams, ready to explode. That’s when the weather machine revs up to another gear. The cold bursts from the arctic, the hot gushes northward, great differences in air pressure and the spinning of the earth whip up gigantic cyclones producing blinding snows, torrential rains, hurricane force winds, floods, tornadoes, frozen pipes and bad air days! And then it’s over. The great expenditure of pent up fury have done their job. The opposing forces shake hands. The sun comes out, the wind is gone and the snow and rain have ended and all that’s left is the cleanup.
Two hundred years ago there was much less to cleanup after the storm than now. The storms were just as severe, just as frequent but we had much less to break. What the storms did break was the food chain. Famine was the ultimate cost paid by the living in those days. A great prosperity has emerged in the last 200 years. Starting with the innovations of the industrial revolution, we now live twice as long as then. We enjoy something that was unknown to most 200 years ago, leisure time and a lifestyle unimaginable to those that lived in the early 19th century.
But with our advancement has come a vulnerability. Even though we now, for the first time in human history have a fighting chance against the atmosphere war machine, we are, in a very real way more vulnerable to the destruction caused by storms than in the simpler times of the past. There’s a lot more to break now than in the past.
There is always a price to pay for anything, and there should be. Our increased vulnerability to weather in some aspects of civilization is just one of those bills we have to pay, like it or not. I for one am willing to pay that bill. There’s nothing like a warm place to live with food on the table and a good internet connection when the snow is falling, the wind is howling and the temperature is plunging, just ask those folks in Texas and the other southern states that felt the wrath of nature’s imbalance this month. Perhaps there is a lesson to be learned from their collective suffering and it might be, If it works, don’t fix it.
Feb 17, 2021
Fighting against aggressive green bills - NH and US
The US house and New Hampshire house and senate have bills pushing a zero emission goal. Since CO2 is not a pollutant and we have shown conclusively that CO2 has no measurable effect on temperatures, this is lunacy given the significant effect it has on energy prices and our ability to heat and cool our homes and drive our cars, we have responded.
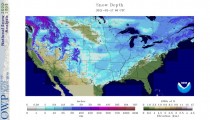
The dump of arctic air to parts of Europe , briefly into China and Japan and this month the central U.S. has shown we need dependable and cheap clean natural gas or nuclear for baseload.
See here in New Hampshire SB71, HB 172, SB115
“The general court finds that New Hampshire’s public health, economy, natural resources and quality of life are threatened by increased air pollution and emissions impacting public health and climate change...based on scientific evidence and health data presented, New Hampshire should develop an emission reduction goal for 2050 of net zero emissions...in order to mitigate the impacts of climate change and protect public health, including the health of New Hampshire’s most vulnerable residents.”
My response is here
The US House bill is even more aggressive and wrong for America.
My response was here
Support Icecap efforts with generous donation via a secure access to Paypal. All work is done pro bono. Be sure to check out the search engine for many stories on any topic. We have 9000 entries with 145 million page views. Our team is fact checking the alarmist claims now that 2020 has ended. We are publishing a paper also on the topic. .
Going to be a wild ride the next few years. Politics and science pushed by globalists and the media are corrupted and young people are being misled by a failing education system. So many honest scientists are being attacked or punished. The battle started nearly 25 years ago when 31,487 American scientists signed this petition, including 9,029 with PhDs. It will continue. It must continue.
----------
Who are the Energy Fools?
By Viv Forbes
They are the fools who though Germany could run its industry on wind and solar energy (they found they needed nuclear from France, gas from Russia and hydro from Scandinavia.)
The same fools thought wind and solar could cope with a polar vortex on the Great Plains.
And they think that with mirrors, windmills, batteries, transmission lines, electric vehicles and hydrogen bubbles, Australia can reach Net Zero without destroying our basic industries.
Nothing can survive ridicule so let’s start the laughter and ridicule.
_thumb.png)
Can you help by reading this ditty anywhere and passing it on to friends, opinion leaders, media contacts or post on any media. And write some yourself. We are in a desperate battle for public opinion. This is just another sneaky shot with a daisy air rifle.
Feb 16, 2021
The Real Polar Temperature and Ice Story
Joseph D’Aleo, CCM and Dr. Don Easterbrook
Wall Street Journal is pushing junk science that will lead to bad policies. The latest is one of the favorite fake scare - disappearing ice. “World’s Ice Is Melting Faster Than Ever, Climate Scientists Say”
Leonard Gaston opined:
Just a dozen years ago On November 28, 2009, the U.K.Telegraph carried this headline: “Climate change: this is the worst scientific scandal of our generation.”
The newspaper went on to say “What we are looking at here is the small group of scientists who have for years been more influential in driving the worldwide alarm over global warming than any others, not least through the role they play at the heart of the UN’s Intergovernmental Panel on Climate Change (IPCC).”
Why would they do this?
On December 1, 2009 The Wall Street Journal answered that question in “Climategate: Follow the Money”:  hil Jones, the director of the Climate Research Unit has been the recipient or co-recipient of some $19 million in research grants just since 2000. The money poured in because the climate alarm kept ringing so loudly.The louder the alarm, the greater the sums. And who better to ring it than people like Mr. Jones, one of its likeliest beneficiaries?”
But why support from the larger scientific community outside the IPCC? The Wall Street Journal went on to say, “Universities, research institutes, advocacy groups, and their various spin-offs and dependents have emerged from the woodwork to receive them. Today these groups form a kind of ecosystem of their own.
As the WSJ explained, “None of these outfits are corrupt...but they depend on an inherently corrupting premise… that the hypothesis on which their livelihood depends has in fact been proved. Absent that proof, everything they represent - including the thousands of jobs they provide - vanishes. That is what’s known as a vested interest, and vested interests are an enemy of sound science.
They have given into heavy pressure from the left and other media. Still they must be confused by this new NASA release here.
Here is our reply to the WSJ:
The Arctic includes the Arctic Ocean, Greenland, Iceland, and part of Siberia and northern Alaska. Because of the absence of any land mass in the Arctic Ocean, most of area lacks glaciers, which require a land mass. Thus, most of the Arctic contains only floating sea ice. Greenland, Iceland, northern Alaska, and northern Siberia contain the only glaciers in the general Arctic region.
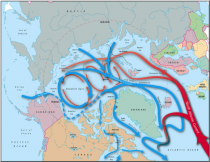
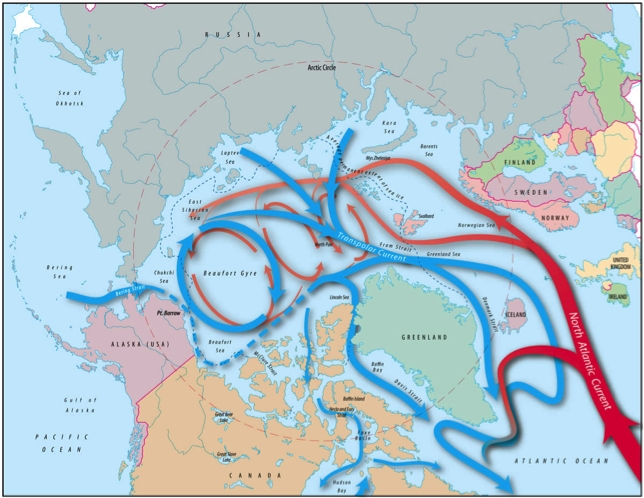
Arctic warming and the melting of the arctic ice are not at all unprecedented (they happen predictably on multidecadal scales with a period of around 60 years) and are in fact entirely natural. Warming results in part from the reduction of arctic ice extent because of flows of warm water into the arctic from the Pacific through the Bering Straits and from the Atlantic from the far North Atlantic Current. The warmer water thins the ice from beneath, slows the refreezing and limits to varying degrees the depth and extent of the ice.
Enlarged
The arctic ice unlike the Glaciers on land in Greenland, the Antarctic and in the world’s mountain ranges is floating on water and the melting has no effect on sea level (much as ice in cold beverages doesn’t cause the liquid to overflow the glass when it melts).
The Monthly Weather Review in 1922 alerted to the start of this warming period “a radical change in climatic conditions, and hitherto unheard-of high temperatures”
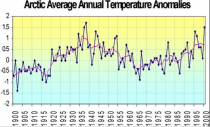
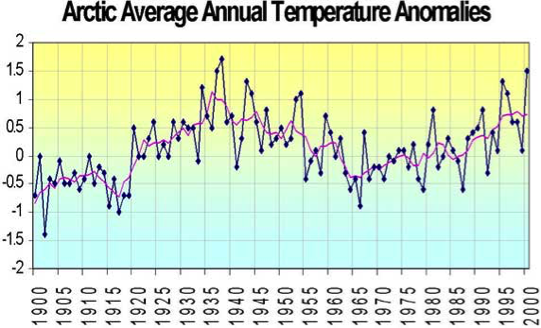
Polyakov et al (2002) created a temperature record using stations north of 62 degrees N. The late 1930s-early 1940s were clearly the warmest of the last century. In addition, the numbers of available observations in the late 1930s-early 1940s (slightly more than 50) is comparable to recent decades.
Enlarged
Arctic Basin wide temperatures (Polyakov 2003)
MULTIDECADAL OCEAN CYCLES AND THE ARCTIC
The Japan Agency for Marine-Earth Science and Technology in Yokosuka, Kanagawa Prefecture observed in a story in Yahoo Asia News in 2005 an ice shrinkage in the western Arctic Ocean from 1997 to 1998 that they attributed to “...by the flow to the area of warm water from the Pacific Ocean, not by atmospheric impact as previously thought”. This was related to the super El Nino of 1997/98. JAMSTEC’s Koji Shimada, the group’s sub-leader, said the shrinkage was particularly severe in the Pacific side of the Arctic Ocean. The ocean]s ratio of area covered with ice during the summer stood at about 60-80 percent from the 1980s to mid-1990s, but it went down to 15-30 percent after 1998, he said. Trenberth (1999) also has acknowledged this warming effect of El Nino on the arctic.
The cycle with respect to arctic temperatures and ice relate to multidecadal cycles in ocean temperatures in both the Pacific (Pacific Decadal Oscillation or PDO) and Atlantic (Atlantic Multidecadal Oscillation or AMO).
Enlarged
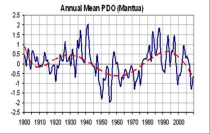
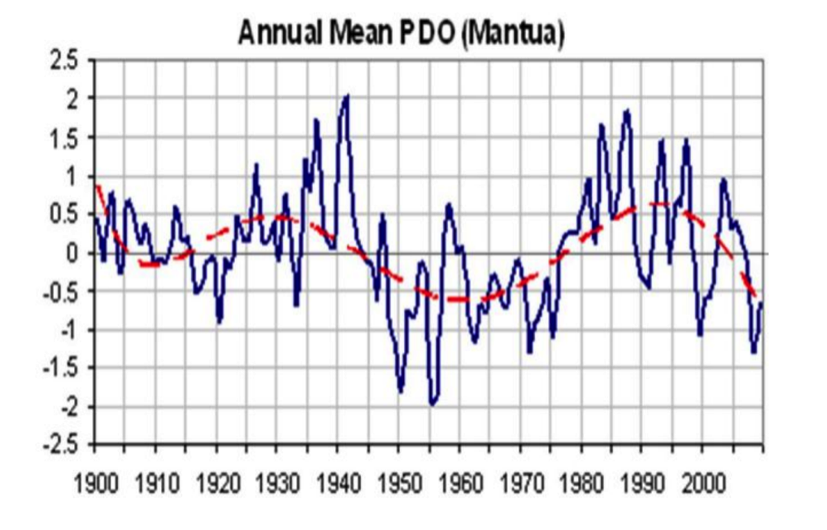
THE PACIFIC DECADAL OSCILLATION (PDO)
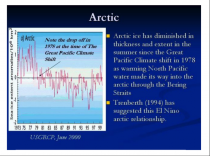
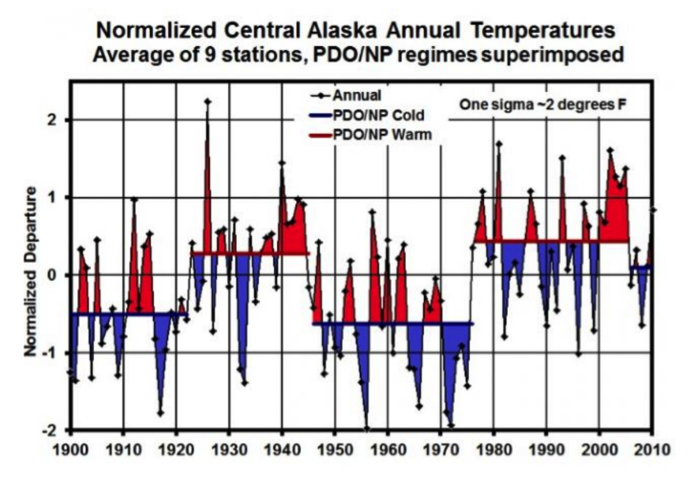
The Pacific warm mode favors more El Ninos and warmer water in the far northern Pacific including the Bering Straits. The PDO flipped into its warm mode in 1978 and the arctic temperatures began to warm and ice began to melt repeating what happened in the 1910s to early 1940s time period.
Enlarged
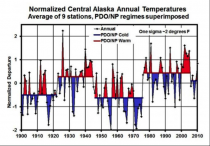
Notice how the temperatures in Alaska go through step changes tied to the PDO (Keen, 2011).
Enlarged
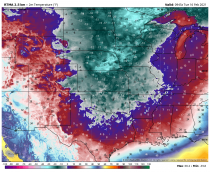
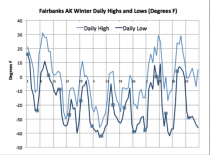
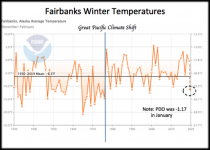
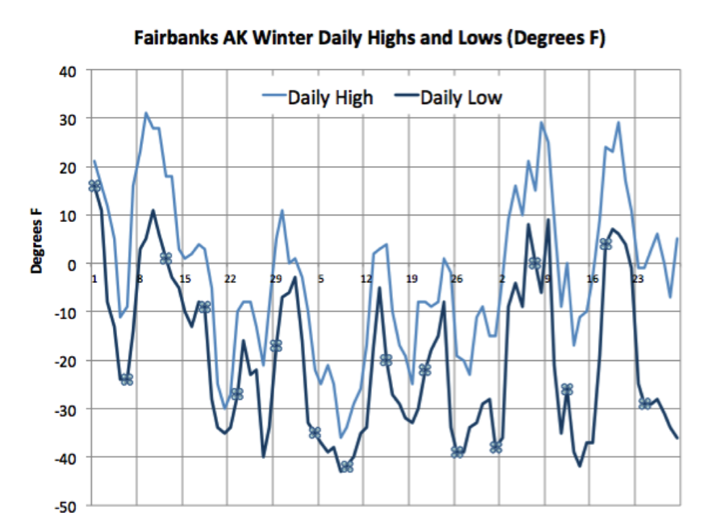
In the winter 0f 2019/20, at Fairbanks average daytime high was -2.1F, while the daytime low -20F, average daily mean was -11F! The coldest was -43F while the warmest was 31F December 9. 33 days were at or below -30F, 5 were at or below -40F. The winter averaged 4.7F below normal, the 3rd coldest since before the Great Pacific Climate Shift (a shift of the so called Pacific Decadal Oscillation to positive) in the late 1970s when warmer Pacific waters favored warmth in Alaska and western North America.
Enlarged
Enlarged
See more on Alaska’s Throwback Winter that hit at the first hint of a negative PDO here.
THE ATLANTIC’S ROLE
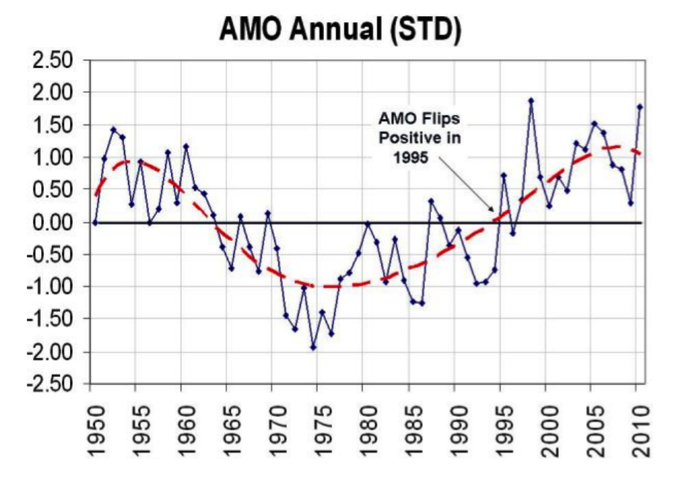
The Atlantic also cycles on a 60-70 year period. The Atlantic Multidecadal Oscillation or AMO returned to the positive warm mode in 1995.
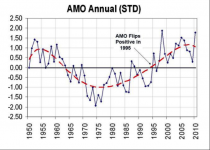
Enlarged
Frances et al. (GRL 2007) showed how the warming in the arctic and the melting ice was related to warm water (+3C) in the Barents Sea moving slowly into the Siberian arctic and melting the ice. She also noted the positive feedback of changed “albedo” due to open water then further enhances the warming.
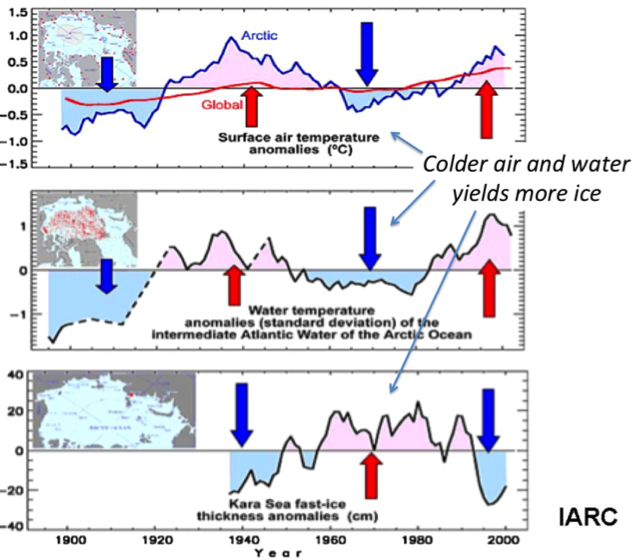
The International Arctic Research Center at the University of Alaska, Fairbanks showed how arctic temperatures have cycled with intrusions of Atlantic water - cold and warm beneath the ice.
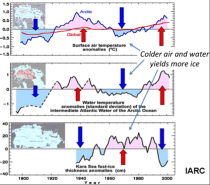
Enlarged
Of the two oceans, for the larger arctic basin, the Atlantic may be more important.
Pryzbylak (2000) says:
“There exists an agreement in estimating temperature tendencies prior to 1950. Practically all (old and new) of the papers which cover this time period concentrate on the analysis of the significant warming which occurred in the Arctic from 1920 to about 1940....In the Arctic, the highest temperatures since the beginning of instrumental observation occurred clearly in the 1930s. Moreover, it has been shown that even in the 1950s the temperature was higher than in the last 10 years.”
“For arctic temperature, the most important factor is a change in the atmospheric circulation over the North Atlantic” The influence of the atmospheric circulation changes over the Pacific (both in the northern end and in the tropical parts) is significantly lower”
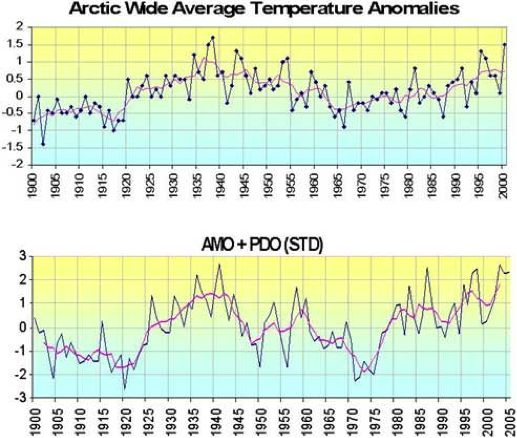
As is the case for US temperatures, the combination of the PDO and AMO Indexes (PDO+AMO) again has considerable explanatory power for Arctic average temperature.
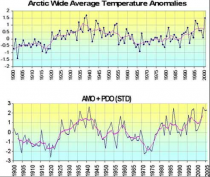
Enlarged
Arctic basin wide temperatures from Polyakov (2003) versus PDO+AMO (STD). Dark blue is annual and purple 5 year running means.
“In approximately the last 140 years, there have been two periods of significant temperature increases in the Arctic. The first began in around 1918-1920 and lasted until 1938 and has been called the ‘1930s warming’ (Bengtsson et al. 2004). Other works have referred to this period as the ‘Early Twentieth Century Warming’ (ETCW, Bronnimann 2009) or the Early Twentieth Century Arctic Warming’ (ETCAW, Wegmann et al. 2017, 2018)
Karlen (2005) reported on historical temperatures in Svalbard (Lufthavn, at 78 deg N latitude), claiming that the area represents a large portion of the Arctic. It is reported that the “mean annual temperature increased rapidly from the 1910s to the late 1930s.” Later, temperatures dropped, “and a minimum was reached around 1970.” Once again, “Svalbard thereafter became warmer, but the mean temperature in the late 1990s was still slightly cooler than it was in the late 1930s.”
Drinkwater (2006) concluded that “in the 1920s and 1930s, there was a dramatic warming of the air and ocean temperatures in the northern North Atlantic and the high Arctic, with the largest changes occurring north of 60N,” which “led to reduced ice cover in the Arctic and subarctic regions and higher sea temperatures.” This was “the most significant regime shift experienced in the North Atlantic in the 20th century.”
Hanna, et al (2006) estimated Sea Surface Temperatures (SSTs) near Iceland over a 119-year period based on measurements made at ten coastal stations located between latitudes 63N and 67N. They concluded that there had been “generally cold conditions during the late nineteenth and early twentieth centuries; strong warming in the 1920s, with peak SSTs typically being attained around 1940; and cooling thereafter until the 1970s, followed once again by warming - but not generally back up to the level of the 1930s/1940s warm period.”
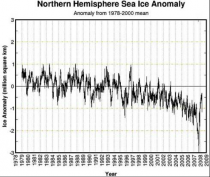
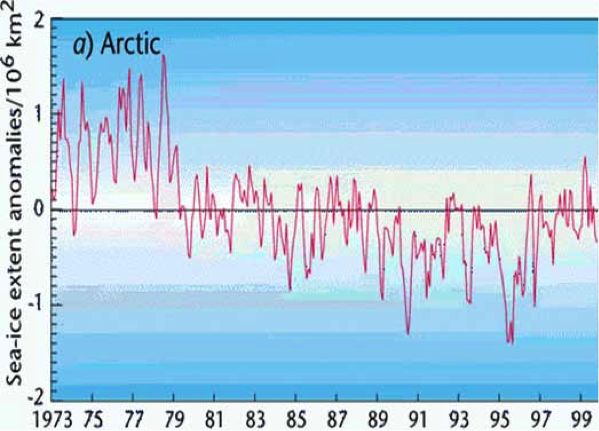
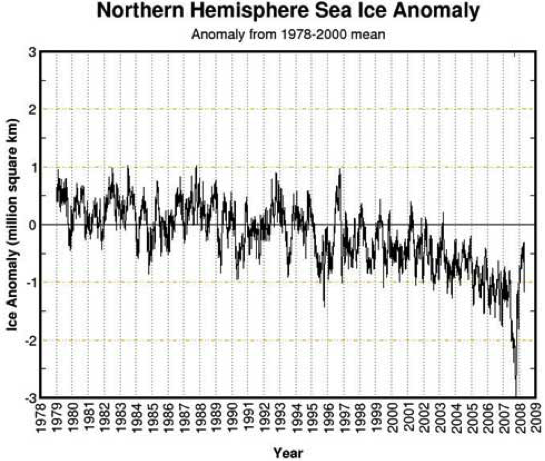
THE EFFECT ON ICE COVER
Both the Atlantic and Pacific play roles in arctic ice extent. The sea ice extent diminished following the Great Pacific Climate Shift (flip of the PDO to positive) in the late 1970s. It stayed relatively stable until early 2000s when a more precipitous decline began, related to a spike in North Atlantic warmth and a positive AO.
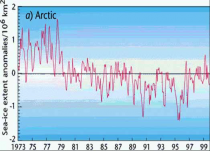
Enlarged
Enlarged
Dmitrenko and Polyokov (2003) observed that warm Atlantic water in the early 2000s from the warm AMO that developed in the middle 1990s had made its way under the ice to off of the arctic coast of Siberia where it thinned the ice by 30% much as it did when it happened in the last warm AMO period from the 1880s to 1930s.
The University of Colorado’s National Snow and Ice Data Center (NSIDC) summarized the role of the ocean cycles very well in October 2007 in this way:
“One prominent researcher, Igor Polyakov at the University of Fairbanks, Alaska, points out that pulses of unusually warm water have been entering the Arctic Ocean from the Atlantic, which several years later are seen in the ocean north of Siberia. These pulses of water are helping to heat the upper Arctic Ocean, contributing to summer ice melt and helping to reduce winter ice growth.
Another scientist, Koji Shimada of the Japan Agency for Marine-Earth Science and Technology, reports evidence of changes in ocean circulation in the Pacific side of the Arctic Ocean. Through a complex interaction with declining sea ice, warm water entering the Arctic Ocean through Bering Strait in summer is being shunted from the Alaskan coast into the Arctic Ocean, where it fosters further ice loss.
Many questions still remain to be answered, but these changes in ocean circulation may be important keys for understanding the observed loss of Arctic sea ice.”
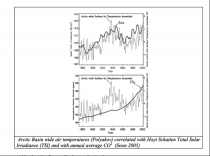
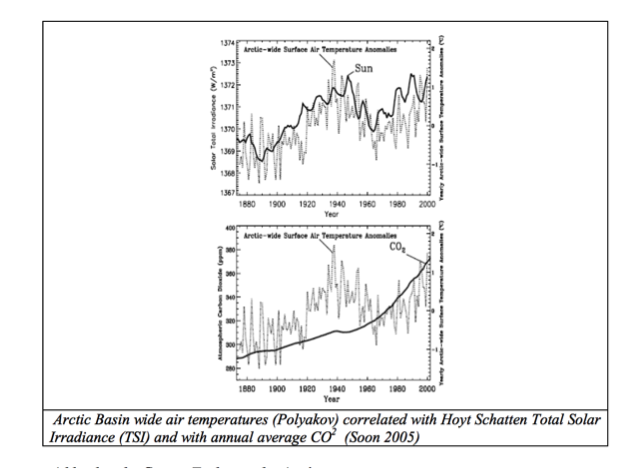
THE SUN AS THE ULTIMATE DRIVER FOR CLIMATE IN ARCTIC
As to the driver for the multidecadal ocean cycles it may well be the solar cycles. Soon (GRL 2005) showed how the Arctic temperatures (Polyakov) correlated extremely well with the total solar irradiance (Hoyt-Schatten) (r-squared of 0.79). This compared to an r-squared correlation of just 0.22 with the CO2.
Enlarged
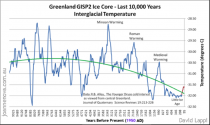
GREENLAND
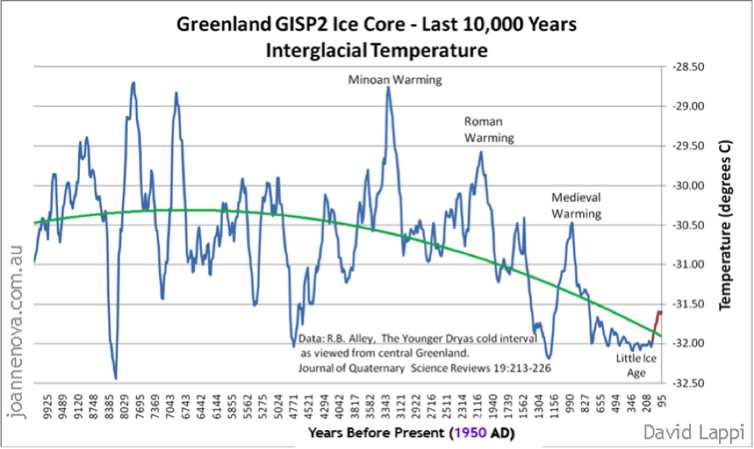
Greenland is often considered a sign of climate change. The data here too suggests it is cyclical and relates to ocean cycles on century scales and longer. Note the current interglacial period ice core data tells us the last 10,000 years shows 1000-year cycles. They have slowly declined as we move towards the end of the interglacial period (usually just over 10,000 years in length). The last warm period called the Medieval Warm Period saw ice retreat in Greenland enough to entice the Vikings to settle Greenland and grow crops including grapes for wine. They abandoned it as we cooled towards the Little Ice Age.
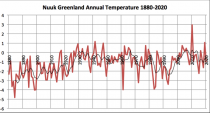
Enlarged
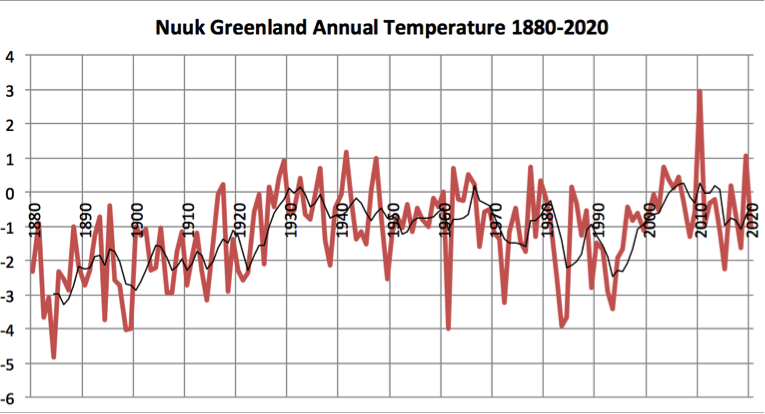
Data from Nuuk in western Greenland shows the greatest warming from 1880 to the 1930s with a secondary warming since the 1990s Atlantic warming.
Enlarged
ANTARCTICA
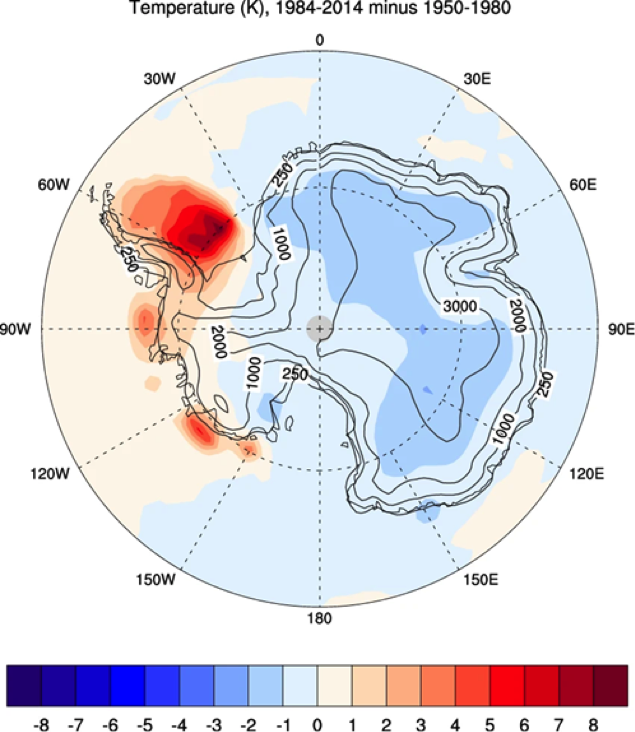
The figure below shows temperature changes during the past 30 years, compared to temperatures recorded between 1950 and 1980. Most of Antarctica is cooling, with warming occurring over just a small portion of the continent that juts out into the Southern Ocean. That region is volcanic with both surface and sea bottom vents. It is also subject to periodic warming from winds that blow downslope and locally warm by compression.
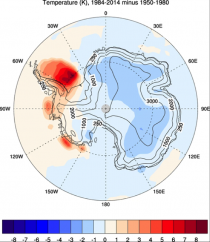
Enlarged
THE ANTARCTIC ICE SHEET IS GROWING, NOT MELTING.
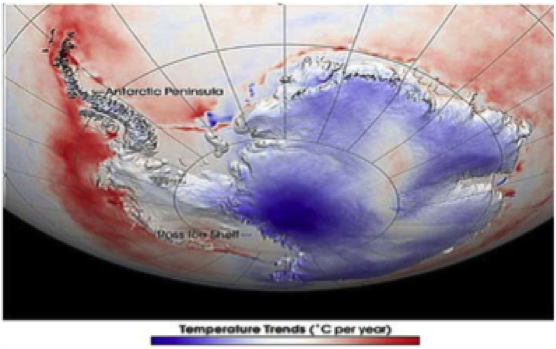
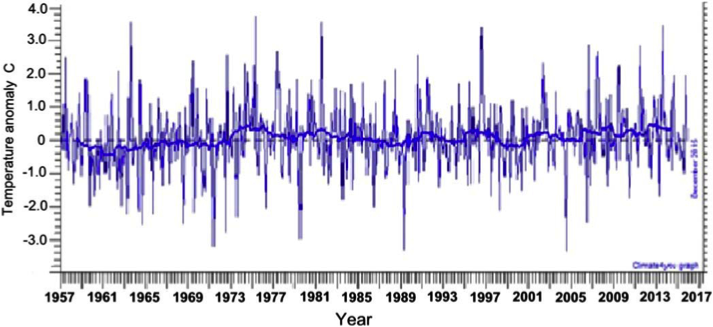
Previous studies showed cooling across all of the much larger East Antarctic Ice Sheet and warming limited to the Antarctic Peninsula of west Antarctica. In 2009, Steig et al. published a controversial paper, “Warming of the Antarctic Ice-Sheet Surface Since the 1957 International Geophysical Year,” in Nature contending that warming instead was occurring.
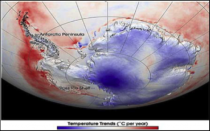
Enlarged
Antarctic temperatures show that Antarctica is cooling, not warming
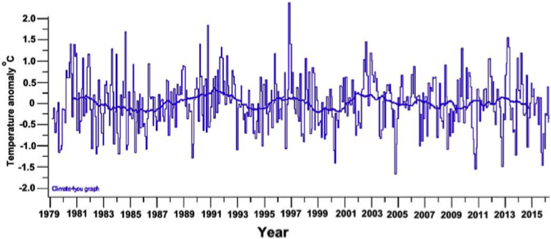
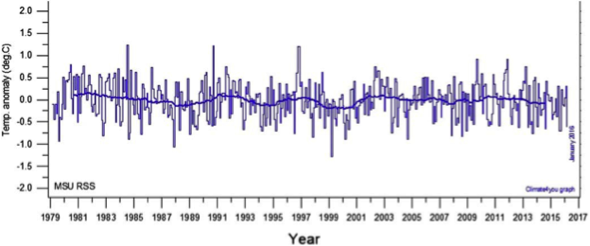
Measured satellite and surface temperatures confirm the lack of warming over most of Antarctica. The UAH and RSS satellite records are the most comprehensive.
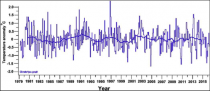
Enlarged
UAH Antarctic satellite temperatures show no warming for 37 years.
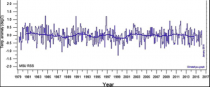
Enlarged
RSS Antarctic satellite temperatures show no warming for 37 year
Enlarged
HADCRUT Antarctic surface temperatures since 1957
The main conclusion to be drawn from these data is that at least 95% of glacial ice in Antarctica is increasing, not melting.
In fact, NASA just released a story saying the ice in defiance of all their models has been increasing here.
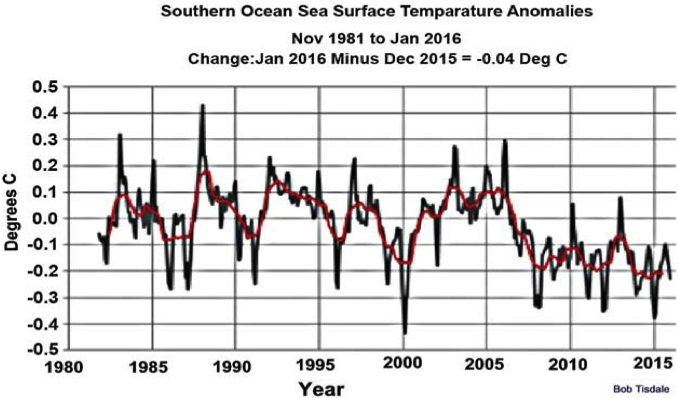
COOLING OF THE SOUTHERN OCEAN AROUND ANTARCTICA
The Southern Ocean around Antarctica has been getting markedly colder since 2006. Sea ice has increased substantially, especially since 2012.
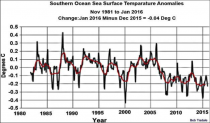
Enlarged
The Southern Ocean showing sharp cooling since 2006.
WEST ANTARCTIC ICE SHEET
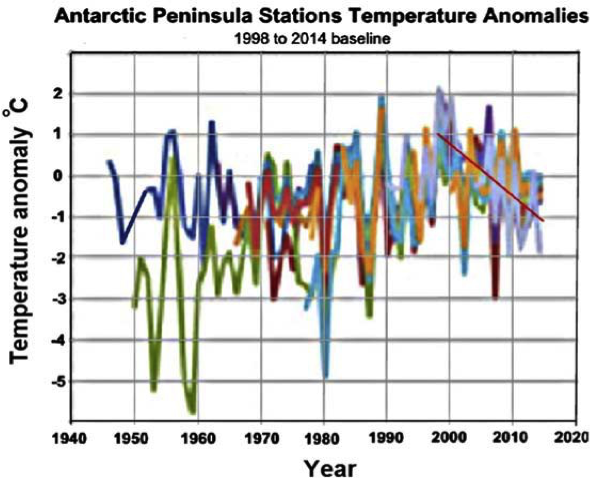
The West Antarctic Ice Sheet occupies a deep basin west of the main East Antarctic Ice Sheet. It comprises only about 8% of glacial ice in Antarctica. The Antarctic Peninsula has been cooling sharply since 2006. Ocean temperatures have been plummeting since about 2007, sea ice has reached all-time highs, and surface temperatures at 13 stations on or near the Antarctic Peninsula have been cooling since 2000. A plot of temperature anomalies at 13 Antarctic stations on or near the Antarctic Peninsula show that the Antarctic Peninsula was warming up until 2000 but has been cooling dramatically since then.
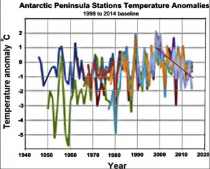
Enlarged
The Larsen Ice Shelf Station has been cooling at an astonishing rate of 1.8 C per decade (18C per century) since 1995. Nearby Butler Island records even faster cooling at 1.9 C/decade. Sea ice around Antarctica is increasing because ocean temperature from the surface to 100 m dropped below the freezing point in 2008 and has stayed there since.
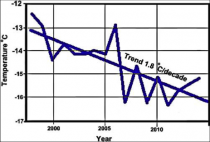
Enlarged
Annual average temperature at the Larsen Ice Shelf shows sharp cooling (1.8C/decade). (Easterbrook, 2016) (From GISTemp.)
SUMMARY
Multidecadal Oscillations in the Pacific and the Atlantic are acknowledged to be the result of natural processes. The warm mode of the Pacific results in warm water off Alaska that can enter the arctic through the Bering Strait and produce arctic ice melt. The warm mode of the AMO also results in warming in the North Atlantic waters, which are carried by the North Atlantic current into the arctic reducing ice depth and extent. When you combine the two cycles, you can explain the temperature and ice cover variances of the past 110 years for the Arctic.
Greenland data suggests the recent warming falls far short of earlier warming periods during the current interglacial and short of the warming early in the 20th century. The Antarctic has cooled and ice has increased in recent years although volcanism near the Antarctic peninsula leads to local water warmth and sea ice melting. Prior to the recent melting, the ice cover reached a long-term record high.
Also we should note that the prescribed melting reported in the Science Journal can’t be claimed a long time record as global ocean data prior to the satellite (1980) and Argo Buoy era (post 2004) is spotty at best.
Even if the claims about water released were true, computations show global sea level would rise just 4 inches/century (agreeing with global data) and not the up to 24 feet promised decades ago. See the sea level story here.
See the full ice story with references here.
Feb 16, 2021
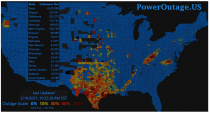
Major cold - similar to 1899 puts millions into the dark. Time to abandon wind energy
Joseph D’Aleo, CCM
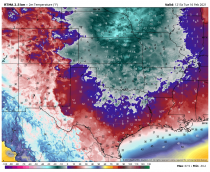
Note the looney Green Dealers are claiming had green energy been in place, this would not happened. Actually it would have been far worse. Wind turbines encased in ice and and snow covered solar panels accounted for 20% of the energy for Texas. ERCOT has some splaining to do. But 100% wind and solar would not have helped.
First it drives up energy costs:
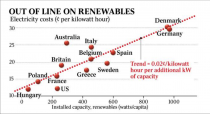
They have found out in other places with similar climate exposure like Germany it is expensive and unreliable and Germany built coal plants and now are buying a natural gas pipeline from Russia to provide reliable base load. France set up a network of safe nuclear plants for that same reason.
See thee real flaws and issues with wind farms here.
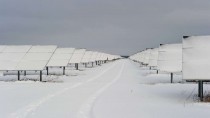
Snow covered the solar farms like recently in Germany below. Photos showing the same in the U.S. can be found on the web.
-------------
Texas: Time To Get Rid Of This Ridiculous Wind Power
Francis Menton, The Manhattan Contrarian
Texas. It is the number one energy producing state in the United States. It is both the largest producer of oil, and the largest producer of natural gas, and has been for decades. Texas also has abundant coal reserves. It has been ground zero of the fracking revolution, which has revolutionized oil and gas production, vastly increased supplies, driven prices down by around two-thirds since 2014, and turned the U.S. into a net energy exporter for the first time in decades. By all rights, Texas should be the shining beacon of fossil fuel energy abundance for everyone else to envy.
And yet in Texas this week, there has been a good blast of cold air, accompanied by some meaningful ice and snow storms, and suddenly Texas finds itself with widespread power blackouts covering much of the state. Although the levels of cold and ice have been somewhat unusual, they have also been well within the range of historical experience. Meanwhile, other states farther north have been colder and have had more snow and more ice and yet the power has not gone out. What gives?
The simple answer is that despite its great abundance of fossil fuel energy, Texas nevertheless fell big for the ridiculous scam of trying to produce a high percentage of its electricity from wind. Yes, the story is somewhat more complicated than that, as stories always are. But not much more complicated. Basically, with its grid stressed in many ways in the past week, the wind was useless to carry the load that needed to be carried.
The Wall Street Journal in an editorial today collects some basic data from Texas as to electricity supply capacity and usage. Total winter generation capacity for the state is about 83 GW, while peak winter usage is about 57 GW. That’s a margin of over 45% of capacity over peak usage. In a fossil-fuel-only or fossil-fuel-plus-nuclear system, where all sources of power are dispatchable, a margin of 20% would be considered normal, and 30% would be luxurious. This margin is well more than that. How could that not be sufficient?
The answer is that Texas has gone crazy for wind. About 30 GW of the 83 GW of capacity are wind. That means that even if all the fossil fuel and nuclear facilities are running at full tilt, you still need at least some wind at all times. And the fossil-fuel and nuclear facilities are not going to run all the time at full tilt. You are going to have scheduled outages, and also breakdowns from time to time. That’s why you would like to have a margin of up to 30%. It turns out that the cold weather and icy conditions brought some serious breakdowns on the fossil fuel side.
So how how did the wind do at covering the gaps? The answer is, it’s completely useless. From the WSJ:
Winds this past month have generated between about 600 and 22,500 MW. Regulators don’t count on wind to provide much more than 10% or so of the grid’s total capacity since they can’t command turbines to increase power like they can coal and gas plants.
Yes, sometimes the wind turbines only generate at a rate of 600 MW - which is about 2% of their capacity. And you never know when that’s going to be.
Texas has its own electrical grid, run by something called the Electric Reliability Council of Texas (ERCOT). ERCOT of course is probably the single most responsible entity for Texas getting into a situation of great over-reliance on intermittent wind energy. Thus it is not surprising that ERCOT is spinning like a top to try to make it look like its own bad bet on wind energy has not been the main cause of the current disaster. The official line is that the “great majority” of power facility “outages” in Texas over the past week have been other than wind facilities. For example, here we have an article from Renewable Energy Magazine today with the headline “ERCOT finds that frozen wind turbines were the least significant factor in Texas blackouts.” Excerpt:
The Electric Reliability Council of Texas (ERCOT) has released data showing that the vast majority of power plant outages in Texas were gas-fired generators. As multiple experts have documented, the vast majority of power plant capacity outages in Texas are at gas generators. Read more at
Texas: Time To Get Rid Of This Ridiculous Wind Power
Jan 03, 2021
Causation Of Climate Change, And The Scientific Method
Francis Menton, Manhattan Contrarian
Let’s have yet another go at trying to apply the scientific method to the subject of causation of climate change. This is just basic logic, and not that complicated. We can do it.
As simple and basic as this is, you will shortly see that the agglomeration of all of the world’s leading “climate scientists” can’t figure it out. They are completely lost and befuddled. Check me and see if I’m wrong.
The proposition we are addressing is the one for which you see a constant drumbeat of advocacy. It runs something like, “the climate is changing, and we are the cause.” OK, nobody denies that the climate is changing; but how about the “we are the cause” part? What is the proof?
Let’s apply the scientific method. We start with the basic maxim that “correlation does not prove causation.” Instead, causation is established by disproof of all relevant alternative ("null") hypotheses.
Everybody knows how this works from drug testing. We can’t prove that drug A cures disease X by administering drug A a thousand times and observing that disease X almost always goes away. Disease X might have gone away for other reasons, or on its own. Even if we administer drug A a million times, and disease X almost always goes away, we have only proved correlation, not causation. To prove causation, we must disprove the null hypothesis by testing drug A against a placebo. The placebo represents the null hypothesis that something else (call it “natural factors") is curing disease X. When drug A is significantly more effective at curing disease X than the placebo, then we have disproved the null hypothesis, and established, at least provisionally, the effectiveness of drug A.
Back to climate change. The hypothesis is “humans are causing significant climate change.” An appropriate null hypothesis would be “observed climate change can be fully explained by some combination of natural factors.” How might you test this?
Read more here
--------
The Upcoming Biden Administration Calls For Extreme Levels Of Reality Denial
December 18, 2020/ Francis Menton
The Upcoming Biden Administration Calls For Extreme Levels Of Reality Denial
As discussed here in a recent post, being a climate “believer” requires basic refusal to deal with the real world as it exists. And no matter how crazy it has been up to now, with the incoming Biden administration, get ready for the make believe to move up to a whole new level.
Can we actually change the weather by throwing trillions of taxpayer dollars into windmills and solar panels? That’s what we are all now going to pretend. Kim Strassel sees where it’s going in today’s Wall Street Journal:
[I]t’s all about green. Climate will be the driving priority of this White House - Mr. Biden’s make-nice to progressives. He’ll have a climate envoy ( John Kerry ), a climate czar ( Gina McCarthy ), and climate obsessives leading every department ( Janet Yellen, Pete Buttigieg, Jennifer Granholm ).
So suppose you run a big oil company....
Read more here.
---------------
Where Is The Criticism Of China From Environmentalists?
December 14, 2020/ Francis Menton
You undoubtedly are aware that the international environmental movement has almost entirely been taken over and consumed by the climate change scare; and you also cannot help but be aware of the constant drumbeat of attacks by environmentalists on the U.S. government, particularly under President Trump, for its failure to reduce carbon emissions sufficiently to “save the planet.”
At the same time, you are a reader of the Manhattan Contrarian. Therefore, you know that China is not only not reducing its own carbon emissions, but instead has well more than tripled them over the past twenty years (during which period U.S. emissions have declined modestly by about 15%); and today China is in the midst of a new round of massive expansion of its fossil fuel energy generation capacity, particularly with respect to the most carbon-intensive fuel, coal…
So then surely the major environmental organizations must be coming down hard on China? Wrong.
Read more here.
--------
Note see this excellent library of 27 stories on scientific fraud that Buddy has compiled.
October 05, 2020/ Francis Menton
The Greatest Scientific Fraud Of All Time—Part XXVII
It has been more than a year since I last added a post to this series. The previous post in the series, Part XXVI, appeared on August 20, 2019. For all of the prior twenty-six posts, go to this composite Link.
There are two reasons for a new post at this time. The first is that there is some new work out from a guy named Tony Heller. The new work can be found at Heller’s website here, with a date of October 1. Heller also indicates that he intends to continue to add to and supplement this work.
Heller is an independent researcher who particularly focuses on the subject of this series: alterations to past government climate data to create an impression of warming that does not exist in the data as originally reported.
Heller is quite skilled at going through reams of government climate data, and turning those data into useful graphs to demonstrate his points.

