

Joseph D’Aleo, CCM
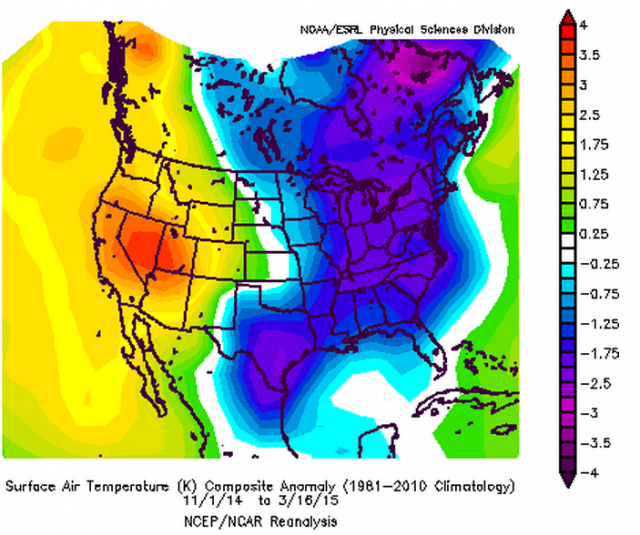
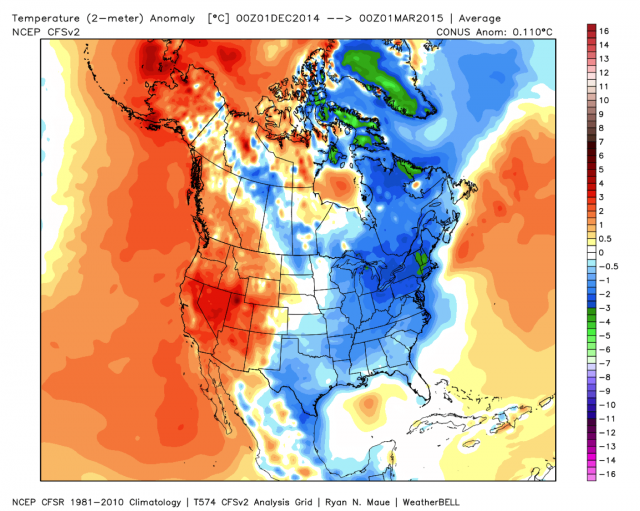
For populous areas from the south central to the Great Lakes and east coast, it has been a very cold winter season (November 1 through mid March).

The Jack Rabbits in the southern intermountain west have enjoyed a warmer cold season. Yes our friends in the Pacific Northwest and California into the Rockies have gotten off easier thanks to the warm eastern Pacific, the driver for the warm (and dry) west and cold east much like the late 1970s and the 1916-1918 winters.
The late winter will only increase the negative anomalies in the northeast and Mid Atlantic including the eastern Lakes.
February was the most extreme winter month.
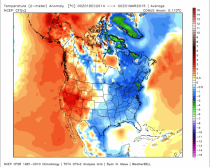
The dichotomy peaked in late winter with 6 states in the west under the ridge at or near warmest February while 23 states in the east and central had a top 10 coldest February and 9 states the 2nd coldest. Several cities in the Northeast had their coldest month of any month on record including Buffalo, New York where the monthly average temperature was 10.9F, dipping below the 11.6F observed in February 1934. Several additional cities, including Chicago, Illinois and Cleveland, Ohio observed their coldest February on record.
The western U.S. was warmer than average, where eight states had a top 10 warm February. Arizona, California, Utah, and Washington each had their warmest February on record.
During February, there were 5,448 warm daily temperature records (2,866 daily warm maximum temperature records and 2,582 daily warm minimum temperature records) broken or tied while there were 8,281 cold daily temperature records (4,778 daily cold maximum temperature records and 3,503 daily cold minimum temperature records) broken or tied.
For the winter, thanks to a warmer December (that followed on the heels of a frigid November), the average was in the top 10% percent coldest east and near warmest west.
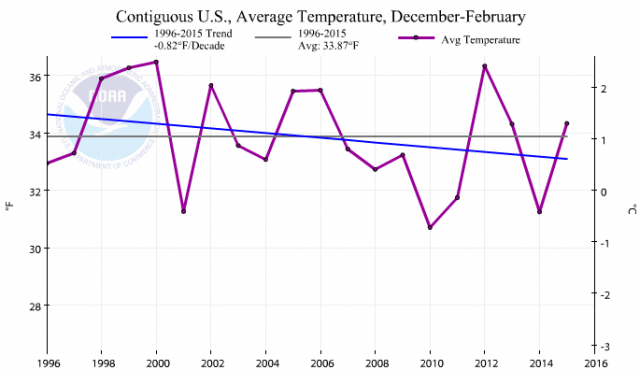
According to NOAA, the winter contiguous U.S. temperature was 34.3F, 2.1F above the 20th century average, the 19th warmest winter on record.
According to the data that goes into the models 4 times a day, the CONUS anomaly was only 0.2F above the 1981 to 2010 climatology. NOAAs (and NASA’s which starts with NOAA data) high rankings have been accomplished by significant cooling of the early century in the adjusted data. This lowers the average and increases the apparent warming.
Even so, the trend for temperatures for the winter for the United States the last 20 years has been down - at a cooling rate of 8.2F/century.
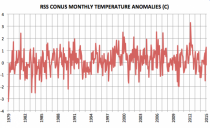
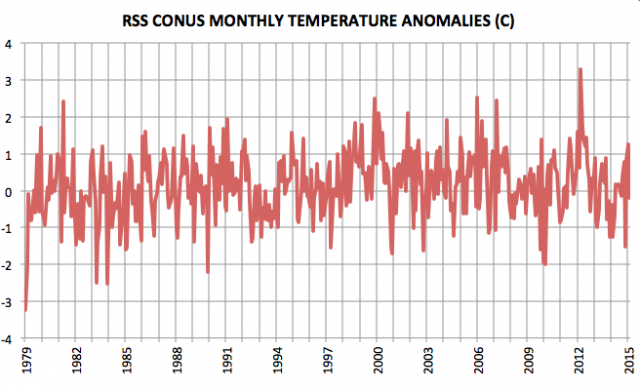
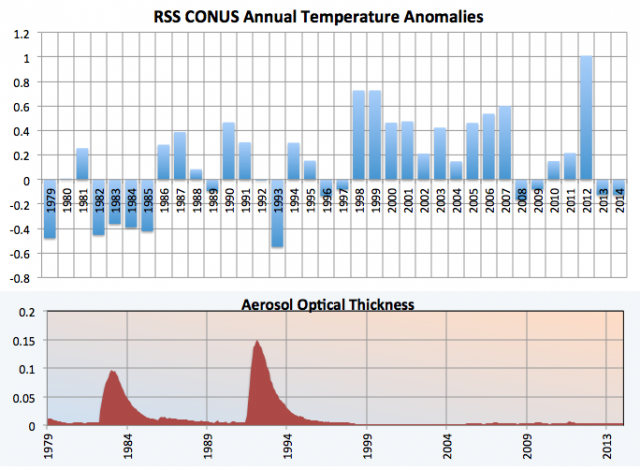
Satellite monthly CONUS temperatures do not show a significant trend since 1979. Outliers included the frigid early 1979 months and the 2012 spring spike.

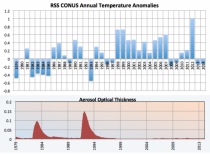
Plotting the CONUS annual temperatures you can see a pop after the super El Nino of 1997/98 then with the exception of the warm 2012 a drop off.
The volcanic cooling of the early 1980s and 1990s can be seen.
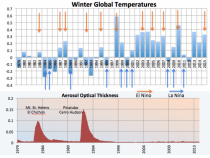
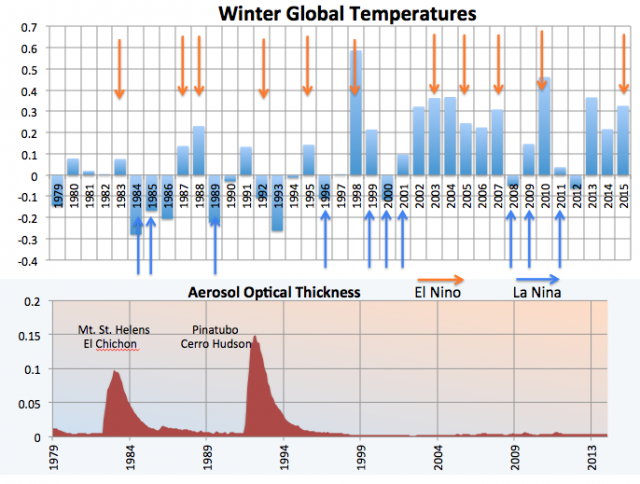
You can explain all the lower troposphere global winter bumps and dips and trends with volcanoes and El Nino and La Nina (also the AMO was positive after the middle 1990s). Satellites tell us it was the 6th warmest ever not the first or second warmest as the surface temperature data sets (contaminated by UHI and land use changes and poor siting) suggest. If we had satellite temperatures going back to the 1895 data start, you would see the recent warming pale in comparison
to the 1930s to 1950s.
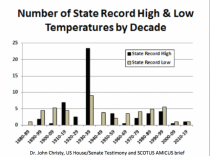
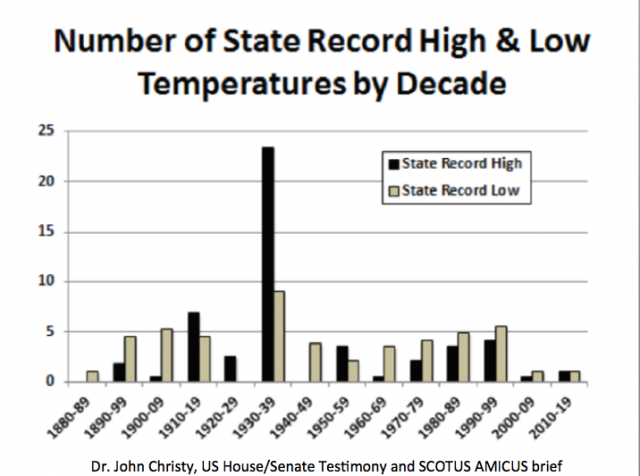
How can we know? The only unadjusted surface data set is the record highs and lows for the states. They show 23 of the 50 record highs from the 1930s and 38 before 1960. They show more all time records since the 1940s.
I have seen emails suggesting they would like to modify this inconvenient data set but they have no excuse to do it as the Time of Observation adjustment that does much of the adjustment (cooling early decades and warming later) is said to prevent double counting a high two straight days. For all-time records, this doesn’t matter. Homogenization, the other ‘blending’ trick also makes no sense when looking for record cold or warm records.
After March is done and available we will recap the entire cold season.
See stories like this daily on weatherbell.com.
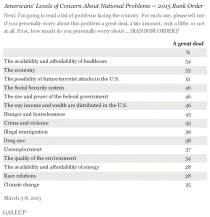
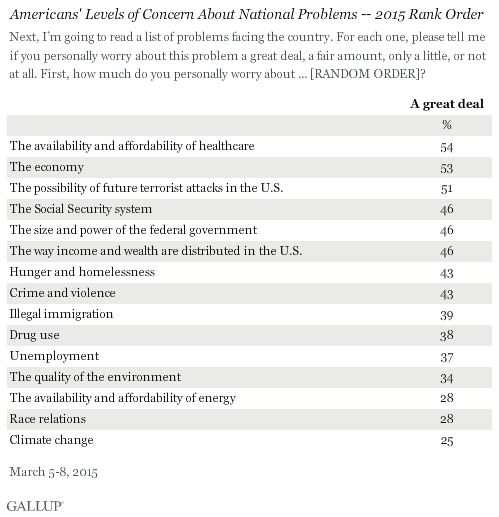
See also how Gallup reports the public believes Climate Change is the lowest priority.
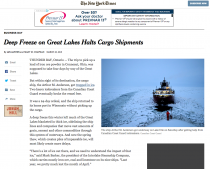
The Great Lakes ice has been again above normal.


The historical seasonal fell short of last year but was above normal and second highest since 1995/96. Back to back years at this level is unprecedented in the record.
It is having its effect on navigation and cargo shipments again in the eastern lakes which were hardest hit.
Read full story here.