

By Patrick J. Michaels
Imagine if there were no reliable records of global surface temperature. Raucous policy debates such as cap-and-trade would have no scientific basis, Al Gore would at this point be little more than a historical footnote, and President Obama would not be spending this U.N. session talking up a (likely unattainable) international climate deal in Copenhagen in December.
Steel yourself for the new reality, because the data needed to verify the gloom-and-doom warming forecasts have disappeared.
Or so it seems. Apparently, they were either lost or purged from some discarded computer. Only a very few people know what really happened, and they aren’t talking much. And what little they are saying makes no sense.
In the early 1980s, with funding from the U.S. Department of Energy, scientists at the United Kingdom’s University of East Anglia established the Climate Research Unit (CRU) to produce the world’s first comprehensive history of surface temperature. It’s known in the trade as the “Jones and Wigley” record for its authors, Phil Jones and Tom Wigley, and it served as the primary reference standard for the U.N. Intergovernmental Panel on Climate Change (IPCC) until 2007. It was this record that prompted the IPCC to claim a “discernible human influence on global climate.”
Putting together such a record isn’t at all easy. Weather stations weren’t really designed to monitor global climate. Long-standing ones were usually established at points of commerce, which tend to grow into cities that induce spurious warming trends in their records. Trees grow up around thermometers and lower the afternoon temperature. Further, as documented by the University of Colorado’s Roger Pielke Sr. (and Anthony Watts), many of the stations themselves are placed in locations, such as in parking lots or near heat vents, where artificially high temperatures are bound to be recorded.
So the weather data that go into the historical climate records that are required to verify models of global warming aren’t the original records at all. Jones and Wigley, however, weren’t specific about what was done to which station in order to produce their record, which, according to the IPCC, showed a warming of 0.6 +/- 0.2C in the 20th century.
Now begins the fun. Warwick Hughes, an Australian scientist, wondered where that “+/-” came from, so he politely wrote Phil Jones in early 2005, asking for the original data. Jones’s response to a fellow scientist attempting to replicate his work was, “We have 25 years or so invested in the work. Why should I make the data available to you, when your aim is to try and find something wrong with it?”
Reread that statement, for it is breathtaking in its anti-scientific thrust. In fact, the entire purpose of replication is to “try and find something wrong.” The ultimate objective of science is to do things so well that, indeed, nothing is wrong.
Then the story changed. In June 2009, Georgia Tech’s Peter Webster told Canadian researcher Stephen McIntyre that he had requested raw data, and Jones freely gave it to him. So McIntyre promptly filed a Freedom of Information Act request for the same data. Despite having been invited by the National Academy of Sciences to present his analyses of millennial temperatures, McIntyre was told that he couldn’t have the data because he wasn’t an “academic.” So his colleague Ross McKitrick, an economist at the University of Guelph, asked for the data. He was turned down, too.
Faced with a growing number of such requests, Jones refused them all, saying that there were “confidentiality” agreements regarding the data between CRU and nations that supplied the data. McIntyre’s blog readers then requested those agreements, country by country, but only a handful turned out to exist, mainly from Third World countries and written in very vague language.
It’s worth noting that McKitrick and I had published papers demonstrating that the quality of land-based records is so poor that the warming trend estimated since 1979 (the first year for which we could compare those records to independent data from satellites) may have been overestimated by 50 percent. Webster, who received the CRU data, published studies linking changes in hurricane patterns to warming (while others have found otherwise).
Enter the dog that ate global warming.
Roger Pielke Jr., an esteemed professor of environmental studies at the University of Colorado, then requested the raw data from Jones. Jones responded:
Since the 1980s, we have merged the data we have received into existing series or begun new ones, so it is impossible to say if all stations within a particular country or if all of an individual record should be freely available. Data storage availability in the 1980s meant that we were not able to keep the multiple sources for some sites, only the station series after adjustment for homogeneity issues. We, therefore, do not hold the original raw data but only the value-added (i.e., quality controlled and homogenized) data.
The statement about “data storage” is balderdash. They got the records from somewhere. The files went onto a computer. All of the original data could easily fit on the 9-inch tape drives common in the mid-1980s. I had all of the world’s surface barometric pressure data on one such tape in 1979.
If we are to believe Jones’s note to the younger Pielke, CRU adjusted the original data and then lost or destroyed them over twenty years ago. The letter to Warwick Hughes may have been an outright lie. After all, Peter Webster received some of the data this year. So the question remains: What was destroyed or lost, when was it destroyed or lost, and why?
All of this is much more than an academic spat. It now appears likely that the U.S. Senate will drop cap-and-trade climate legislation from its docket this fall - whereupon the Obama Environmental Protection Agency is going to step in and issue regulations on carbon-dioxide emissions. Unlike a law, which can’t be challenged on a scientific basis, a regulation can. If there are no data, there’s no science. U.S. taxpayers deserve to know the answer to the question posed above. Read more here.
By Jenniffer Marohasy
Update: Keith Briffa responds on Climate Audit here.
MOST scientific sceptics have been dismissive of the various reconstructions of temperature which suggest 1998 is the warmest year of the past millennium. Our case has been significantly bolstered over the last week with statistician Steve McIntyre finally getting access to data used by Keith Briffa, Tim Osborn and Phil Jones to support the idea that there has been an unprecedented upswing in temperatures over the last hundred years - the infamous hockey stick graph.
Mr McIntyre’s analysis of the data - which he had been asking for since 2003 - suggests that scientists at the Climate Research Unit of the United Kingdom’s Bureau of Meteorology have been using only a small subset of the available data to make their claims that recent years have been the hottest of the last millennium. When the entire data set is used, Mr McIntyre claims that the hockey stick shape disappears completely. (Yamal: A “Divergence” Problem, by Steve McIntyre, 27 September 2009)
Mr McIntyre has previously showed problems with the mathematics behind the ‘hockey stick’. But scientists at the Climate Research Centre, in particular Dr Briffa, have continuously republished claiming the upswing in temperatures over the last 100 years is real and not an artifact of the methodology used - as claimed by Mr McIntyre. However, these same scientists have denied Mr McIntyre access to all the data. Recently they were forced to make more data available to Mr McIntyre after they published in the Philosophical Transactions of the Royal Society - a journal which unlike Nature and Science has strict policies on data archiving which it enforces.
This week’s claims by Steve McInyre that scientists associated with the UK Meteorology Bureau have been less than diligent are serious and suggest some of the most defended building blocks of the case for anthropogenic global warming are based on the indefensible when the methodology is laid bare.
This sorry saga also raises issues associated with how data is archived at the UK Meteorological Bureau with in complete data sets that spuriously support the case for global warming being promoted while complete data sets are kept hidden from the public - including from scientific sceptics like Steve McIntyre.
It is indeed time leading scientists at the Climate Research Centre associated with the UK Meteorological Bureau explain how Mr McIntyre is in error or resign. See post here.
See also Treemometers, A New Scientific Scandal by Andrew Orlowski here. See also Bishop Hill’s excellent summary here.
Icecap Note: Right on target Jennifer, and the resignations should extend to the the corresponding scientists at NOAA and NASA GISS that have been shown by Steve and many others on his Climate Audit site and Anthony Watts’ Watts Up with That site and many others to have manipulated the data and in NOAA’s case to have led the charge on the embarrassing CCSP to forward their careers, their agendas and the agenda of those that are funding this perversion of science. It should also extend to the editors of the journals that have perverted the peer review process and the national societies who have taken on policy advocacy as a major goal when they should be advocates instead of good science. The UN IPCC should be disbanded after failing at Copenhagen. AR4 should be the last in the sorry series. Now is the time to take the gloves off. Now is time to have our voice heard loud and clear. Like they used to say when I was a small boy in Brooklyn, time to “throw them bums out”.
By Gerard Wynn, Reuters
Global temperatures may be 4 degrees Celsius hotter by the mid-2050s if current greenhouse gas emissions trends continue, said a study published on Monday. The study, by Britain’s Met Office Hadley Centre, echoed a U.N. report last week which found that climate changes were outpacing worst-case scenarios forecast in 2007 by the U.N.’s Intergovernmental Panel on Climate Change (IPCC).
“Our results are showing similar patterns (to the IPCC) but also show the possibility that more extreme changes can happen,” said Debbie Hemming, co-author of the research published at the start of a climate change conference at Oxford University. Leaders of the main greenhouse gas-emitting countries recognised in July a scientific view that temperatures should not exceed 2 degrees above pre-industrial levels, to avoid more dangerous changes to the world’s climate.
The IPCC shared the 2007 Nobel Peace Prize for its fourth assessment report, or AR4. One finding was that global temperatures could rise by 4 degrees by the end of the 2050s. Monday’s study confirmed that warming could happen even earlier, by the mid-2050s, and suggested more extreme local effects. “It’s affirming the AR4 results and also confirming that it is likely,” Hemming told Reuters, referring to 4 degrees warming, assuming no extra global action to cut emissions in the next decade.
One advance since 2007 was to model the effect of “carbon cycles”. For example, if parts of the Amazon rainforest died as a result of drought, that would expose soil which would then release carbon from formerly shaded organic matter. “That amplifies the amount of carbon dioxide that goes into the atmosphere and therefore the global warming. It’s really leading to more certainty,” said Hemming.
DRASTIC
Some 190 countries will try to reach an agreement on how to slow global warming at a meeting in Copenhagen in December. Chinese President Hu Jintao won praise for making a commitment to limit emissions growth by a “notable” amount, at a U.N. climate summit in New York last week. Other leaders made pledges to agree a new climate pact. Temperature rises are compared with pre-industrial levels. The world warmed 0.7 degrees last century, scientists say.
A global average increase of 4 degrees masked higher regional increases, including more than 15 degrees warmer temperatures in parts of the Arctic, and up to 10 degrees higher in western and southern Africa, Monday’s study found. “It’s quite extreme. I don’t think it’s hit home to people,” said Hemming. As sea ice melts, the region will reflect less sunlight, which may help trigger runaway effects. Such higher Arctic temperatures could also melt permafrost, which until now has trapped the powerful greenhouse gas methane, helping trigger further runaway effects, said Hemming. “There are potentially quite big negative implications.”
The study indicated rainfall may fall this century by a fifth or more in part of Africa, Central America, the Mediterranean, and coastal Australia, “potentially more extreme” than the IPCC’s findings in 2007. “The Mediterranean is a very consistent signal of significant drying in nearly all the model runs,” said Hemming. A 20 percent or more fall is “quite a lot in areas like Spain already struggling with rainfall reductions in recent years.” Read more here.
Does this look like model affirmation to you? By the way they offer a full money back guarantee on their 50 and 100 year forecasts.
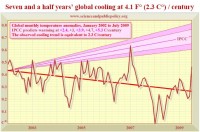
Enlarged here.
See more by P.J. Gladnick on this here.
Also the UKMO has issued their winter forecast - Preliminary indications continue to suggest that winter temperatures are likely to be near or above average over much of Europe including the UK. Winter 2009/10 is likely to be milder than last year for the UK, but there is still a 1 in 7 chance of a cold winter.
----------------------
UPDATE: SEE IMPORTANT POST on Climate Audit “Yamal: A “Divergence” Problem”
By Steve McIntyre
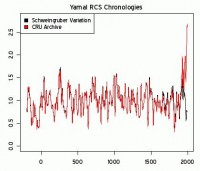
The graphic below is, in my opinion, one of the most disquieting images ever presented at Climate Audit. Two posts ago, I observed that the number of cores used in the most recent portion of the Yamal archive at CRU was implausibly low. There were only 10 cores in 1990 versus 65 cores in 1990 in the Polar Urals archive and 110 cores in the Avam-Taymir archive. These cores were picked from a larger population - measurements from the larger population remain unavailable. One post ago, I observed that Briffa had supplemented the Taymir data set (which had a pronounced 20th century divergence problem) not just with the Sidorova et al 2007 data from Avam referenced in Briffa et al 2008, but with a Schweingruber data set from Balschaya Kamenka (russ124w), also located over 400 km from Taymir.
Given this precedent, I examined the ITRDB data set for potential measurement data from Yamal that could be used to supplement the obviously deficient recent portion of the CRU archive (along the lines of Brifffa’s supplementing the Taymir data set.) Sure enough, there was a Schweingruber series that fell squarely within the Yamal area - indeed on the first named Khadyta River - russ035w located at 67 12N 69 50Eurl . This data set had 34 cores, nearly 3 times more than the 12 cores selected into the CRU archive. Regardless of the principles for the selection of the 12 CRU cores, one would certainly hope to obtain a similar-looking RCS chronology using the Schweingruber population for living trees in lieu of the selection by CRU (or whoever).
The graphic compares the RCS chronologies from the two slightly different data sets: red - the RCS chronology calculated from the CRU archive (with the 12 picked cores); black - the RCS chronology calculated using the Schweingruber Yamal sample of living trees instead of the 12 picked trees used in the CRU archive [leaving the rest of the data set unchanged i.e. all the subfossil data prior to the 19th century]. The difference is breathtaking (enlarged here).
As CA readers also know, until recently, CRU staunchly refused to provide the measurement data used in Briffa’s Yamal reconstruction. Science(mag) acquiesced in this refusal in connection with Osborn and Briffa 2006. While the Yamal chronology was used in a Science article, it originated with Briffa 2000 and Science(mag) took the position that the previous journal (which had a different data policy) had jurisdiction. Briffa used the chronology Briffa et al (Phil Trans B, 2008) and the Phil Trans editors finally seized the nettle, requiring Briffa to archive the data. As noted before, Briffa asked for an extension and, when I checked earlier this year, the Yamal measurement data remained unarchived. A few days ago, I noticed that the Yamal data was finally placed online. With the information finally available, this analysis has only taken a few days.
If the non-robustness observed here prove out (and I’ve provided a generating script), this will have an important impact on many multiproxy studies that have relied on this study. Read full post here.