

Another Moonwalker Dissents: NASA Astronaut Dr. Buzz Aldrin rejects global warming fears: ‘The climate has been changing for billions of years’
By Marc Morano, Climate Depot
Washington, DC - At a House global warming hearing on Capitol Hill on April 24, 2009, former Vice President Al Gore once again compared skeptics of man-made climate fears to “people who still believe that the moon landing was staged on a movie lot in Arizona.” Gore appears ignorant that his several years old analogy has been refuted by two of NASA’s moonwalkers themselves—Moonwalker and Award-Winning NASA Astronaut/Geologist Jack Schmitt - who recently declared he was a global warming skeptic and now, Award-Winning NASA Astronaut and Moonwalker Dr. Buzz Aldrin.

Dr. Buzz Aldrin
Gore was not asked during his April 24, 2009 Congressional hearing how he can link climate skeptics to people who believed the moon landing as “staged” when two prominent moonwalkers themselves are man-made global warming skeptics.
NASA’s Dr. Aldrin—who earned a Doctorate of Science in Astronautics at MIT—declared he was skeptical of man-made climate fears in a July 3, 2009 UK Telegraph interview. “I think the climate has been changing for billions of years,” Aldrin, the second person to walk on the Moon, said. On July 20, 1969, Aldrin and astronaut Neil Armstrong made their historic Apollo 11 moonwalk, becoming the first two humans to set foot on the Moon. According to his bio, “Aldrin has received three U.S. patents for his schematics of a modular space station, Starbooster reusable rockets, and multi-crew modules for space flight.” Aldrin was also decorated with the Presidential Medal of Freedom, the highest American peacetime award and he has received numerous distinguished awards and medals from 23 other countries.
“If it’s warming now, it may cool off later. I’m not in favor of just taking short-term isolated situations and depleting our resources to keep our climate just the way it is today,” Aldrin explained. “I’m not necessarily of the school that we are causing it all, I think the world is causing it,” Aldrin added.
Aldrin joins fellow moonwalker Schmitt, who flew on the Apollo 17 mission, in declaring their skepticism of man-made global warming fears. “The ‘global warming scare’ is being used as a political tool to increase government control over American lives, incomes and decision making. It has no place in the Society’s activities,” Schmitt, who flew on the Apollo 17 mission, said in 2008. (See: Astronaut Jack Schmitt Joins Skeptics & For Gore, a very inconvenient moonwalker.) Schmitt is featured in the 2009 report: U. S. Senate Minority Report: More Than 700 International Scientists Dissent Over Man-Made Global Warming Claim.

Astronaut Dr. Jack Schmidt
Below is Schmitt’s full entry in the Senate’s 700 Plus Scientist Report:
Award-Winning NASA Astronaut/Geologist and Moonwalker Jack Schmitt, formerly of the Norwegian Geological Survey and the U.S. Geological Survey, who flew on the Apollo 17 mission, has received numerous awards in his career including the Space Center Superior Achievement Award and the NASA Distinguished Service Medal. Schmitt, a member of the Geological Society of America, American Geophysical Union, and the American Association for the Advancement of Science, rejected man-made climate change concerns in 2008. “The ‘global warming scare’ is being used as a political tool to increase government control over American lives, incomes and decision making. It has no place in the Society’s activities,” Schmitt wrote on November 17, 2008. “As a geologist, I love Earth observations. But it is ridiculous to tie this objective to a “consensus” that humans are causing global warming when human experience, geologic data and history, and current cooling can argue otherwise. ‘Consensus,’ as many have said, merely represents the absence of definitive science,” Schmitt explained. Read more here.
-----------------
MIT Climate Scientist on man-made climate fears: ‘Ordinary people see through this—but educated people are very vulnerable’
MIT climate scientist Dr. Richard Lindzen mocked man-made global warming fears in a July 2, 2009 radio interview on WRKO’s Howie Carr program.
Lindzen noted that man-made climate fears were “divorced from nature” and he said the scientific foundation for climate fears was “falling apart.”
“How did we get a population that can be told something that contradicts their senses and go crazy over it?” Lindzen asked on the program. Lindzen recently co-signed an open letter to Congress with a team of scientists warning: “You Are Being Deceived About Global Warming’—‘Earth has been cooling for ten years.’
When asked about climate fears, Lindzen dismissed the notion that “ordinary” Americans are buying into former Vice President Al Gore’s climate views.
“We are too smart for that. You look at the polls, ordinary people see through this, but educated people are very vulnerable,” Lindzen quipped. (at 09:14 min. mark on audio)
Lindzen noted that people are being told that if they change a lightbulb, they are “saving the Earth”, they are “virtuous, they are smart.”
“Now you are told if you that if you don’t understand global warming is going on, you are dumb, but if you agree to it, you are smart,” Lindzen explained.
Radio interview by Boston’s RKO’s Howie Carr of MIT’s Dr. Richard Lindzen.
By the Heritage Foundation
Last week, the Congressional Budget Office released their analysis of the Waxman-Markey climate change bill that had proponents of the bill claiming we could save the planet for just $175 per household. That was the figure CBO estimated cap and trade would cost households in 2020, which “includes the cost of restructuring the production and use of energy and of payments made to foreign entities under the program, but it does not include the economic benefits and other benefits of the reduction in greenhouse gas emissions and the associated slowing of climate change.”
The trouble with the analysis is that costs are grossly underestimated. The trouble with legislation is that it will have virtually no impact on climate.
Overall, there are a number of basic problems with CBO’s analysis:
• Their allowance cost numbers don’t add up. They say the allowance price will be $28. Since there are 5.056 billion tons of CO2 equivalent in the cap that year, that implies a $141 billion gross cost. They list 91.4 (see table one). In the CBO’s June 5 analysis of Waxman-Markey, they projected allowance revenues of $119.7 billion, 129.7 billion, $136 billion, $145.6 billion, and $152.9 billion for the years 2015 to 2019. It’s hard to believe that the next number in that series would be $91.4 billion.
• They assume that spending/distribution of allowance revenue is dollar-for-dollar equivalent to a direct cash rebate to energy consumers. That is, the carbon tax isn’t a tax if the government spends the money. When have Americans ever seen all of a tax returned to them? It’s like suggesting your tax rebate will be as large as the amount taken from your paycheck every year.
• Most problematic is their complete omission of economic damage from restricting energy use. Footnote three on page four reads, “The resource cost does not indicate the potential decrease in gross domestic product (GDP) that could result from the cap. The reduction in GDP would also include indirect general equilibrium effects, such as changes in the labor supply resulting from reductions in real wages and potential reductions in the productivity of capital and labor.” That’s a pretty big chunk of change to ignore. In The Heritage Foundation’s analysis of the Waxman-Markey climate change legislation, the GDP hit in 2020 was $161 billion (2009 dollars). For a family of four, that is $1,870 that they ignore.
It’s also worth noting that 2020 had the second lowest GDP loss of the 24 years we analyzed. For all years the average was $393 billion or over double the hit in 2020. In 2035 (the last year analyzed by Heritage) the lost GDP works out to $6,790 per family of four and that is before they pay their $4,600 share of the carbon taxes (again, costs are adjusted for inflation to reflect 2009 prices).
Also telling, on page 5, the report says:
The distribution of the gross cost of complying with the policy would be quite different if the price level did not increase as a result of the cap - if, for example, the Federal Reserve adjusted monetary policy to prevent such an increase. In that case, the compliance costs would fall on workers and investors in the form of lower wages and profits.”
So high inflation will help mask the pain (at least in 2020); however, it is doubtful the Fed would not act to try to keep inflation low especially if investors and international investors are getting hit. According to the CBO, then, this would cause workers and investors to be hit harder. But if investors are hit harder, they will invest less; therefore, there will be less capital and the potential GDP will be lower going forward than it would otherwise be. A lower potential GDP means fewer opportunities for future populations. (Note: The Heritage analysis assumes the Fed would use a Taylor type rule. The CBO inflation number in 2020 [0.7 increase in CPI] matches Heritage’s exactly. Yet the CBO claims it assumes no action by they Fed, while Heritage does. )
Furthermore, the CBO is misleading on the “costs” estimates. They are comparing “net costs” as those assuming the government did not recycle the revenue from allowances back to the consumers (the “gross cost” of the allowance) to the “net cost” of allowance that has been recycled. Their analysis is not a net cost to the economy in terms of the overall economic cost without a Waxman-Markey cap and trade bill versus the overall economic cost with Waxman-Markey. Our analysis measures the effects of cap and trade versus a baseline with no cap and trade legislation in place.
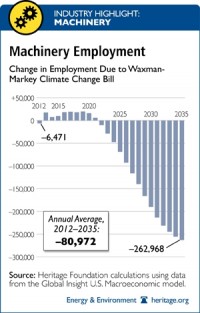
Higher energy costs create a significantly slower economy and reduce America’s growth potential. Heritage analysis finds that by 2035, a projected 2.5 million jobs are lost below the baseline (without a cap and trade bill). The average Gross Domestic Product (GDP) lost is $393 billion, hitting a high of $662 billion in 2035. The negative economic impacts accumulate, and the national debt is no exception. The increase in family-of-four debt, solely because of Waxman-Markey, hits an almost unbelievable $114,915 by 2035.
Whatever the costs, we will get almost nothing in exchange. According to climatologist Chip Knappenberger, Waxman-Markey would moderate temperatures by only hundredths of a degree in 2050 and no more than two-tenths of a degree at the end of the century. This doesn’t sound like a great deal for the next generation - millions of lost jobs, trillions of lost income, 50-90 percent higher energy prices, stunning increases in the national debt, and all for undetectable changes in world temperature. For a full analysis, please read ”CBO Grossly Underestimates Cost of Cap and Trade.”
http://blog.heritage.org/wp-content/uploads/2009/06/waxman-markey-electricity-and-appliances.jpg
A focus group lets us know what they think about global warming and cap and trade policy proposals that reduce emissions. Heritage analysts point out some key misconceptions that might change their minds. See full size video here.
By Joseph D’Aleo
Despite an active start to the month and a rather steady stream of cycle 24 microdots, the official sunspot number for June came in at 2.6 below the 3.3 needed to make November 2008 the solar minimum. This means it can’t be earlier than December, 2008. In order for the minimum to slip one more month to January 2009, July will have to end up less than 3.5, the value in June 2008, which it will replace. It will be difficult for it to slip to February because August would have to average below 0.5.
December had a 13 month average sunspot number of 1.7. Only three minima since 1750 had official minima below 1.7 (1913 1.5, 1810 0, 1823 0.1). Of course modern measurement technologies are better than older technologies so there is some uncertainty as to whether microdots back then would have been seen.
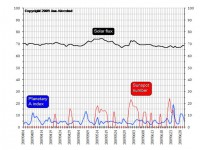
This chart maintained daily by Jan Alverstad at Solar Terrestrial Activity Report shows the increased solar spikiness in sunspot numbers in May and June but surprisingly a very low solar flux and a still rather low planetary A index number (geomagnetic activity). The sun is farthest from the earth in June/July which means the flux is lower, but official values are adjusted to account for that.
The Total Solar Irradiance as measure by SORCE (Solar Radiation and Climate Experiment) was also interesting the last two months showing two spikes but then a recent return to minimum levels.

JUNE 2008 IN THE UNITED STATES
The first half of the month was extremely cold and even snowy in south Central Canada and the northern United States. In snowed in North Dakota and in California in early June. It was also unusually cold in the southwest - well below the normal (often 10-20 degrees) in places like Palm Springs, CA. In general, the desert southwest was unusually mild. Phoenix had 15 straight days with highs below 100F, the first time in June since 1913.
June, especially the second half was very hot in the southern plains and the heat expanded north and east a bit after mid-month before being suppressed again by months end.
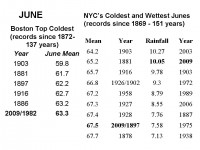
In the northeast, the month was unusually cold, cloudy and wet. In Boston it was 4.7F below normal in a tie for 6th coldest June (with 1982) in 138 years of record keeping, all the other years were before 1916. It was just short of two standard deviations colder then normal. The NWS spot checked the average maximum temp at Boston for the month and it appears this is the second coldest average high temp since 1872. 1903 is the record. A trace or more of rain fell on 22 days of the month. Measurable (0.01 inches or more) occurred on 16 days just short of the record of 18 set in 1942.
At Blue Hill Observatory in Milton, MA, just southwest of Boston, the month of June had between 26 and 27% of the possible bright sunshine. Normal for June is 55% and the gloomiest June in 1903 had just 25% of the possible sunshine. Second place had been June, 1998, with 36%. So, this month has taken over 2nd place, not an enviable distinction for vacationers. So little sunshine and so much cool temperatures that we have heard some reports that swamp maples in parts of Maine showing fall colors!
New York City’s Central Park was also cool, cloudy and wet. The month averaged 3.7F below normal and tied with 1897 as the 8th coldest since 1869 (151 years). It rained in 23 days of the month and ended up as the second wettest June ever falling short of 1927. Recall Joe Romm of Climate Progress had blamed the rains at the US Open on global warming and chuckled the heat waves would make the climate debate in DC all that much more exciting.
See larger image here.
The preliminary June anomaly month is shown below (CPC). Note the south central heat ridge related to the two year La Nina that produced dryness south central. Showers around this ridge (ring of fire) have kept growing areas wet and cool surrounds it. See post on ring of fire here.
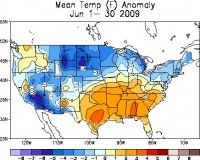
See larger image here.
See pdf here.