

By Dr. Calvin Beisner, Cornwall Alliance
The climate agreement reached in Paris last December will become effective on Earth Day, (Friday, April 22) with a ceremony at the United Nations headquarters in New York City.
We’ll all hear of heroic world leaders who joined together in Paris to ensure the planet’s survival. The Obama administration will try to enforce the agreement (which meets all the legal criteria of a treaty though the President chooses not to call it that to evade Senate disapproval) by imposing the Environmental Protection Agency’s controversial “Clean Power Plan” (CPP), which aims to reduce carbon dioxide emissions from U.S. power plants by 32% by 2030, and other onerous regulations that will drive up utility rates.
What we won’t hear much about are the Americans harmed by the rising energy prices the policies cause.
The higher rates will affect all Americans, but the impoverished and working poor will suffer most. Many already experience “energy poverty,” in which a household spends 10 percent or more of its income on household energy costs (excluding gasoline and other transportation-related costs). Many others will be driven into it.
A study by scholars at the Massachusetts Institute of Technology found that a policy imposing a CO2 tax or cap-and-trade regime (and the CPP allows states to use either or both) would impose higher costs nationwide. States that currently get more energy from fossil fuels would face smaller increases, and those that currently get less would face larger increases.
The lower you push CO2 emissions, the more expensive it is to generate electricity. Not surprisingly, richer people can afford more expensive things than poorer people. That includes energy. Consequently, the poorer you are, the less likely you are to choose more expensive energy sources.
Richer states, like the Pacific Coast, New England, and New York (which averaged $46,954 per capita in income in 2012, one-tenth more than the national average), have already pushed their CO2 emissions down somewhat. Poorer states, like South Central States, Texas, and Mountain States (which averaged $36,854 per capita in income, 14% lower than the national average and more than a fifth lower than those richer states), have not.
Because the poor spend a higher percentage of their incomes on energy in the first place, an increase in energy prices - which implementation of the CPP and the Paris climate agreement would cause - will cause disproportionately heavy harm to them, ironically functioning as if it were a regressive tax.
Consider examples from a few states, according to data from the U.S. Department of Energy’s Energy Information Agency:
Although on average Colorado families spent just 8% of their after-tax incomes on energy in 2013, the 879,000 Colorado families with income under $50,000 per year spent more than twice as much, an average of 17%, and the 128,000 families earning under $10,000 per year spent more than seven times as much, an average of 57%. For the average family, a 10% increase in energy prices would push energy costs to 8.8% of after-tax income; for the family earning under $10,000, that same increase in energy prices would push energy costs to a crushing 62.3%.
While on average Florida families spent 10% of their after-tax incomes on energy in 2013, the 3.9 million households with annual income under $50,000 spent nearly twice as much, an average of 19%, and the 587,000 families earning under $10,000 per year spent nearly seven times as much, 68%. For the average family, a 10% increase in energy prices would push energy costs to 11% of after-tax income; for the family earning under $10,000, that same increase in energy prices would push energy costs to 74.6%.
The average Iowa family spent 11% of after-tax income on energy in 2013. The 600,000 Iowa families with under $50,000 in annual income spent on average 19%, while 80,000 Iowa families with annual incomes under $10,000 spent on average 69% - more than six times the average. For the average family, a 10% increase in energy prices would push energy costs to 12.1% of after-tax income; for the family earning under $10,000, that same increase in energy prices would push energy costs to 75.9%.
Data for these and twelve other states are summarized in the Cornwall Alliance’s A Call to Truth, Prudence, and Protection of the Poor 2014.”
To comprehend the impact of EPA’s proposed new rule on America’s poorest, just imagine what it would be like to have to spend three-fourths of your household income on energy, leaving only one-fourth for food, clothing, shelter, transportation, health care, education, and everything else combined.
That’s why we should mourn, not celebrate, implementation of the Paris climate agreement on Earth Day.
March 31, 2016/ Francis Menton
In a famous column in 2006 titled “How to identify American totalitarians,” author Dennis Prager quoted what he called the old Soviet dissident joke:
“In the Soviet Union, the future is known; its the past that is always changing.”
Prager cited examples of the likes of the ACLU and anti-smoking activists brazenly altering things from the past to support their narratives. But of course the far more serious totalitarian threat comes when the government makes up facts about the past in its quest to expand its own power and take freedom away from the people.
Now, our own government would never do anything like that, right? Right?????? If you think that, then you obviously haven’t been reading my long-running series titled “The Greatest Scientific Fraud Of All Time,” the most recent entry of which (Part IX) appeared in December. That series has included links to some dozens of articles and blog posts where mostly independent researchers have gone out and compared raw temperature data from hundreds of places around the globe to the current data sets published by our government functionaries at the likes of NASA and NOAA. And somehow, when these comparisons are made, the results are always the same, over and over again: the government agencies have altered older data to be cooler, thereby introducing into history exaggerated warming trends not present in the raw data.
As just a few examples from the series, in Part IX I linked to descriptions by German journalist Gunter Ederer describing the recent (November 2015) work of Professor Friederich Ewert that included checking raw data of large numbers of randomly-sampled stations against current NASA-GISS data. In Part III I discussed the work of a guy named Paul Homewood as to massive lowering of old temperatures from Paraguay and other locations. In Part II I dealt with the extensive work of a blogger named Tony Heller in documenting literally dozens of instances of lowering old temperatures from around the world. Follow this link to get an idea of the massive extent of this.

Professor Friederich Ewert
Consider this from the description by Ederer of Ewert’s 2015 work:
Ewert painstakingly examined and tabulated the reams of archived data from 1153 stations that go back to 1881 - which NASA has publicly available - data that the UN IPCC uses to base its conclusion that man is heating the Earth’s atmosphere through the burning of fossil fuels. According to Ederer, what Professor Ewert found is “unbelievable”:
From the publicly available data, Ewert made an unbelievable discovery: Between the years 2010 and 2012 the data measured since 1881 were altered so that they showed a significant warming, especially after 1950. [...] A comparison of the data from 2010 with the data of 2012 shows that NASA-GISS had altered its own datasets so that especially after WWII a clear warming appears - although it never existed.”
Ederer writes that Ewert particularly found alterations at stations in the Arctic. Professor Ewert randomly selected 120 stations from all over the world and compared the 2010 archived data to the 2012 data and found that they had been tampered to produce warming.
(The work of Ederer and Ewert is in German, but the above can be found at NoTricksZone here.)
Now, what could be the purpose of the government altering temperatures of the past substantially downward? Really, does anybody care what the temperature in Nome, Alaska was in 1910? Well, there is the fact that EPA has declared to the world in its 2009 “Endangerment Finding” that CO2 from fossil fuels is a danger to humanity because it is warming the planet. And EPA has used that “Endangerment Finding” as the basis for what it calls its “Clean Power Plan,” (CPP) otherwise known as a massive seizure of power unto EPA, a federal takeover of the electric-power generating sector of the economy, as well as an effort to shut down the entire American coal industry from mining through power generation.
In one of the more consequential litigations going on in the country right now, some 27 states, plus numerous utilities that burn coal and numerous coal companies have sued EPA in the DC Circuit seeking invalidation of the CPP. Early this year those petitioners asked the DC Circuit to stay the CPP pending the result of the litigation, and the DC Circuit refused the stay; but then the petitioners went to the Supreme Court for the stay, and in February they got it. Now the case is before the DC Circuit for consideration on the merits. And a couple of days ago there arrives on my desk a copy of EPA’s main brief in the case justifying its position that the CPP is a valid exercise of its authority. The brief is a massive effort at impenetrability, 175 pages of bureaucratic doublespeak. But as relevant to this post, we find this at page 9:
Climate change is already occurring. Nineteen of the twenty warmest years on record have all occurred in the past twenty years, and 2015 was the hottest year ever recorded. Recent scientific assessments have found that climate change is damaging every area of the country. 80 Fed. Reg. at 64,686-88. These assessments make clear that substantially reducing emissions now is necessary to avoid the worst impacts.
And what is the support for that statement that “2015 was the hottest year ever recorded”? A footnote gives us these two links, here and here. These are precisely the government press releases based entirely on the altered surface-temperature record discussed above. And, despite the vast amount of discussion all over the web about the data alterations and the fact that they always go one direction and that the alterations turn a record that does not support the government’s narrative of unusual warming into one that seemingly does, this brief simply does not mention the subject of the alterations at all. The altered record is just presented to the DC Circuit as incontestable fact. Hey, it comes from the perfect, all-knowing government functionaries!
Also somehow completely omitted from the government’s brief is any mention of the satellite and balloon data sets that are inconsistent with and contradict the surface temperature record on which the government relies. In a post on January 22 titled “It’s Easy To Prove Your Hypothesis If You Just Pretend That The Adverse Evidence Does Not Exist,” I commented on the very NOAA press release now used by EPA as the support for its position in court:
Everybody who follows this also knows that the ground-based thermometer records have been greatly “adjusted” by the people who publish them, and that all or nearly all of the increase in temperatures in recent years is in the adjustments and not present in the raw data. So wouldn’t you think that NOAA in its release would at the minimum acknowledge the existence of the other contrary data and attempt somehow to deal with the contradictions? Well, take a look at that release; and, if you will, follow the link through to their full end-of-2015 Report. You will not find the slightest mention that the satellite or balloon data even exist. And of course that also means that you will not find any attempt to explain the discrepancies between and among data sets, or to justify why one is better than others.
That post also includes a chart of the satellite and balloon temperature data as presented by John Christy of UAH in his recent Congressional testimony. The chart shows that the satellite and balloon temperature sets agree closely during the periods for which they co-exist. Now, the satellite and balloon data sets on the one hand, and the altered surface temperature data set on the other hand, cannot both be right. The government’s presentation only of the one record it prefers, known to be filled with massive alterations all going the direction it needs them to go to support the narrative, without any mention or discussion of discrepancies as against other data sets, is the height of unethical conduct.
On the other hand, this approach maximizes the government’s chance for success in a huge seizure of power. Do they really care about anything else but that?
By Joseph D’Aleo, CCM
For those of us in the northeast who enjoy winters, this one had its memorable moments but overall was the balancing act to the last two persistently incredible winters.
I personally like early winter cold and snow and a white Christmas like I remember from my youth and from my years in beautiful Vermont. This year, we didn’t need our winter outerwear around Christmas. Here in the northeast north of I-90 we had to vicariously enjoy the January blizzard with a gray slate altostratus deck. We got a 22 year (NYC) to 59 year (BOS) sub-zero cold shot in February that was memorable and beat out any in the last two record winters, but the cold and the snows did not last. I spent a lot of time in March landscaping and digging in my yard which was buried last year still in March.
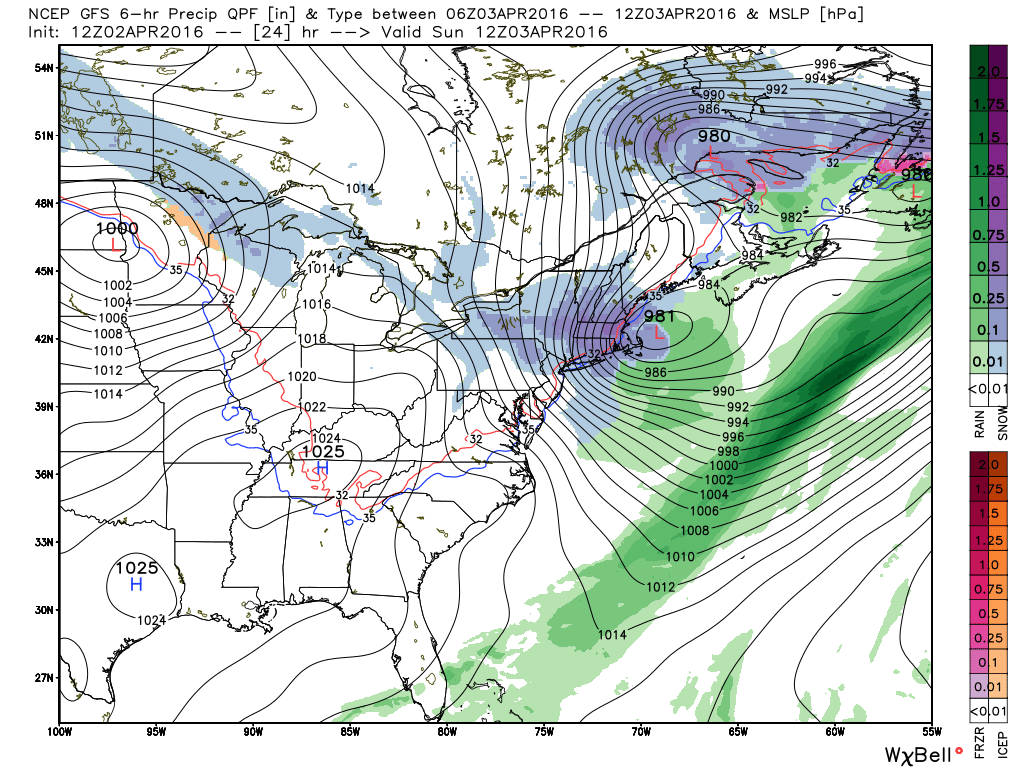
But now when we are ready for spring, we are facing a throwback to late February/early March period with cold and three storms, one with some potential to be memorable and potentially some record April cold mornings/days. The first blast coms Sunday morning as a fast moving ‘Clipper’ storm brings very cold and unstable air that should result in thundersnow over southeastern New England.
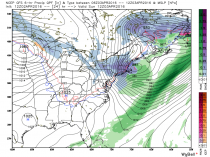
Enlarged
Maps courtesy of WeatherBell.com
It is followed by another clipper that brings follow up snow Monday.
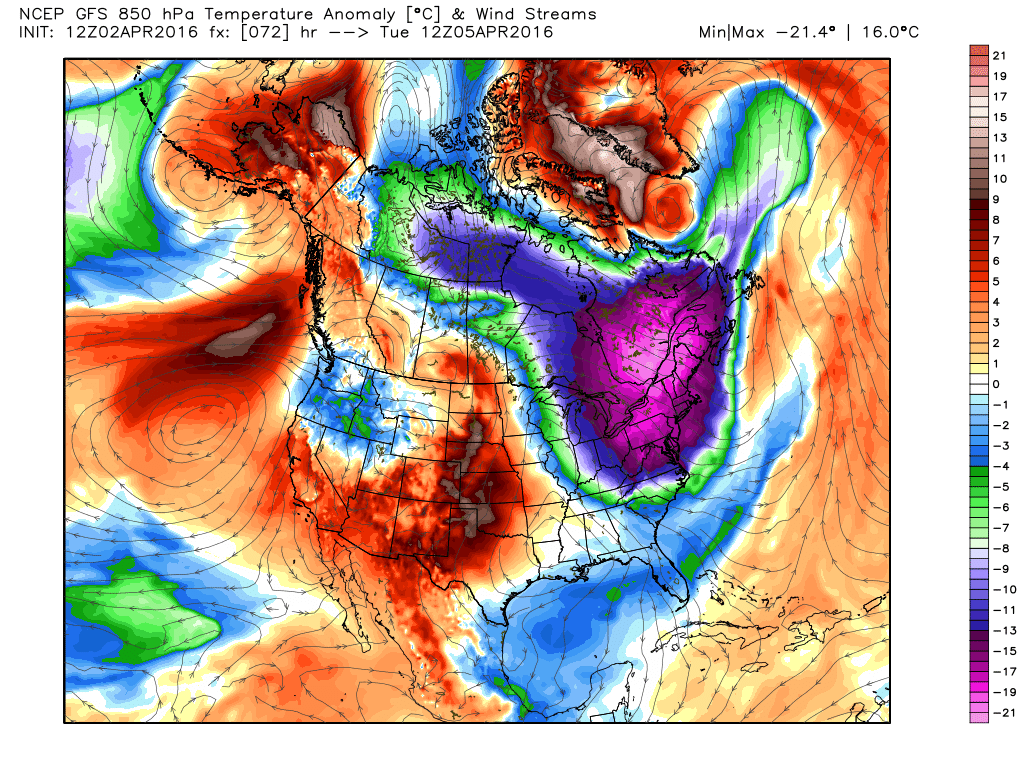
See the cold that accompanies and follows the storms. Wednesday morning may see record lows and coldest so late in the season readings in some locales.
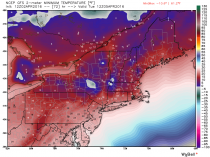
See how much below normal the readings are.

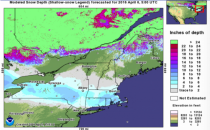
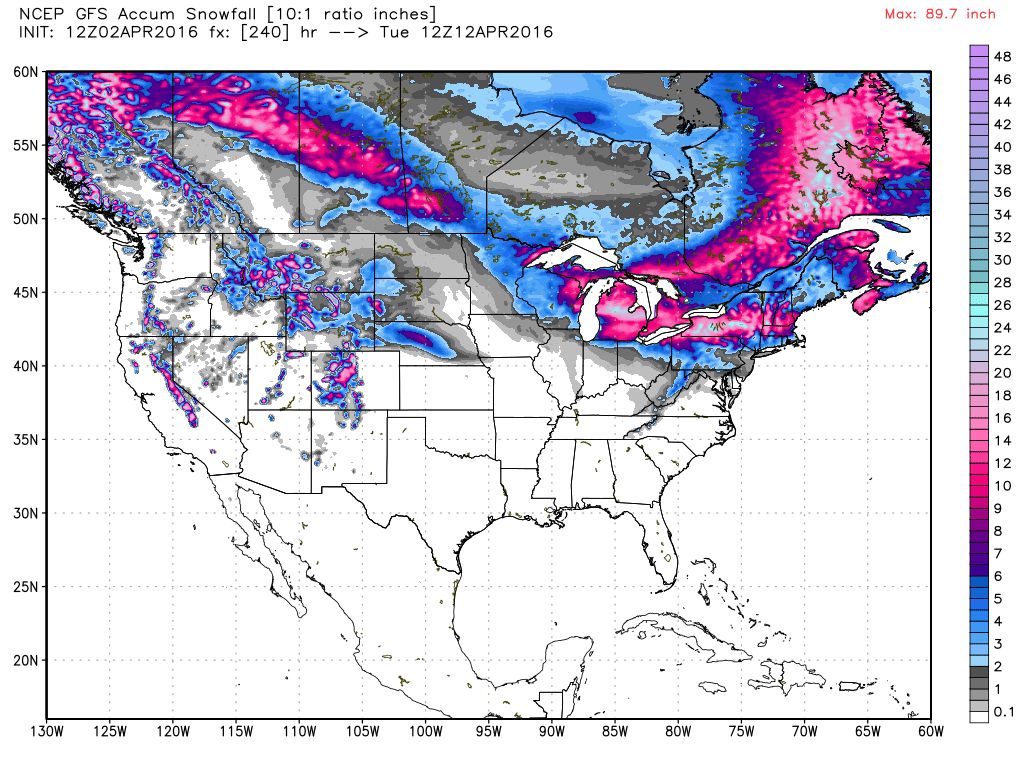
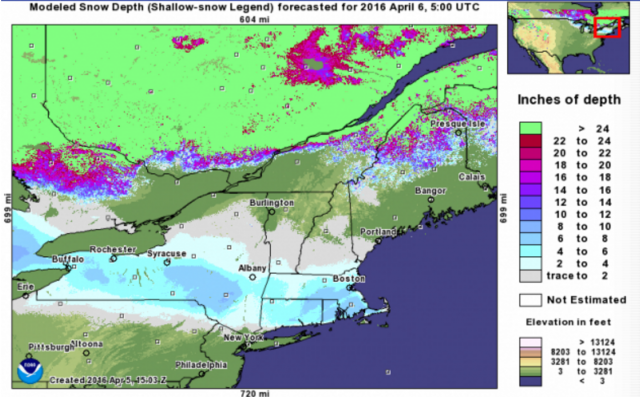
There will be another threat later this week. Here is the model forecast snow the next 15 days.

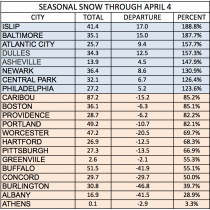
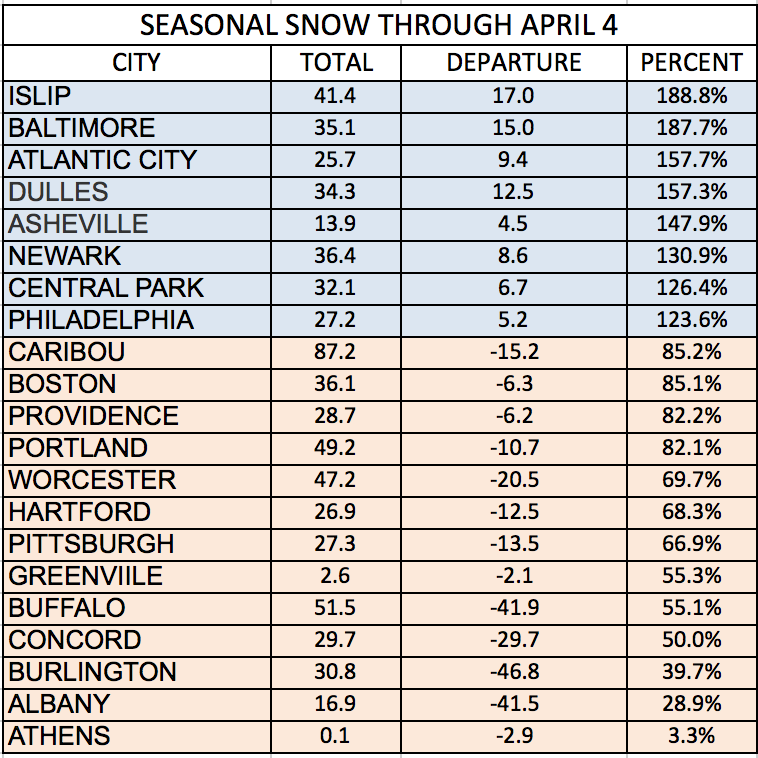
The heaviest will fall in the northern areas where the winter after last winters record or near record snows, has produced much below normal snows even as areas from NYC and Long Island southwest to DC and Virginia and the Carolinas have had a banner snow year.
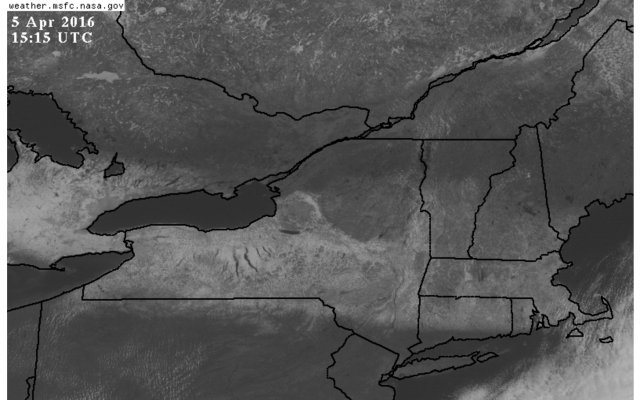
UPDATE: The following reflects the snow this week.
The above reflects the snow this past week ( 2 events).
