

Quote of the Week
“It doesn’t matter how beautiful your theory is, it doesn’t matter how smart you are. If it doesn’t agree with experiment, it’s wrong.” Richard Feynman
By Ken Haapala, President, Science and Environmental Policy Project (SEPP)
“It’s Wrong”: Nobel Laureate in Physics Richard Feynman (1965) was a brilliant scientist with a passion for teaching. In some of his writing, and videos of his lectures, he clearly articulates the difficulties in formulating a scientific theory and the importance of hypothesis testing (experiment), see above quote. Feynman left a lasting impression on many students of science.
In his written testimony to the U.S. House Committee on Science, Space and Technology on February 2, John Christy of the University of Alabama in Huntsville submitted the results of 102 IPCC CIMP-5 Climate Model runs for the Global Bulk Atmospheric Temperature. (Surface to 50,000 feet (15,240 meters). (CIMP-5 is the latest version global climate models used by the UN Intergovernmental Panel on Climate Change (IPCC))
Christy tested the results of these model runs against temperature observations by four different datasets of weather balloon measurements with one type of instruments and by satellites with another type of instruments as calculated by 3 different entities. Christy shows a 0.98 correlation between the types of observational datasets, which is very high for such types of measurements. Not only is there significant disparity between the average of model runs and observations; but also, since 1995 the disparity is increasing significantly. The models greatly overestimate the warming of the bulk atmosphere.
Applying Feynman’s rule, the models are wrong!
By this empirical testing, the certainty expressed by the IPCC that human emissions of greenhouse gases, chiefly carbon dioxide (CO2), primarily responsible for late 20th century warming is wrong. EPA’s finding that greenhouse gases, chiefly CO2, endanger public health and welfare is wrong. And the justification for the US Administration’s power plan is wrong.
Natural or Human? Christy’s evidence does not mean that there is no greenhouse effect, or that human emissions do not contribute to a warming. But it certainly indicates that the human emissions of a cause are overstated, and that the primary cause(s) of late 20th century warming is likely to be natural influences. This is directly contrary to probability of nature-only influence calculations by Mann et al. discussed in the January 30, 2016 TWTW. The artificial truncation of the data to the past 150 years can lead to incorrect conclusions, even assuming the calculations are correct.
Extension of Prior Testimony: On December 8, 2015 Christy give strong written testimony before the U.S. Senate Subcommittee on Space, Science and Competitiveness questioning claims of human-induced climate change impacts on extreme events such as wildfires (no evidence), droughts & floods (little or no evidence) with increasing grain production. In that testimony, Christy expressed concern over the political influence on climate science, including the IPCC.
Subsequently, a grouped called Yale Climate Connections released a video attacking Christy’s December 8 testimony. The video featured statements by Climate scientists Michael Mann, Kevin Trenberth, Andrew Dessler, Carl Mears, and Ben Santer, and David Titley. The title of the article accompanying the video is a dead giveaway of its purpose: “Experts Fault Reliance on Satellite Data Alone.” Carl Mears of the Remote Sensing Systems (RSS) should know that Christy and his group have used RSS satellite data for years in addition to UAH data and NOAA data. Further, he should know that balloon data is distinctly different from satellite data. See links under Defending the Orthodoxy.
Four Points: In his February 2 testimony, Christy addresses four criticisms of satellite measurements, the first three of which are brought up in the video. The first is that satellites do not measure temperatures. Christy counters that they actually measure microwave radiation from oxygen, the intensity of which is directly proportional to the temperature of the oxygen. This is similar to modern doctors using ear probes measuring emitted radiation to measure a patient’s temperature - a great improvement to various types of older thermometers.
The second criticism is orbital decay, which was pointed out by RSS about 20 years ago and corrected. The third criticism is east-west drift (diurnal drift) of the satellites. This influences measurements of the lower troposphere, but not the middle troposphere, the data used in the hypothesis testing. Further, the error was corrected about 10 years ago.
A fourth criticism not brought up in the video, but discussed by Christy, is that some scientists have expressed that the satellite data hides the power and validity of the models. To prevent misinterpretation, Christy adjusts the data to the same starting point similar to a foot race starting at the same starting line. The starting point is1979 when satellite data became available rather than an artificially contrived one. No one has produced evidence Christy’s adjustments are in error.
Adjusting for errors in hypotheses when they are revealed is how science works to improve hypotheses. Improving hypotheses is one of the purposes of hypothesis testing.
Linear Approach: Many scientists do not care for the tendency to put time-series data into linear form, or even constructing a regression trend between two points in the time-series, because it often disguises other trends that may only be observed in the rich data. However, a linear approach can be effective. Christy uses one to eliminate the influence of volcanoes, etc. and to better demonstrate the departure of the climate models from observations. Using the 36-year period from 1979 to 2015, Christy shows a linear trend of +0.079C/decade for balloon data, and +0.091 C/decade for satellite data. The average of 102 ICCC CMIP-5 Climate Model runs over the same period is +0.214 C/decade. Globally, the models overestimate bulk atmospheric warming (surface to 50,000 feet) by 2.5 times. From the data presented Christy states:
“Thus, the evidence here strongly suggests the theory, as embodied in models, goes much too far in forcing the atmosphere to retain heat when in reality the atmosphere has a means to relinquish heat and thus warms at a much slower rate.”
How Well Do We Understand Climate Change? After addressing surface temperature data and the data quality issues involve (which have been discussed in TWTW), Christy goes to the key question: How Well Do We Understand Climate Change? After discussing the complexity of the modeling, he asserts that if we understand this complex system, we should be able of predict its behavior. This is a start; but, accurate prediction does not guarantee that the fundamental physics is understood. Based on the 102 climate model simulations of the troposphere Christy was able to access, our understanding is far from complete and does not inspire confidence.
Only One: To give a demonstration of the variation among the models Christy plots the 102 CMIPS Model Runs in 32 Groupings against Observations. Only one model comes close to the observations - the Russian INM-CM4. For those who like to calculate a low probability of 20th century warming being natural variability, there is a new challenge. What is the random probability of 101 out of 102 CMIP5 global climate model runs greatly overestimating global mid-tropospheric temperature observations?
Conclusion: Christy concluded with calculations of what would be the impact on global warming if the US ceased emissions totally - the US simply vanished. Using an IPCC model with a low end assumption of the influence of CO2 (not the much lower influence indicated by his research) after 50 years the effect would be less than monthly variations in global temperatures.
If the video by Yale Climate Connections, mentioned above, prompted Christy to prepare this rigorous, terse summary of the problems in IPCC models and science, perhaps those responsible for the video should be thanked. It would be difficult to create a better evaluation of the quality of the IPCC’s models.
Scientist Ruthlessly Debunks One Of NOAA’s Central Climate Claims
By Michael Bastasch, Daily Caller, Feb 2, 2016

Hundreds of scientists sent a letter to lawmakers Thursday warning National Oceanic and Atmospheric Administration (NOAA) scientists may have violated federal laws when they published a 2015 study purporting to eliminate the 15-year ‘hiatus’ in global warming from the temperature record.
“We, the undersigned, scientists, engineers, economists and others, who have looked carefully into the effects of carbon dioxide released by human activities, wish to record our support for the efforts of the Committee on Science, Space and Technology to ensure that federal agencies complied with federal guidelines that implemented the Data Quality Act,” some 300 scientists, engineers and other experts wrote to Chairman of the House Science Committee, Texas Republican Rep. Lamar Smith.
“In our opinion...NOAA has failed to observe the OMB [Office of Management and Budget] (and its own) guidelines, established in relation to the Data Quality Act.”
The Data Quality Act requires federal agencies like NOAA to “ensure and maximize the quality, objectivity, utility, and integrity of information, including statistical information.”
“In our opinion… NOAA has failed to observe the OMB [Office of Management and Budget] (and its own) guidelines, established in relation to the Data Quality Act.”
Smith launched an investigation into NOAA’s study last summer over concerns it was pushed out to bolster President Barack Obama’s political agenda. Democrats and the media have largely opposed the probe into NOAA scientists and political appointees, but Smith is determined to continue investigating. NOAA officials surrendered emails to congressional investigators in December.
“It is this Committee’s oversight role to ensure that federal science agencies are transparent and accountable to the taxpayers who fund their research,” Smith told The Daily Caller News Foundation. “Americans are tired of research conducted behind closed doors where they only see cherry-picked conclusions, not the facts. This letter shows that hundreds of respected scientists and experts agree that NOAA’s efforts to alter historical temperature data deserve serious scrutiny.”
Of the 300 letter signers, 150 had doctorates in a related field. Signers also included: 25 climate or atmospheric scientists, 23 geologists, 18 meteorologists, 51 engineers, 74 physicists, 20 chemists and 12 economists. Additionally, one signer was a Nobel Prize winning physicist and two were astronauts.
NOAA scientists upwardly adjusted temperature readings taken from the engine intakes of ships to eliminate the “hiatus” in global warming from the temperature record.
The NOAA study in dispute claims the scientists found a solution to the 15-year “pause” in global warming. They “adjusted” the hiatus in warming the temperature record from 1998 to 2012, the “new analysis exhibits more than twice as much warming as the old analysis at the global scale.”
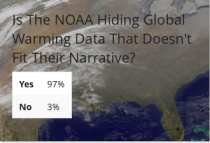
Is The NOAA Hiding Global Warming Data That Doesn’t Fit Their Narrative?
“As has been acknowledged by numerous scientists, the engine intake data are clearly contaminated by heat conduction from the structure, and as such, never intended for scientific use,” wrote climate scientists Dr. Patrick J. Michaels and Dr. Richard S. Lindzen of the libertarian Cato Institute on the in the science blog Watts Up With That. “Adjusting good data upward to match bad data seems questionable.”
“If we subtract the [old] data from the [new] data, we can see that that is exactly what NOAA did,” climate expert Bob Tisdale and meteorologist Anthony Watts wrote on the same science blog. “It’s the same story all over again; the adjustments go towards cooling the past and thus increasing the slope of temperature rise. Their intent and methods are so obvious they’re laughable.”
See more here.
The letter sent to Chairman Lamar Smith says:
“We, the undersigned, scientists, engineers, economists and others, who have looked carefully into the effects of carbon dioxide released by human activities, wish to record our support for the efforts of the Committee on Science, Space and Technology to ensure that federal agencies complied with federal guidelines that implemented the Data Quality Act,” some 300 scientists, engineers and other experts wrote to Chairman of the House Science Committee, Texas Republican Rep. Lamar Smith.
“In our opinion...NOAA has failed to observe the OMB [Office of Management and Budget] (and its own) guidelines, established in relation to the Data Quality Act.”
For those that don’t know, Federal agencies that collect data for public use and policy decision are required to adhere to the Data Quality Act by law. The purpose is to:
“...ensure and maximize the quality, objectivity, utility, and integrity of information, including statistical information.”
In my opinion, both NOAA (Karl and Peterson) and NASA (Gavin Schmidt) regularly flout this law. They need to be taken to task for it.
The letter follows along with a list of signatories.
January 25, 2016
Chairman Lamar Smith
Committee on Science, Space and Technology
House of Representatives
Congress of the United States
Dear Chairman Smith,
We, the undersigned, scientists, engineers, economists and others, who have looked carefully into the effects of carbon dioxide released by human activities, wish to record our support for the efforts of the Committee on Science, Space and Technology to ensure that federal agencies complied with federal guidelines that implemented the Data Quality Act. This is an issue of international relevance because of the weight given to U.S. Government assessments during international negotiations such as the IPCC.
The Data Quality Act required government-wide guidelines to “ensure and maximize the quality, objectivity, utility, and integrity of information, including statistical information,” that was disseminated to the public. Individual agencies, such as the EPA, NOAA and many others were required to issue corresponding guidelines and set up mechanisms to allow affected parties to seek to correct information considered erroneous.
We remind you that controversy previously arose over EPA’s apparent failure to comply with these guidelines in connection with its Greenhouse Gas Endangerment Finding, which was the subject of a report by the EPA Office of the Inspector General in 2011, see. In that case, EPA failed to comply with peer review requirements for a “highly influential scientific assessment” and argued that the Greenhouse Gas Endangerment Finding was not a “highly influential” scientific assessment. If it wasn’t, then it’s hard to imagine what would be. (For a contemporary discussion of the EPA’s stance see.
In our opinion, in respect to Karl et al. 2015 and related documents, NOAA has failed to observe the OMB (and its own) guidelines, established in relation to the Data Quality Act, for peer review of “influential scientific information” and “highly influential scientific assessments.”
We urge you to focus on these important compliance issues. For your consideration we attach a draft letter which directly connects these issues to your committee’s prior request for documents.
Sincerely,
(List of signatories and tag lines)
-----------
RECALL:
General Accounting Office (GAO) report (September 2011) took NOAA to task for station siting issues: “NOAA does not centrally track whether USHCN stations adhere to siting standards...nor does it have an agency-wide policy regarding stations that don’t meet standards.” The report continues, “Many of the USHCN stations have incomplete temperature records; very few have complete records. 24 of the 1,218 stations (about 2 percent) have complete data from the time they were established.” GAO goes on to state that most stations with long temperature records are likely to have undergone multiple changes in measurement conditions.
The report shows by their methodology that 42% of the network in 2010 failed to meet siting standards. Some of the stations that were worst offenders of siting quality have been removed since the non-governmental, all volunteer, not for profit surfacestations.org project photographic assessment of well over 1000 of the 1200 US climate stations in the USHCN network published its findings.
Joseph D’Aleo, CCM
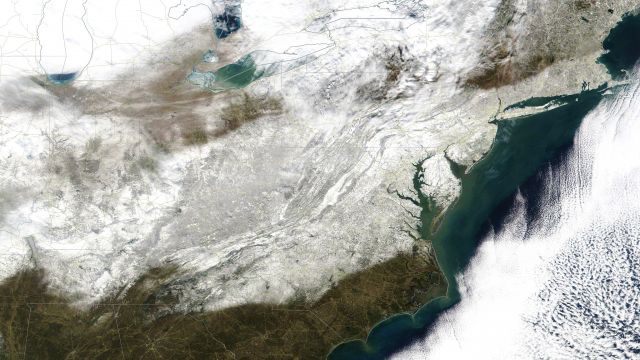
There has been a lot of buzz about the mammoth snowstorm in the media.

Predictably, there is talk this is the result of global warming. They forget the IPCC, UCS and NOAA in their reports for the EPA had stated winters were becoming warmer and less snowy especially in the major metropolitan areas where they historically lie near the critical thermal parameters near the rain versus snow boundary.
See fact check on UCS report.
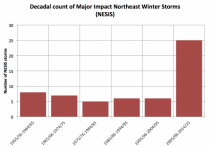
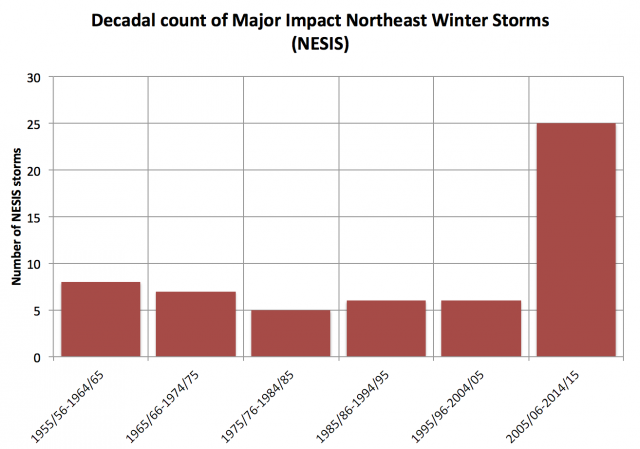
Instead, the major cities have been blitzed with heavy snows this century.
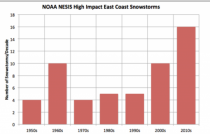
The last decade through last winter has amazed with 25 NESIS storms (add a new one this year...more to come).
The fact is the snows occur in colder regimes. December was warm and SNOWLESS. It turned colder this month and POW.
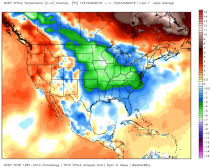
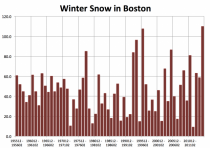
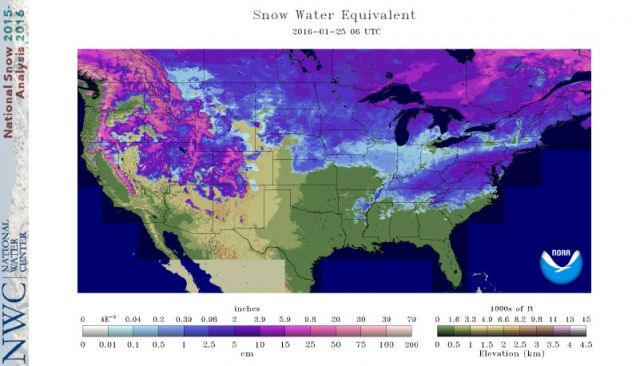
Central Park NYC recorded 26.8“, 2nd behind 26.9” in 2006. This was more than the 25.1” whole season average. Philadelphia recorded 22.4”, which was the 6th heaviest in a two day period in records back to the 1870s, exactly the seasonal normal total. In the DC area, Baltimore had 29.2”, the most ever for a single storm, Dulles Airport had 29.3”, second to the February 2010 blizzard.
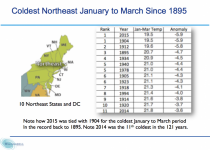
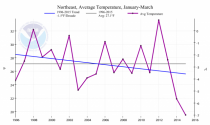
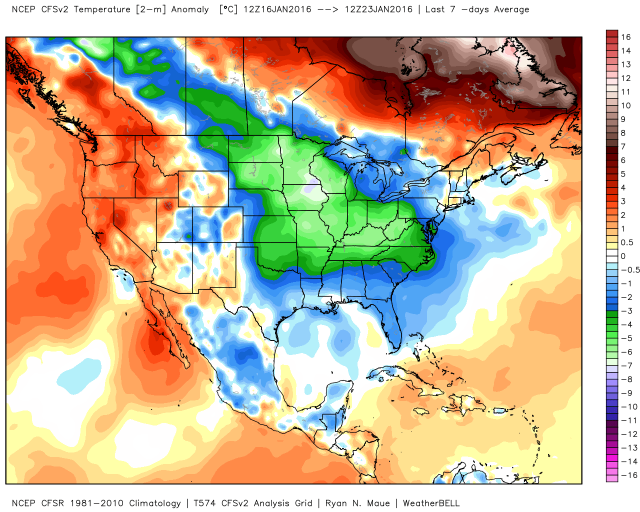
The last few years were cold in the northeast for January to March (2015 the coldest and 2014 the 11th coldest in the northeast since 1895) and record 2014/15 the snowiest on record in places.
Enlarged
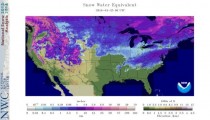
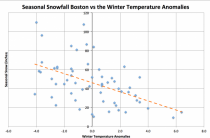
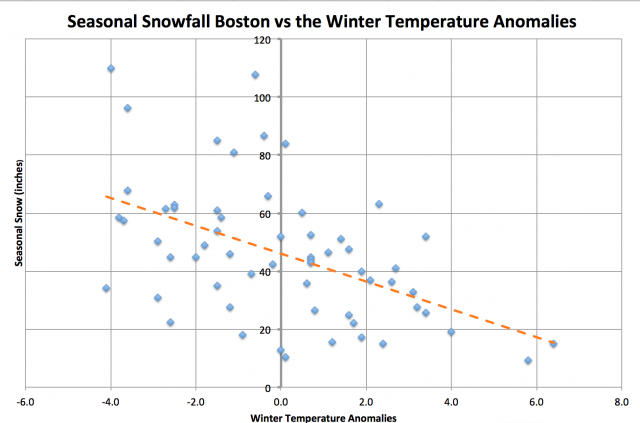
Snow is favored in COLD winters and increases with cooling not warming. In the 39 days last winter when Boston had 100.2 inches of snow, the melted precipitation was 5.69 inches, a ratio of 17.6 to 1. Seasonal snows are high in cold winters, low in warmer winters.
This has support in a new Journal of Climate story in phys.org that shows shows global warming would decrease contrast and extremes.
Extreme winters like we saw in Europe 2008-2013 and in the US the past few years are not due to claimed man made ‘warming’.
CLIMATE CHANGE DOES NOT CAUSE EXTREME WINTERS, NEW STUDY SHOWS
PHYS.ORG
March 27, 2015

Credit: Larisa Koshkina/public domain
Excerpts:
Cold snaps like the ones that hit the eastern United States in the past winters are not a consequence of climate change. Scientists at ETH Zurich and the California Institute of Technology have shown that global warming actually tends to reduce temperature variability.
Repeated cold snaps led to temperatures far below freezing across the eastern United States in the past two winters. Parts of the Niagara Falls froze, and ice floes formed on Lake Michigan. Such low temperatures had become rare in recent years. Pictures of icy, snow-covered cities made their way around the world, raising the question of whether climate change could be responsible for these extreme events.
It has been argued that the amplified warming of the Arctic relative to lower latitudes in recent decades has weakened the polar jet stream, a strong wind current several kilometres high in the atmosphere driven by temperature differences between the warm tropics and cold polar regions. One hypothesis is that a weaker jet stream may become more wavy, leading to greater fluctuations in temperature in mid-latitudes. Through a wavier jet stream, it has been suggested, amplified Arctic warming may have contributed to the cold snaps that hit the eastern United States.
Temperature range will decrease
Scientists at ETH Zurich and at the California Institute of Technology, led by Tapio Schneider, professor of climate dynamics at ETH Zurich, have come to a different conclusion. They used climate simulations and theoretical arguments to show that in most places, the range of temperature fluctuations will decrease as the climate warms. So not only will cold snaps become rarer simply because the climate is warming. Additionally, their frequency will be reduced because fluctuations about the warming mean temperature also become smaller, the scientists wrote in the latest issue of the Journal of Climate.
The study’s point of departure was that higher latitudes are indeed warming faster than lower ones, which means that the temperature difference between the equator and the poles is decreasing. Imagine for a moment that this temperature difference no longer exists. This would mean that air masses would have the same temperature, regardless of whether they flow from the south or north. In theory there would no longer be any temperature variability. Such an extreme scenario will not occur, but it illustrates the scientists’ theoretical approach.
Extremes will become rarer
Using a highly simplified climate model, they examined various climate scenarios to verify their theory. It showed that the temperature variability in mid-latitudes indeed decreases as the temperature difference between the poles and the equator diminishes. Climate model simulations by the Intergovernmental Panel on Climate Change (IPCC) showed similar results: as the climate warms, temperature differences in mid-latitudes decrease, and so does temperature variability, especially in winter.
Help us maintain Icecap if you are able. Even small amounts help us pay the maintenance charges for the server that keep coming each month. We keep the site going without a support staff to try and provide you with information you can use. We have over 8000 entries searchable - to help you find the information you need. Alternatively, consider a subscription to Weatherbell.