

Bob Tisdale, WUWT
It never fails. Hurricanes and tropical cyclones always bring out the manmade global warming alarmists, with their claims of unusually warm sea surface temperatures along the storm tracks. Of course those fictionally warmed sea surface temperatures were caused by rising CO2 emissions. We expected and saw that nonsense when Sandy struck the east coast of the U.S. mainland back in 2012. Not unexpectedly, data contradicted the claims. See the posts here and here.
The same unwarranted alarmist claims magically appeared when the two tropical cyclones (Iselle and Julio) threatened Hawaii last week. Iselle’s storm track is shown on the map to the right. (Please click on it to enlarge.) I’ve highlighted the coordinates I’ve used for Iselle’s storm track...before it reached Hawaii. Julio’s track was similar but ran a little north of Iselle’s. So, were the sea surface temperatures along Iselle and Julio’s storm tracks unusually warm, and have the sea surface temperatures there warmed during the satellite era?
WEEKLY DATA
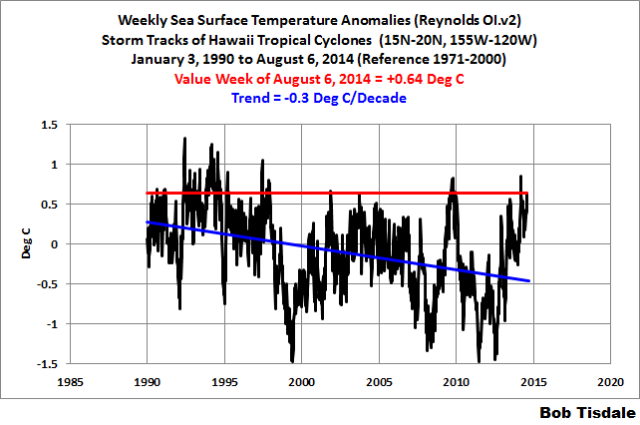
The weekly Reynolds OI.v2 sea surface temperature anomalies for the coordinates of 15N-20N, 155W-120W, for the week centered on August 6, 2014, were above the 1971-2000 average. (Those are the base years used by NOAA for the Reynolds OI.v2 data.) But they were not unusually warm as shown by the horizontal red line. They have been warmer quite regularly since the start of the weekly data in January 1990. And it’s blatantly obvious that the sea surface temperatures have cooled there. The cooling rate is -0.3 deg C/decade since 1990, based on the linear trend shown in blue.
Weekly Hawaii Storm Track SSTa

Enlarged
Weekly Iselle and Julio Storm Track SST Anomalies
MONTHLY DATA
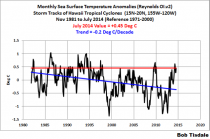
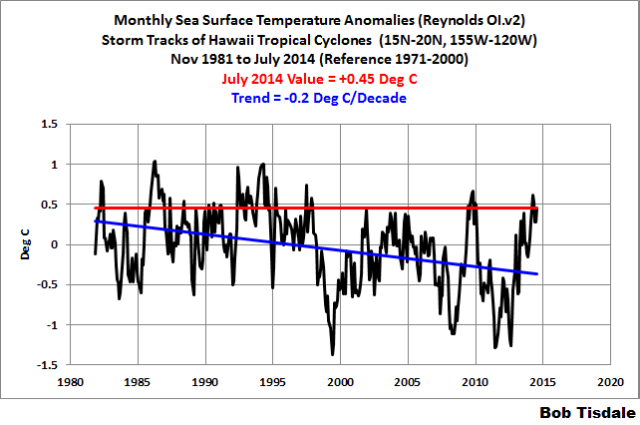
The monthly satellite-enhanced Reynolds OI.v2 data stretches back as far as November 1981. The July 2014 sea surface temperature anomalies for Iselle and Julio’s storm tracks (shown in red) were not unusually warm, and the sea surface temperatures there have cooled since November 1981 based on the linear trend (shown in blue).
Monthly Hawaii Storm Track SSTa
Enlarged
Monthly Iselle and Julio Storm Track SST Anomalies
HOW FAR BACK CAN WE GO AND STILL SHOW NO WARMING IN THAT PART OF THE EASTERN TROPICAL NORTH PACIFIC?
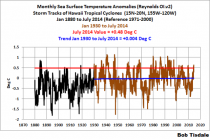
The next graph shows the NOAA ERSST.v3b-based sea surface temperature anomalies for the coordinates of 15N-20N, 155W-120W, from January 1880 to July 2014. I’ve highlighted the period of January 1930 through July 2014 in brown. Since January 1930, the warming rate of the sea surface temperatures for Iselle and Julio’s storm track is only +0.004 deg C/decade. That’s 4 one-thousandths of a degree C per decade. And as shown by the red horizontal line, the sea surface temperature anomalies back as far as the 1880s were comparable the July 2014 value...if you believe sea surface temperature data back that far.
Long Term Monthly Hawaii Storm Track SSTA
Enlarged
Long-Term Monthly Iselle and Julio Storm Track SST Anomalies
YEAH BUT, YEAH BUT, YEAH BUT
History has shown, if I were to end the post there, then someone would say something to the effect of, Greenhouse gases have increased the amount of moisture in the air, making tropical storms worse than before.
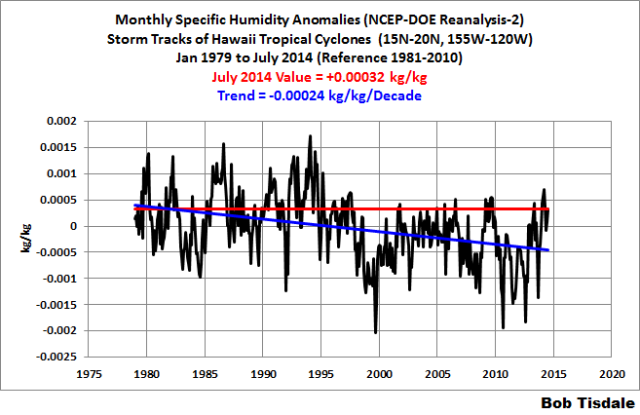
To counter that nonsense, we turn to the NCEP/DOE Reanalysis-2 outputs of Specific Humidity, which represents the amount of moisture in the column of atmosphere. The units are kilogram of water vapor/kilogram of dry air. For Iselle and Julio’s storm tracks, there is nothing unusual high in the specific humidity for July 2014, and the trend since 1979 shows a decrease, not increase, in specific humidity southeast of Hawaii.
Monthly Hawaii Storm Track Specific Humidity

Enlarged
Monthly Iselle and Julio Storm Track Specific Humidity Anomalies
SOURCES
The weekly and monthly Reynolds OI.v2 sea surface temperature data are available through the NOAA NOMADS website here. The long-term monthly NOAA ERSST.v3b sea surface temperature data are available through the KNMI Climate Explorer. And the monthly specific humidity output of the NCEP-DOE Reanalysis-2 is available from the NOAA NOMADS website here.
By Michael Reagan
Long before Al Gore went off the deep end over global warming, my home state of California was experiencing climate extremes. In fact Mark Twain, a former resident of San Francisco, used to complain that everyone talks about the weather, but nobody does anything about it.
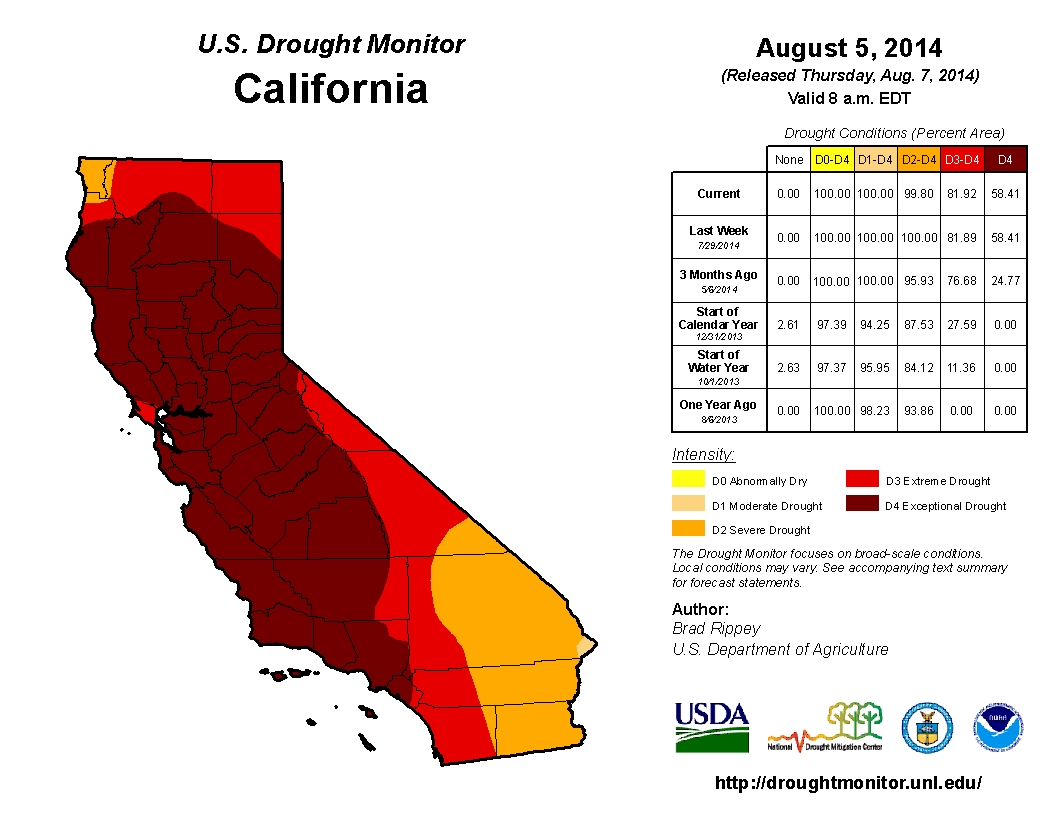
Currently the state is experiencing ONE OF the most severe droughts since 1877 when record-keeping began.
The Los Angeles Times reports, “In June, nearly 80 percent of California was considered to be under “extreme” and “exceptional” drought conditions, the highest categories of dryness, according to the latest U.S. Drought Monitor map.”

But it’s not like this is California’s first drought. (Homeowners whose formerly grass-covered front lawns have turned into mini-deserts might take issue with the notion that “the past century has been among the wettest of the last 7,000 years,” as Scott Stine, professor of geography and environmental studies at Cal State East Bay, asserted in the San Jose Mercury News.)
In response to the shortage of water, the California Water Resources Board wants to institute a punitive fine of $500/day for people it calls “water hogs.”
But I think Thomas Del Beccaro, writing in Forbes, has a better idea: Let’s fine the board for failing to do its job over the last 40 years.
He explains, “California is the most populated state in the Union, with more than 38 million people. Its population was just under 20 million in 1970, when the bulk of its current water storage and delivery systems were already built. In other words, the California governments have done very little to significantly increase water supplies in over 40 years, even though its population has doubled during that period of time.”
Instead of realizing that “water” was its middle name, the board has been made captive by enviro-Nazis who think people in general are the enemy. Rather than build dams and reservoirs to keep up with a growing population, state government has preferred to depend on the kindness of clouds to provide water for taxpayers.
Then the clouds stopped being kind.
Felicia Marcus, chairman of the water board, exemplifies the arrogant, buck-passing mentality of its members: “I like to say, having a browning lawn and a dirty car is a badge of honor.”
No Felicia, the dead grass and filthy car are the result of a do-nothing board that should be thrown out on its ear.
Forty years of advance warning wasn’t long enough for state government to build additional dams and reservoirs, so farmers are forced to rely on increased groundwater pumping to supply desperately needed water on the surface.
According to a report at TakePart.com, “As much as 20 cubic kilometers of Central Valley groundwater may have been pumped out in just the last three years, according to one estimate. That’s about 12 percent of the last 150 years’ total depletion.”
The problem caused by this groundwater depletion is somewhat confusing to a non-expert like me. In one part of the report the land is sinking as much as a foot per year, “damaging roads and other infrastructure and exposing communities to increased flood risk.”
But a few paragraphs later the problem is not enough weight: “Groundwater pumping unburdens the lithosphere,” said William Hammond, a geologist at the University of Nevada, Reno. When you pump that much groundwater, the load gets taken away and the landscape essentially bounces up. The Sierra Nevada is rising more quickly as a result of groundwater pumping in the Great Valley.”
Bouncing. Sinking. Make up your mind.
But the result of all this hyperactive geology is supposedly an increased potential for earthquakes. This is where the politicians come into the picture. Other states run by leftists have banned the oil extraction technique known as fracking because it supposedly causes earthquakes, too. The real reason for the ban is it works and proves “peak oil” environmentalists wrong.
Now it’s time for California Democrats to ban droughts for the same reason: Increased earthquakes.
I can see it all now, a statewide media tour that hits the driest part of the state.
Politicians desperately in need of a humidifier will express their concern for farms, lawns and vacant car washes. There’s even a chance for coalition-building and additional news coverage as a Blue Ribbon Drought Study Group reaches out to Native Americans to see if anyone recalls how to do a rain dance.
Of course it won’t do any good, but that’s never stopped the great minds in Sacramento before. Besides banning droughts will provide the rest of us with needed comic relief until our Maker decides it’s time for the rain to come again.
Michael Reagan is the son of former President Ronald Reagan and chairman of the League of American Voters.