

A new paper published in Environmental Research Letters finds that lack of access to modern fossil fuels is responsible for millions of premature deaths amongst the poorest of the planet, and that “improved access to modern cooking fuels alone can avert between 0.6 and 1.8 million premature deaths annually in 2030 and enhance well being substantially.” The environmental left wants to raise the price and restrict supply of fossil fuels via taxation and drilling limitations, further restricting modern energy access to the poor, increasing social injustice and the premature deaths that result.
Pathways to achieve universal household access to modern energy by 2030
OPEN ACCESS
Full text PDF (1.72 MB)
A lack of access to modern energy impacts health and welfare and impedes development for billions of people. Growing concern about these impacts has mobilized the international community to set new targets for universal modern energy access. However, analyses exploring pathways to achieve these targets and quantifying the potential costs and benefits are limited. Here, we use two modelling frameworks to analyse investments and consequences of achieving total rural electrification and universal access to clean-combusting cooking fuels and stoves by 2030. Our analysis indicates that these targets can be achieved with additional investment of US $65 to 86 billion per year until 2030 combined with dedicated policies. Only a combination of policies that lowers costs for modern cooking fuels and stoves, along with more rapid electrification, can enable the realization of these goals. Our results demonstrate the critical importance of accounting for varying demands and affordability across heterogeneous household groups in both analysis and policy setting. While the investments required are significant, improved access to modern cooking fuels alone can avert between 0.6 and 1.8 million premature deaths annually in 2030 and enhance well being substantially.
Read about the collapse of the green movement in Europe here.
ANOTHER SKEPTICALSCIENCE FAIL
Alternate Title: Climate Science Community Continues to Lose Sight of Reality
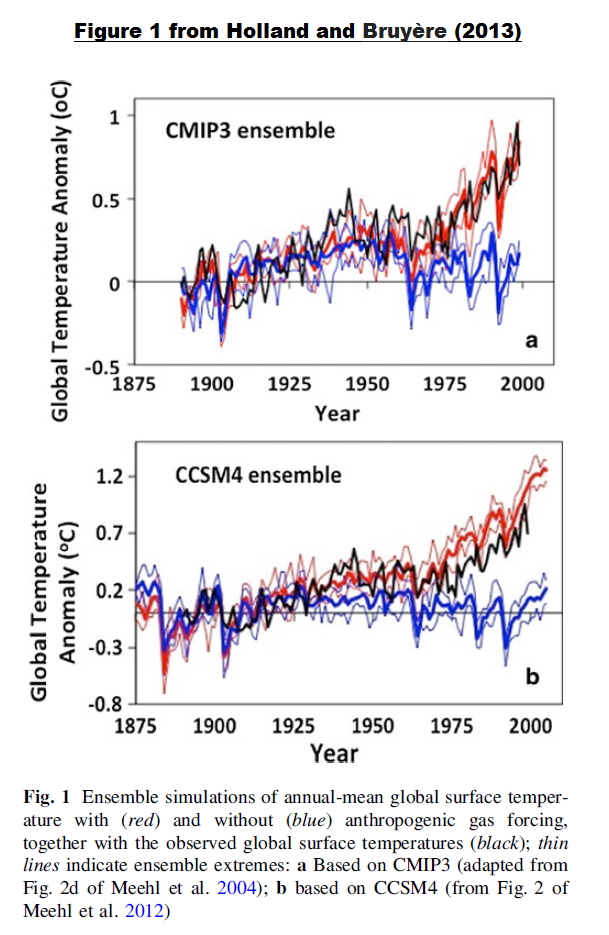
SkepticalScience is promoting the Holland and Bruyere (2013) paper Recent Intense Hurricane Response to Global Climate Change as proof positive that hypothetical human induced global warming has caused more intense hurricanes. See Dana Nuccitelli’s post New Research Shows Humans Causing More Intense Hurricanes. My Figure 1 is Figure 1 from Holland and Bruyere (2013).
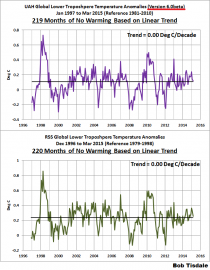
The abstract of Holland and Bruyere (2013) begins:
An Anthropogenic Climate Change Index (ACCI) is developed and used to investigate the potential global warming contribution to current tropical cyclone activity. The ACCI is defined as the difference between the means of ensembles of climate simulations with and without anthropogenic gases and aerosols. This index indicates that the bulk of the current anthropogenic warming has occurred in the past four decades, which enables improved confidence in assessing hurricane changes as it removes many of the data issues from previous eras.
Thats right; referring to Figure 1, Holland and Bruyere (2013) created an index by subtracting the multi-model mean of climate models forced by natural factors (variations in solar activity and volcanic aerosols) from the mean of the simulations that are also forced with anthropogenic factors like manmade greenhouse gases as if the two types of model simulations and their difference represent reality. They then used that model-based index, with little to no basis in the real world, for comparisons to hurricane activity at various hurricane strengths.
Hurricane activity is influenced by tropical sea surface temperatures. Yet, we know climate models cannot simulate sea surface temperatures over the past 31 years, which is included in the 1975 to 2010 period studied by Holland and Bruyere (2013). Refer to the post here for a model-data comparison of satellite-era sea surface temperature anomalies. And we’ve also discussed for 4 years how ocean heat content data and satellite-era sea surface temperature data indicate the oceans warmed naturally. Refer to the illustrated essay ”The Manmade Global Warming Challenge” [42MB]. The models are obviously flawed.
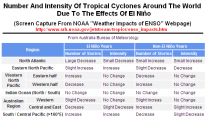
Hurricane activity is also influenced by the El Nino-Southern Oscillation (ENSO). There are fewer Atlantic hurricanes during El Nino years due to the increase in wind shear there. On the other hand, there’s an increase in the intensity of eastern tropical Pacific cyclones during El Nino years. See Table 1, which is from the NOAA Weather Impacts of ENSO webpage.
Does Holland and Bruyere (2013) consider ENSO? No. The words El Nino and La Nina do not appear in the paper, and ENSO appears only once, when they’re discussing the reason for the use of 5-year smoothing.
All variance numbers use the 5-years smoothed annual time series to remove ENSO type variability.
Can climate models simulate ENSO? The answer is also no. Refer to the post Guilyardi et al (2009) Understanding El Nino in Ocean-Atmosphere General Circulation Models: progress and challenges”.
Guilyardi et al (2009) includes:
Because ENSO is the dominant mode of climate variability at interannual time scales, the lack of consistency in the model predictions of the response of ENSO to global warming currently limits our confidence in using these predictions to address adaptive societal concerns, such as regional impacts or extremes (Joseph and Nigam 2006; Power et al. 2006).
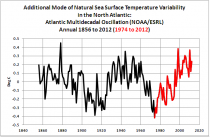
The multidecadal variability of the sea surface temperatures in the North Atlantic is called the Atlantic Multidecadal Oscillation or AMO. There are numerous papers that discuss the influence of the Atlantic Multidecadal Oscillation on hurricane activity. In fact, the NOAA Frequently Asked Questions About the Atlantic Multidecadal Oscillation (AMO) includes the question Does the AMO influence the intensity or the frequency of hurricanes (which)? Their answer reads:
The frequency of weak-category storms – tropical storms and weak hurricanes – is not much affected by the AMO. However, the number of weak storms that mature into major hurricanes is noticeably increased. Thus, the intensity is affected, but, clearly, the frequency of major hurricanes is also affected. In that sense, it is difficult to discriminate between frequency and intensity and the distinction becomes somewhat meaningless.
The AMO began its multidecadal rise in temperature in the mid-1970s. See Figure 2. By focusing their analysis on the period of 1975 to 2010, Holland and Bruyere (2013) appear to be, in part, attempting to blame manmade greenhouse gases for an increase in activity that’s already been attributed to the natural variability of the AMO.
Off topic note: Referring to Figure 1 from Holland and Bruyere (2013), notice how the surface temperature data ends in 1999 in cell b, while the models continue for a number of years beyond then, probably to the 2005 end year of the historic CMIP5 simulations. Apparently, some climate scientists haven’t figured out what assumption a reader is forced to make when he or she sees disparities in the end dates of model-data comparisons that the models would show very poorly if Holland and Bruyere (2013) had extended the data to the end year of the historic simulations, 2005, or to the end year of their study, which was 2010. Note also that the data begins after the start year of the models, too. In other words, most readers wonder what the authors are hiding and assume the worst.
CLOSING
Holland and Bruyere (2013) appears to be a flawed attempt to counter the findings of the recent (2012) IPCC Special Report on Managing the Risks of Extreme Events and Disasters to Advance Climate Change Adaptation (SREX). See the Summary for Policymakers here. The IPCC writes:
There is low confidence in any observed long-term (i.e., 40 years or more) increases in tropical cyclone activity (i.e., intensity, frequency, duration), after accounting for past changes in observing capabilities.
Holland and Bruyere (2013) is yet another peer-reviewed study that relies on climate models as if the models represent reality, when climate models clearly do not. Eventually, the climate science community will have to come to terms with this possibly not in my lifetime at the rate they’re going. And the portrayers of gloom and doom at SkepticalScience like Dana Nuccitelli somehow find papers like Holland and Bruyere (2013) to be credible. Nothing surprising about that.
By Joe D’Aleo, CCM
The last week have been well below normal, especially the north central. The last week anomalies are shown courtesy of weatherbell.com.
_thumb.png)
The anomalies Tuesday were negative 30F in the south central and central plains in the latest outbreak. The month has been below normal to date.
_thumb.png)
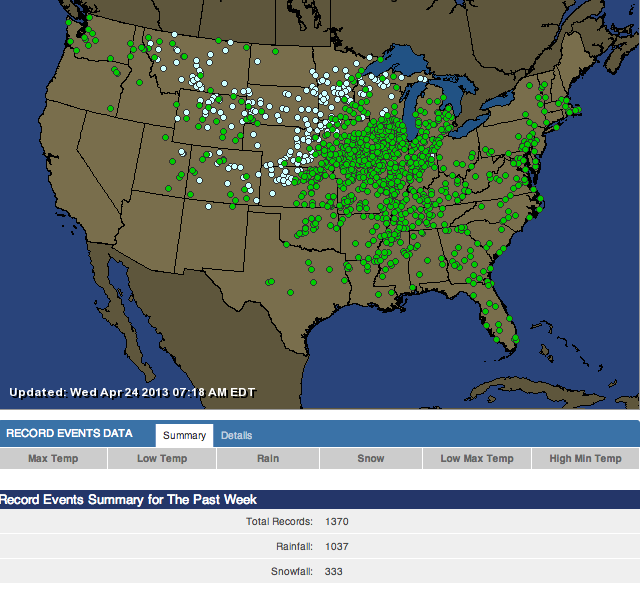
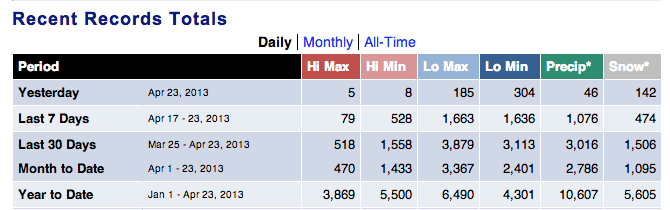
There were a large number of record lows (3750) the last week.
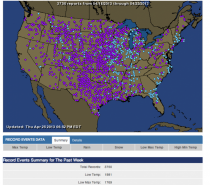
And 7,479 for the month.

Enlarged
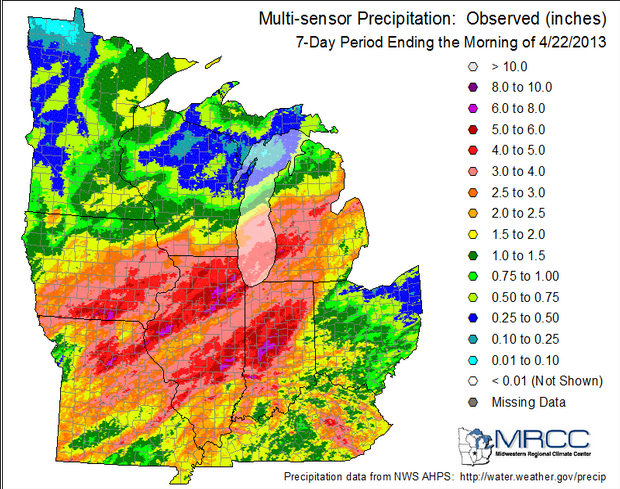
It was unusually wet and snowy in these areas this month and last few months.

Enlarged
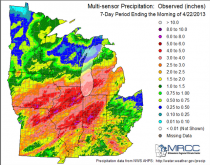
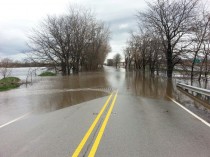
Ahead of the snowstorms, moisture fed north and heavy rains fell. Chicago had the wettest April on record. Record flooding in occurring on area rivers.
Record cold air plunged south into the plains behind the storms with 20s down to northern Texas.
_thumb.png)
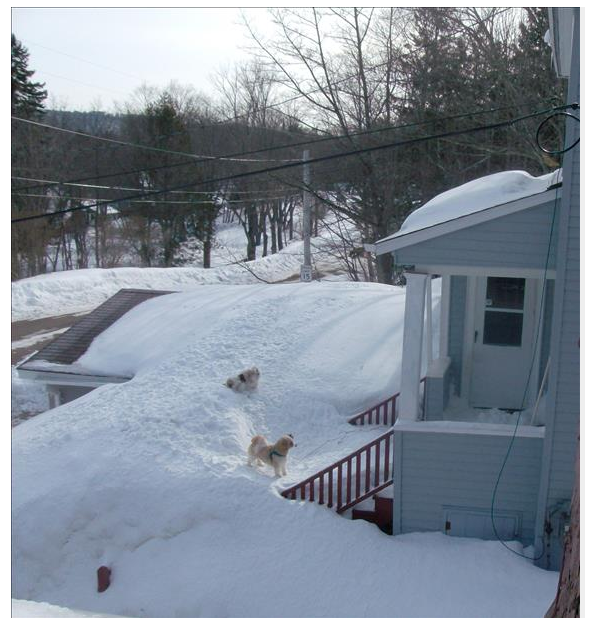
The snow remain deep in the north. Marquette has a snow depth of 30 inches with 5 to 12 inches of water in the snow in the UP. This will lead to flooding when melting there too and to the west on the Red River of the North begins this weekend.

See the list of cold, snow and rain records this month.

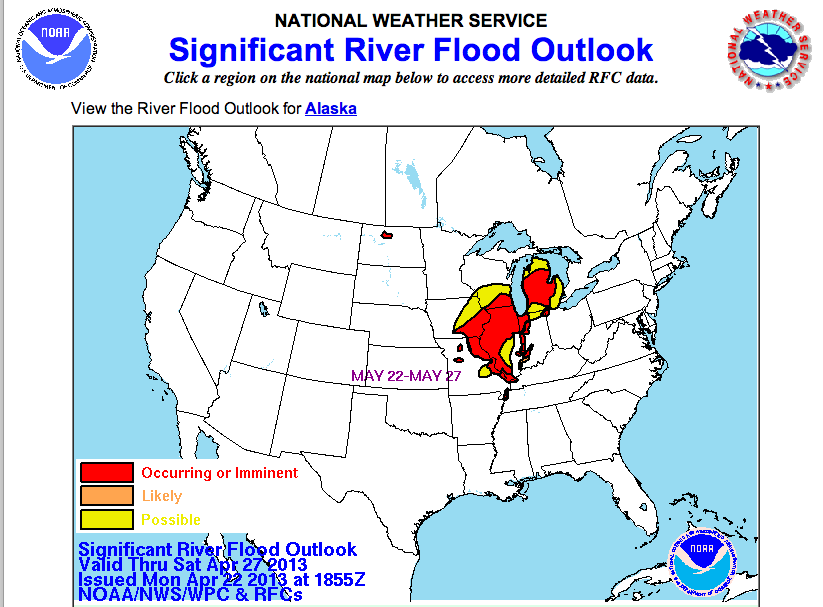
Here is the significant flood outlook.

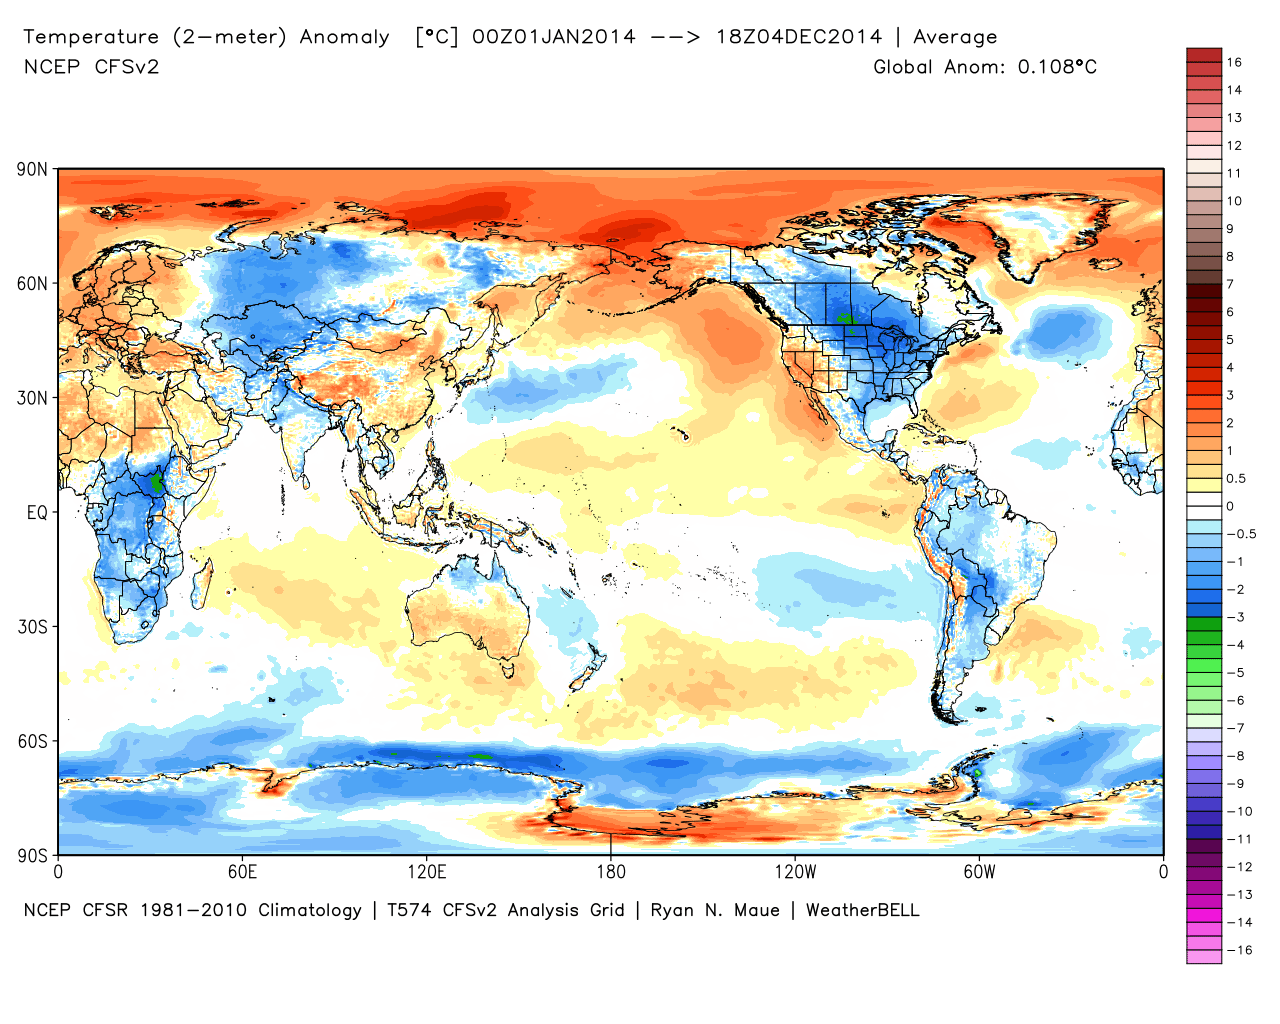
The year to date temperature anomalies show the cold in the US and from northern China and across northern Russia and Europe.

.png)
.png)
.png)
---------
Record cold in Fairbanks; it’s almost a certainty that this will be the first April since 1972 that the temperature at the Fairbanks airport won’t hit 50 degrees; thickest that Nenana ice has been this late in decades.
Interior shivers in record cold temps
Fairbanks FAIRBANKS - The winter that won’t end continued Sunday with record-low temperatures around the Interior.The low temperature at Fairbanks International Airport was 2 degrees above zero, which obliterated the old record of 8 above set in 1924. New records were set at Eagle (5 below), Eielson Air Force Base (1 above) and Delta Junction (3 above)....The temperature of 2 above Sunday was the third-lowest temperature this late in the spring at the airport, the weather service said. The last time it was colder than that in the spring was May 9, 1964, when the temperature at the airport was 1 below zero....Based on the forecast, which calls for highs in the mid 30s the next few days before warming into the 40s Thursday, it’s almost a certainty that this will be the first April since 1972 that the temperature at the Fairbanks airport won’t hit 50 degrees, Keller said.
In addition to the record cold Sunday morning, many places tied or broke records for the coldest high temperature on Saturday. The temperature failed to climb out of the 20s across much of the Interior. The high temperature of 29 degrees at the Fairbanks airport tied the coldest high temperature for that day, which was set in 1935....Through Saturday, this April is the third-coldest on record in more than 100 years in Fairbanks and there’s a chance it could end up the second-coldest before the end of the month. The average monthly temperature of 17.0 degrees through Saturday is 14.6 degrees below normal....The Tanana River ice in Nenana was still 51 inches thick Thursday when officials with the Nenana Ice Classic measured it. That’s the thickest the ice has been this late in decades.