

In 1991 the National Research Council proposed what has come to be a widely accepted definition of misconduct in science:
Misconduct in science is defined as fabrication, falsification, or plagiarism, in proposing, performing, or reporting research. Misconduct in science does not include errors of judgment; errors in the recording, selection, or analysis of data; differences in opinions involving the interpretation of data; or misconduct unrelated to the research process.
Arguments over data and methods are the lifeblood of science, and are not instances of misconduct.
However, here I document the gross misrepresentation of the findings of a recent scientific paper via press release which appears to skirt awfully close to crossing the line into research misconduct, as defined by the NRC. I recommend steps to fix this mess, saving face for all involved, and a chance for this small part of the climate community to take a step back toward unambiguous scientific integrity.
The paper I refer to is by Marcott et al. 2013, published recently in Science. A press release issued by the National Science Foundation, which funded the research, explains the core methodology and key conclusion of the paper as follows (emphasis added):
Peter Clark, an OSU paleoclimatologist and co-author of the Science paper, says that many previous temperature reconstructions were regional and not placed in a global context.
“When you just look at one part of the world, temperature history can be affected by regional climate processes like El Nino or monsoon variations,” says Clark. “But when you combine data from sites around the world, you can average out those regional anomalies and get a clear sense of the Earth’s global temperature history.”
What that history shows, the researchers say, is that during the last 5,000 years, the Earth on average cooled about 1.3 degrees Fahrenheit until the last 100 years, when it warmed about 1.3 degrees F.
The press release clearly explains that the paper (a) combines data from many sites around the world to create a “temperature reconstruction” which gives a “sense of the Earth’s temperature history,” and (b) “that history shows” a cooling over the past 5000 years, until the last 100 years when all of that cooling was reversed.
The conclusions of the press release were faithfully reported by a wide range of media outlets, and below I survey several of them to illustrate that the content of the press release was accurately reflected in media coverage and, at times, amplified by scientists both involved and not involved with the study.
Examples of Media Coverage
Here is Justin Gillis at the New York Times, with emphasis added to this excerpt and also those further below:
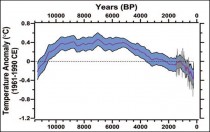
The modern rise that has recreated the temperatures of 5,000 years ago is occurring at an exceedingly rapid clip on a geological time scale, appearing in graphs in the new paper as a sharp vertical spike. Similarly, at the NY Times Andy Revkin reported much the same in a post titled, “Scientists Find an Abrupt Warm Jog After a Very Long Cooling.” Revkin included the following graph from the paper along with a caption explaining what the graph shows:
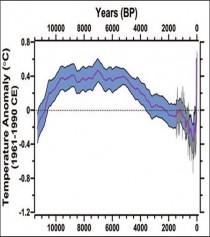
Revkin’s caption: A new Science paper includes this graph of data providing clues to past global temperature. It shows the warming as the last ice age ended (left), a period when temperatures were warmer than today, a cooling starting 5,000 years ago and an abrupt warming in the last 100 years. Revkin concluded: “the work reveals a fresh, and very long, climate “hockey stick."” For those unfamiliar, a hockey stick has a shaft and a blade.
Any association with the so-called “hockey stick” is sure to capture interest in the highly politicized context of the climate debate, in which the iconic figure is like catnip to partisans on both sides. Here is Michael Lemonick at Climate Central:
The study....confirms the now famous “hockey stick” graph that Michael Mann published more than a decade ago. That study showed a sharp upward temperature trend over the past century after more than a thousand years of relatively flat temperatures....
“What’s striking,” said lead author Shaun Marcott of Oregon State University in an interview, “is that the records we use are completely independent, and produce the same result.”
Here is Grist.org, which refers in the passage below to the same figure shown above:
A study published in Science reconstructs global temperatures further back than ever before a full 11,300 years. The new analysis finds that the only problem with Mann’s hockey stick was that its handle was about 9,000 years too short. The rate of warming over the last 100 years hasn’t been seen for as far back as the advent of agriculture.
To be clear, the study finds that temperatures in about a fifth of this historical period were higher than they are today. But the key, said lead author Shaun Marcott of Oregon State University, is that temperatures are shooting through the roof faster than we’ve ever seen.
“What we found is that temperatures increased in the last 100 years as much as they had cooled in the last 6,000 or 7,000,” he said. “In other words, the rate of change is much greater than anything we’ve seen in the whole Holocene,” referring to the current geologic time period, which began around 11,500 years ago.
Back to more mainstream outlets, here is how Nature characterized the study, offering a substantially similar but somewhat more technical description of the curve shown in the figure above:
Marcott and his colleagues set about reconstructing global climate trends all the way back to 11,300 years ago, when the Northern Hemisphere was emerging from the most recent ice age. To do so, they collected and analysed data gathered by other teams. The 73 overlapping climate records that they considered included sediment cores drilled from lake bottoms and sea floors around the world, along with a handful of ice cores collected in Antarctica and Greenland.
Each of these chronicles spanned at least 6,500 years, and each included a millennium-long baseline period beginning in the middle of the post-ice-age period at 3550 bc.
For some records, the researchers inferred past temperatures from the ratio of magnesium and calcium ions in the shells of microscopic creatures that had died and dropped to the ocean floor; for others, they measured the lengths of long-chain organic molecules called alkenones that were trapped in the sediments.
After the ice age, they found, global average temperatures rose until they reached a plateau between 7550 and 3550 bc. Then a long-term cooling trend set in, reaching its lowest temperature extreme between ad 1450 and 1850. Since then, temperatures have been increasing at a dramatic clip: from the first decade of the twentieth century to now, global average temperatures rose from near their coldest point since the ice age to nearly their warmest, Marcott and his team report today in Science.
And here is New Scientist, making reference to the exact same graph:
Shaun Marcott of Oregon State University in Corvallis and colleagues have compiled 73 such proxies from around the world, all of which reach back to the end of the last glacial period, 11,300 years ago. During this period, known as the Holocene, the climate has been relatively warm and civilisation has flourished.
“Most global temperature reconstructions have only spanned the past 2000 years,” says Marcott.
Marcott’s graph shows temperatures rising slowly after the ice age, until they peaked 9500 years ago. The total rise over that period was about 0.6 C. They then held steady until around 5500 years ago, when they began slowly falling again until around 1850. The drop was 0.7 C, roughly reversing the previous rise.
Then, in the late 19th century, the graph shows temperatures shooting up, driven by humanity’s greenhouse gas emissions.
The rate of warming in the last 150 years is unlike anything that happened in at least 11,000 years, says Michael Mann of the Pennsylvania State University in University Park, who was not involved in Marcott’s study. It was Mann who created the original hockey stick graph (see upper graph here), which showed the change in global temperatures over the last 1000 years.
Over the Holocene, temperatures rose and fell less than 1 C, and they did so over thousands of years, says Marcott. “It took 8000 years to go from warm to cold.” Agriculture, communal life and forms of government all arose during this relatively stable period, he adds. Then in 100 years, global temperatures suddenly shot up again to very close to the previous maximum.
It seems clear that even as various media took different angles on the story and covered it in varying degrees of technical detail, the articles listed above accurately reflected the conclusions reflected in the NSF press release, and specifically the “hockey stick” like character of the new temperature reconstruction. Unfortunately, all of this is just wrong, as I explain below. (If you’d like to explore media coverage further here is a link to more stories. My colleague Tom Yulsman got punked too.)
The Problem with the NSF Press Release and the Subsequent Reporting
There is a big problem with the media reporting of the new paper. It contains a fundamental error which (apparently) originates in the NSF press release and which was furthered by public comments by scientists.
In a belatedly-posted FAQ to the paper, which appeared on Real Climate earlier today, Marcott et al. make this startling admission:
Q: What do paleotemperature reconstructions show about the temperature of the last 100 years?
A: Our global paleotemperature reconstruction includes a so-called “uptick” in temperatures during the 20th-century. However, in the paper we make the point that this particular feature is of shorter duration than the inherent smoothing in our statistical averaging procedure, and that it is based on only a few available paleo-reconstructions of the type we used. Thus, the 20th century portion of our paleotemperature stack is not statistically robust, cannot be considered representative of global temperature changes, and therefore is not the basis of any of our conclusions.
Got that?
In case you missed it, I repeat:
. . . the 20th century portion of our paleotemperature stack is not statistically robust, cannot be considered representative of global temperature changes
What that means is that this paper actually has nothing to do with a “hockey stick” as it does not have the ability to reproduce 20th century temperatures in a manner that is “statistically robust.” The new “hockey stick” is no such thing as Marcott et al. has no blade. (To be absolutely clear, I am not making a point about temperatures of the 20th century, but what can be concluded from the paper about temperatures of the 20th century.)
Yet, you might recall that the NSF press release said something quite different:
What that [temperature reconstruction] history shows, the researchers say, is that during the last 5,000 years, the Earth on average cooled about 1.3 degrees Fahrenheit--until the last 100 years, when it warmed about 1.3 degrees F.
So what the paper actually shows is the following, after I have removed from the graph the 20th century period that is “not statistically robust” (this is also the figure that appears at the top of this post):
Surely there is great value in such an analysis of pre-20th century temperatures. And there can be no doubt there will be continuing debates and discussions about the paper’s methods and conclusions. But one point that any observer should be able to clearly conclude is that the public representation of the paper was grossly in error. The temperature reconstruction does not allow any conclusions to be made about the period after 1900.
Does the public misrepresentation amount to scientific misconduct? I’m not sure, but it is far too close to that line for comfort. Saying so typically leads to a torrent of angry ad hominem and defensive attacks, and evokes little in the way of actual concern for the integrity of this highly politicized area of science. Looking past the predictable responses, this mess can be fixed in a relatively straightforward manner with everyone’s reputation intact.
How to Fix This
Here are the steps that I recommend should be taken:
1) Science should issue a correction to the paper, and specially do the following:
(a) retract and replot all figures in the paper and SI eliminating from the graphs all data/results that fail to meet the paper’s criteria for “statistical robustness.”
(b) include in the correction the explicit and unambiguous statement offered in the FAQ released today that the analysis is not “statistically robust” post-1900.
2) NSF should issue a correction to its press release, clarifying and correcting the statements of Peter Clark (a co-author, found above) and Candace Major, NSF program manager, who says in the release:
“The last century stands out as the anomaly in this record of global temperature since the end of the last ice age,” says Candace Major, program director in the National Science Foundation’s (NSF) Division of Ocean Sciences.
3) The New York Times (Gillis and Revkin, in particular), Nature and New Scientist as outlets that pride themselves in accurate reporting of science should update their stories with corrections. Grist and Climate Central should consider the same.
[UPDATE: Andy Revkin at DotEarth has updated his posts here and here to reference the “lost blade” from the hockey stick and link to this post. That was quick and easy. Others take note.]
Let me be perfectly clear - I am accusing no one of scientific misconduct. The errors documented here could have been the product of group dynamics, institutional dysfunction, miscommunication, sloppiness or laziness (do note that misconduct can result absent explicit intent). However, what matters most now is how the relevant parties respond to the identification of a clear misrepresentation of a scientific paper by those who should not make such errors.
That response will say a lot about how this small but visible part of the climate community views the importance of scientific integrity.
Rockefeller billions vs Canadian energy and sovereignty - and US jobs, security and families
Americans concerned about gasoline prices were encouraged by the Pew Research Center’s new poll, whose headline blared, “Keystone XL Pipeline draws broad support.” A score box showed 63% supporting and only 23% opposing the pipeline that would transport oil from Canada’s vast Alberta oil sands deposits through the Plains states to Texas refineries.
“Every one-cent increase at the pump steals about $1 billion from the larger economy that consumers would have otherwise saved or spent on something else,” the Wall Street Journal has pointed out. High gasoline prices thus translate into lost jobs, lost tax revenues and lower living standards. Americans are beginning to understand that, as the Obama “recovery” gives them real-world economic lessons.
Unfortunately, the Pew report quickly deflated optimism over this support, when it tersely identified who the minority is: “liberals” stanchions of Big Green’s circus tent. We have seen time and again that the liberal 23% can be a “majority” to President Obama, who wields executive orders to bypass the people.
As his administration approaches a decision, lame-duck politics says he could go either way even with his own State Department’s second favorable environmental impact report on the KXL’s construction permit. Even with Alberta Premier Alison Redford saying that an Obama rejection would damage U.S.-Canada relations. “Canada relies on the U.S. for 97% of its energy exports,” Redford said, and “sees the new pipeline as critical to its economic well-being.” And even with ten governors and 22 lieutenant governors sending letters to the President, urging pipeline approval.
What is Obama likely to do? Some 82% of Republicans favor the pipeline, so revenge is not an unthinkable motive for a possible rejection. However, 70% of independents and 54% of Democrats also favor the KXL. Fogging the crystal ball is the ideological split among Democrats: 60% of the party’s conservatives and moderates support building the pipeline, compared to just 42% of liberal Democrats. That considerably flattens Obama’s upward slope toward a potential rejection, but doesn’t level it.
Obama’s decision may hinge on pleasing his base of global-warming advocates. This whole Keystone XL controversy was carefully conceived and organized as a “globally significant response” to global warming. Shutting down Alberta’s oil sands by blocking both the US-bound Keystone XL pipeline and any other Alberta oil conduit, particularly a proposed link to Vancouver, British Columbia harbors and oil tankers bound for Asia would supposedly reduce global warming. That’s propaganda, not reality.
As Environment Canada has observed, oil sands production contributes a mere 0.14% of global greenhouse gases, notes, and would add an undetectable 0.00001 degrees C per year to global warming, even if carbon dioxide and other greenhouse gases really do drive climate change.
The anti-oil sands campaign, activists call them “tar sands” to evoke ugly images, was devised by the New York City-based Rockefeller Brothers Fund, using earmarked grants to recruit “a network of leading US and Canadian NGOs” and establish a “coordinated campaign structure” to act as its public face, according to a leaked PowerPoint presentation.
The first slide says, “The Tar Sands Campaign, Michael Northrop, Program Officer, Rockefeller Brothers Fund, July 2008.” Seven slides drive home the message that Rockefeller wants its paid campaigners to emphasize: Oil sands and Keystone represent “a globally significant threat” with “Global Warming,” and “Oil Addiction” as the two “thought leader slogans” in the parade of old shibboleths that trigger brain freeze in Big Green followers. The rest was a coldly calculated, very practical plan to destroy Canada’s single most important export, with Rockefeller giving $7 million per year to activist groups to do the job.
Thinking people understand that being “addicted to oil” is like being addicted to breathing, better living standards, improved health and life itself. Just try getting along without it in a world where fossil fuels (oil, gas and coal) contributed 82% of US energy use in 2012. The “green alternative” (wind and solar) provided a mere 3.3% of our overall needs in 2012; the rest was nuclear, hydroelectric and biomass (mostly wood). Relying on the “green alternative” is like trying to inhale only 3.3% as much as you usually do. There’s an energy gap there we need to account for.
Canadian researcher Vivian Krause exposed the Rockefeller funding for campaigns against Canadian energy exports in her October 2010 Financial Post story, “US foundations against the oil sands.” Five US foundations, including the Rockefeller Brothers Fund, funneled vast sums of money through the Tides Foundation’s Canadian organization, Tides Canada. The Tides family of operations is a notorious California-based funder of left-wing activists.
Krause wrote, “A large part of Tides Canada’s funding comes from the Gordon & Betty Moore Foundation, the William & Flora Hewlett Foundation, the David & Lucile Packard Foundation, the Pew Charitable Trusts and the Rockefeller Brothers Fund. These are The Big Five. They give away about US$1.2 billion every year.” In a chilling reminder, she concluded, “If these foundations decide to undermine a foreign industry, they probably can.”
Later that fall, Krause testified before a Canadian House of Commons committee, prompting an audit of the Canadian arm of the Tides Foundation by the Canada Revenue Agency (Canada’s equivalent to the IRS). By Krause’s calculations, Tides, a co-funder of the Rockefeller oil sands campaign, has distributed $19 million to anti-Keystone groups since 2008.
Krause explains that the campaign strategy is intended to foster renewable energy by shifting investment capital away from so-called “dirty oil” and toward so-called “clean energy.” To this end, she said, “they ‘educate’ media, consumers and voters. They stigmatize fossil fuels as bad, thereby facilitating the positioning of renewables as good. It’s basic product positioning and ‘depositioning’ the competitor.”
Not surprisingly, the “education” is slanted. “We get only bad news about fossil fuels and good news about solar and wind,” Krause observes. “We don"t get the whole story.” What gets left out are the advantages of fossil fuels and the limitations and harmful effects of renewables, like the tiny amount of energy they provide, and the terrible impacts they have on birds, bats and wildlife habitats. “Furthermore, some of the information that is perpetuated is out-dated, and some is plainly false.”
I asked Krause why the Rockefeller presence behind the anti-XL propaganda campaign was virtually invisible. She told me that it has been done quietly but not secretly. “The grants have been disclosed in online databases for years,” she said. “But nobody bothered to add them up and connect the dots.” Krause connected the dots to the networks of foundations that work together on targeted projects.
She directed me to a revealing but obscure source, “Design to Win: Philanthropy’s Role in the Fight Against Global Warming,” which was sponsored by six of “the usual suspects” I have learned to expect to find behind any global warming campaign: the David and Lucile Packard Foundation, Doris Duke Charitable Foundation, Energy Foundation, Joyce Foundation, Oak Foundation, and William and Flora Hewlett Foundation.
Another source was, “A Strategy Planning Tool for Western Conservation,” prepared for the Hewlett Foundation by the Redstone Strategy Group, a brain pool of Ivy League hotshots not to be trifled with. Their strategy is to create eight massive national parks, each the size of Switzerland, as a way to stop the development of fossil fuels. Just fence industry out with parks or Antiquities Act designations.
Anyone who thinks their local grassroots green group just pops up spontaneously in occasional protests needs to read either of these documents. They will find that the “roots” under the environmentalist “grass” are fertilized with bales of hundred dollar bills. Rockefeller’s actions are quite open, if quiet. Krause said, “The strategy is articulated in discussion papers, but who reads them?”
Nobody except Vivian Krause, evidently. Her Twitter account, atFairQuestions, says, “I follow the money & the science behind enviro campaigns.” Her research and writing are impressive. Her blog profile states, “I work from my dining room table, using Google, on my own nickel. Not part of any political party, any industry, or any campaign.” Her work deserves more attention in the United States.
Krause’s discovery and expose of the Rockefeller millions behind the anti-Keystone XL campaign could become a factor in Obama’s pipeline construction decision. It has already created Canadian suspicion of environmental groups dancing on the strings of US foundation money.
It’s not the money itself Canadians fear. It’s the way bales of US foundation cash can buy pressure by proxy, to impose undue foreign influence over Canada’s national energy policy and sovereignty.
One must hope Mr. Obama does not wish to be suspected of dancing on the same Rockefeller policy puppet strings as the Big Green bigwigs who were recently arrested protesting at his front door.
-------
Columnist Ron Arnold is executive vice president of the Center for the Defense of Free Enterprise. Portions of this report appeared originally in the Washington Examiner and are used by permission.
By Ed Rogers, Washington Post Updated: April 11, 2013
As I said last week, fewer Americans view global warming as a “very serious problem” today than just six months ago. In October, 39 percent of Americans viewed global warming as a very serious problem, compared with 33 percent who believe that to be true today. Carter is the pollster, but by my back-of-the-envelope math, if you exclude partisan Democrats who will follow President Obama on everything, you’re left with about 25 percent of Americans who think that global warming is a very serious problem.
Even worse for Carter and the Democrats who are hoping to make real progress in the 2014 elections, the Huffington Post/YouGov poll conducted the week that Hurricane Sandy hit asked the question, “If it meant we could stop climate change, would you personally be willing to pay 50 percent more on your gas and electricity bills?” 54 percent of respondents - a clear majority - said that they would not be willing (including 52.5 percent of independents and 80 percent of Republicans). Only 21 percent said they would be willing to pay more.
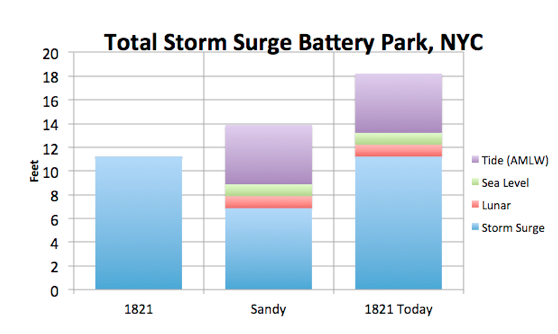
The ‘never let a crisis go to waste’ party attempted to use Sandy to push its green agenda and crony capitalism. They did not know or acknowledge Sandy was a weak CAT1 storm and the last time the oceans were in this mode in the middle of the last century 8 major hurricanes made landfall on the east coast. Hurricanes made a direct hit on NYC in 1815, 1821 and 1893. The worst in 1821 at the end of the mini-ice age was a CAT3 storm but it came ashore at low tide while Sandy came in at a more problematic angle, at high tide and with a full moon. 155,000 people lived in NYC in 1821 and there were no subways or tunnels to flood. That compares to 8.2 million at risk today and much development on barrier beaches and even landfill. Had the 1821 storm hit today, the storm surge would be 5 feet higher and devastation would be far worse than Sandy.

So even when using a question that leads those polled to think they could “stop climate change” once and for all, a majority of Americans still says no to paying more out of pocket to do so. Again, I would defer to Carter, but it seems that those most likely to vote in the 2014 elections would be heavily against the increased costs that the Democrats favor, even for doing even less than “stopping climate change.”
Higher energy prices and the Democrats’ pointless follies on global warming, when combined with our fragile, discouraging economy, means that climate change is probably leaving the stage as a political issue - just as President Obama is trying to gather momentum for a major push. It’ll be interesting to see whether the White House gracefully goes quiet on the issue.
The Democrats are increasingly preaching to the choir about climate change, partially because of the state of the economy but also because of the hypocrisy that surrounds the issue. People notice that those who preach the loudest seem disproportionately to fly in private jets, sleep in mansions, float on yachts and otherwise (have ? BB) lifestyles that produce high levels of carbon emissions - the occasional pious Prius puttering along in Hollywood or elsewhere notwithstanding.
-----------
Desparation science
“Analyses like these by people who don’t know the field are useless. A good example is Naomi Oreskes work.” - Tom Wigley, Fellow, American Association for the Advancement of Science (AAAS)
In the never ending quest for alarmists to one up their incompetent friends they continue to seek out new ways to demonstrate their own computer illiteracy (as per Oreskes). Enter James Powell who in a meaningless analysis is apparently ignorant that the ‘Web of Science’ database does not have a “peer-reviewed” only filter and the existence of a search phrase in a returned result does not determine it’s context. Thus, all that can be claimed is there were 13,950 meaningless search results no “peer-reviewed scientific articles” for a query of the ‘Web of Science’ database - 24 of which support his strawman arguments.
Conclusion
In a true sense of irony Powell uses his meaningless analysis as a defense of Oreskes (2004) which is considered useless by world renowned climate experts,
He then attempts to smear skeptics as “global warming deniers”. This is a dishonest ad hominem as skeptics believe there has been a global temperature increase of a fraction of a degree since the end of the little ice age.
Powell’s pie chart is simply propaganda for those who are intellectual dishonest and want to be intentionally misleading about actual skeptic arguments or the over 1100 peer-reviewed papers that support them.
Read Popular Technology’s full analysis here.