

With this newspaper arguing that our planet is in peril and that its remedies should be followed, global warming has again arisen as a hot political and pseudo-religious topic. Even professors from the University of Kentucky bear witness to their faith, professors who should know that science has nothing to do with faith or claims of consensus. Objective science is about logic and evidence only.
Albert Einstein understood this when his Theory of Relativity turned the classical physics world upside-down in 1905. He patiently waited decades for experimental confirmation, emphasizing that “one man can prove me wrong.” What a contrast with global warming, where proponents offer popularity, authority and peer-review as definitive substitutes for real science.
What do we mean by “global warming?” It is not “climate change,” “climate disruption” or whatever truism propagandists invent. We mean the theory that man-made carbon dioxide is catastrophically warming the Earth.
Nobel Laureate in physics Ivar Giaever says that the tiny observed increase of 0.8 degree Centigrade over the 20th century indicates remarkable stability and no cause for alarm.
Meteorologist and staunch Democrat Martin Hertzberg points out that we experimented with carbon reduction schemes in the 1930s. These reduced fossil fuel usage by 20 percent and went by the memorable name Great Depression. Mother Nature had the last laugh as temperatures and CO2 levels continued upward, proving that man is not as important as he thinks.
After World War II, the post-war boom saw an expansion of human CO2 emissions but a decline in the global temperature. After the Great Pacific Climate Shift of 1977, when the Pacific Ocean shifted to its warm phase, we finally saw temperatures rise in concert with man-made CO2.
What has especially confused climate alarmists has been the abrupt cessation of warming since 1998, as shown by NASA satellite measurements, the best global temperature measurements we have.
For advocates to prove that increasing carbon dioxide has any effect on temperature, they need to find a unique signature that would be expected only from carbon dioxide and not from ocean or solar cycles.
The notorious climate codes which erroneously forecast rapidly rising temperatures predict such a signature developing in the tropical troposphere. But the “hot spot” is not observed. This says that late 20th-century warming had at most a small greenhouse gas component.
Because the high quality temperature reconstructions from polar ice cores show far greater temperature variations in the past than seen recently, there is no way a rational person can argue that anything unusual is happening today. Previous warm periods (Minoan, Roman and Medieval) were all warmer than today and ramped up in similar fashion.
During this Holocene interglacial period, the overall temperature trend has been downward as the Earth’s closest approach to the Sun has shifted from the Northern to Southern Hemisphere summer over 10,000 years. This is part of the Milankovitch Cycles known to dominate the Earth’s climate for at least the last half million years.
The enormous shift of 85 watts/m2 of sunlight from July to January is what brings us to the brink of another Ice Age. But don’t trade your swimsuit for a heavy winter parka just yet, because our oceans contain the vast majority of mobile heat on this planet and will prevent a precipitous plunge into another Ice Age.
With ocean cycles now negative or heading negative, and with the abrupt decrease in solar activity reminiscent of the cold Maunder Minimum of the 17th century, a cooler future appears inevitable.
The expected cooling should slow or slightly reverse in 50 to 100 years, according to Habibullo Abdussamatov, a top Russian astrophysicist. However another warm period happens only once every 1,000-plus years. If we plunge into an ice age first, you will have to wait about 100,000 years. Massive ice sheets reach south of Indianapolis during ice ages.
Will carbon-dioxide warming save us? Harvard-Smithsonian astrophysicist Willie Soon gives a blunt answer: “It’s the sun, stupid.”
While Kentuckians may seek supernatural explanations for their brutal summer weather, they should realize that many did not see a hot June and July. We in the Pacific Northwest and many in Europe were complaining of unusual cold.
The ancient Egyptians had it right 3,500 years before the dawn of modern science. The primary Climate God is Amon Ra, the God of the Sun. The God of Carbon Dioxide, Al Gore, is but a minor contender.
From the American Geophysical Union
WASHINGTON - Scientists have long suspected that the Sun’s 11-year cycle influences climate of certain regions on Earth. Yet records of average, seasonal temperatures do not date back far enough to confirm any patterns. Now, armed with a unique proxy, an international team of researchers show that unusually cold winters in Central Europe are related to low solar activity - when sunspot numbers are minimal. The freezing of Germany’s largest river, the Rhine, is the key.
Although the Earth’s surface overall continues to warm, the new analysis has revealed a correlation between periods of low activity of the Sun and of some cooling - on a limited, regional scale in Central Europe, along the Rhine.
“The advantage with studying the Rhine is because it’s a very simple measurement,” said Frank Sirocko lead author of a paper on the study and professor of Sedimentology and Paleoclimatology at the Institute of Geosciences of Johannes Gutenberg University in Mainz, Germany. “Freezing is special in that it’s like an on-off mode. Either there is ice or there is no ice.”
From the early 19th through mid-20th centuries, riverboat men used the Rhine for cargo transport. And so docks along the river have annual records of when ice clogged the waterway and stymied shipping. The scientists used these easily-accessible documents, as well as additional historical accounts, to determine the number of freezing episodes since 1780.
Sirocko and his colleagues found that between 1780 and 1963, the Rhine froze in multiple places 14 different times. The sheer size of the river means it takes extremely cold temperatures to freeze over making freezing episodes a good proxy for very cold winters in the region, Sirocko said.
Mapping the freezing episodes against the solar activity’s 11-year cycle - a cycle of the Sun’s varying magnetic strength and thus total radiation output - Sirocko and his colleagues determined that ten of the fourteen freezes occurred during years around when the Sun had minimal sunspots. Using statistical methods, the scientists calculated that there is a 99 percent chance that extremely cold Central European winters and low solar activity are inherently linked.
“We provide, for the first time, statistically robust evidence that the succession of cold winters during the last 230 years in Central Europe has a common cause,” Sirocko said.
With the new paper, Sirocko and his colleagues have added to the research linking solar variability with climate, said Thomas Crowley, Director of the Scottish Alliance for Geoscience, Environment, and Society, who was not involved with the study.
“There is some suspension of belief in this link,” Crowley said, “and this study tilts the argument more towards thinking there really is something to this link. If you have more statistical evidence to support this explanation, one is more likely to say it’s true.”
The study, conducted by researchers at Johannes Gutenberg and the Institute for Atmospheric and Climate Science in Zurich, Switzerland, is set to be published August 25 in Geophysical Research Letters, a journal of the American Geophysical Union.
When sunspot numbers are down, the Sun emits less ultraviolet radiation. Less radiation means less heating of Earth’s atmosphere, which sparks a change in the circulation patterns of the two lowest atmospheric levels, the troposphere and stratosphere. Such changes lead to climatic phenomena such as the North Atlantic Oscillation, a pattern of atmospheric pressure variations that influences wind patterns in the North Atlantic and weather behavior in regions in and around Europe.
“Due to this indirect effect, the solar cycle does not impact hemispherically averaged temperatures, but only leads to regional temperature anomalies,” said Stephan Pfahl, a co-author of the study who is now at the Institute for Atmospheric and Climate Science in Zurich.
The authors show that this change in atmospheric circulation leads to cooling in parts of Central Europe but warming in other European countries, such as Iceland. So, sunspots don’t necessarily cool the entire globe - their cooling effect is more localized, Sirocko said.
In fact, studies have suggested that the extremely cold European winters of 2010 and 2011 were the result of the North Atlantic Oscillation, which Sirocko and his team now link to the low solar activity during that time.
The 2010 and 2011 European winters were so cold that they resulted in record lows for the month of November in certain countries. Some who dispute the occurrence of anthropogenic climate change argue that this two-year period shows that Earth’s climate is not getting any warmer. But climate is a complex system, Sirocko said. And a short-term, localized dip in temperatures only temporarily masks the effects of a warming world.
“Climate is not ruled by one variable,” said Sirocko. “In fact, it has [at least] five or six variables. Carbon dioxide is certainly one, but solar activity is also one.”
Moreover, the researchers also point out that, despite Central Europe’s prospect to suffer colder winters every 11 years or so, the average temperature of those winters is increasing and has been for the past three decades. As one piece of evidence of that warming, the Rhine River has not frozen over since 1963. Sirocko said such warming results, in part, from climate change.
To establish a more complete record of past temperature dips, the researchers are looking to other proxies, such as the spread of disease and migratory habits.
“Disease can be transported by insects and rats, but during a strong freezing year that is not likely,” said Sirocko. “Also, Romans used the Rhine to defend against the Germanics, but as soon as the river froze people could move across it. The freezing of the Rhine is very important on historical timescales.”
It wasn’t, however, the Rhine that first got Sirocko to thinking about the connection between freezing rivers and sunspot activity. In fact, it was a 125-mile ice-skating race he attended over 20 years ago in the Netherlands that sparked the scientist’s idea.
“Skaters can only do this race every 10 or 11 years because that’s when the rivers freeze up,” Sirocko said. “I thought to myself, ‘There must be a reason for this,’ and it turns out there is.”
Title:
“Solar influence on winter severity in central Europe”
Abstract:
The last two winters in central Europe were unusually cold in comparison to the years before. Meteorological data, mainly from the last 50 years, and modelling studies have suggested that both solar activity and El Niño strength may influence such central European winter coldness. To investigate the mechanisms behind this in a statistically robust way and to test which of the two factors was more important during the last 230 years back into the Little Ice Age, we use historical reports of freezing of the river Rhine. The historical data show that 10 of the 14 freeze years occurred close to sunspot minima and only one during a year of moderate El Niño. This solar influence is underpinned by corresponding atmospheric circulation anomalies in reanalysis data covering the period 1871 to 2008. Accordingly, weak solar activity is empirically related to extremely cold winter conditions in Europe also on such long time scales. This relationship still holds today, however the average winter temperatures have been rising during the last decades.
Authors:
Frank Sirocko and Heiko Brunck: Institute of Geosciences, Johannes Gutenberg University Mainz;
Stephan Pfahl: Institute for Atmospheric and Climate Science, ETH Zurich, Switzerland
=======
UPDATE: Dr. Leif Svalgaard provides the paper, as did the AGU press agent Kate Ramsayer per my emailed request, along with a copyright admonishment. Thank you both. Figure 6a and 6b are interesting:
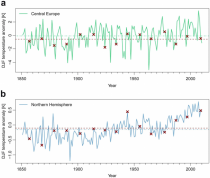
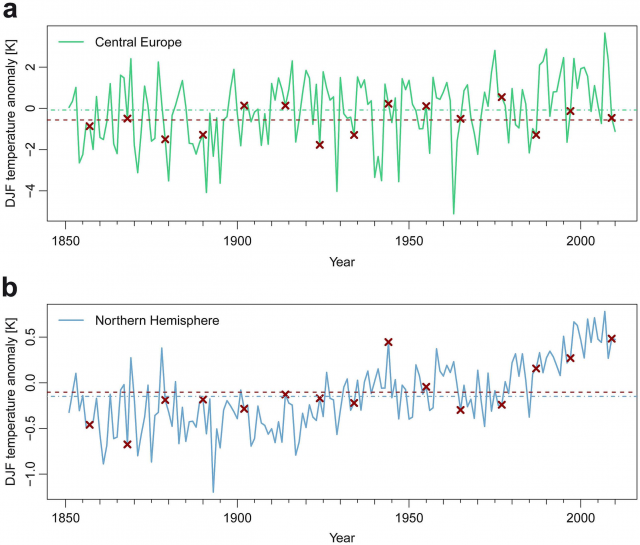
Amidst Obama’s inexorable war on American energy, consumers, jobs, and prosperity, his EPA is in the process of promulgating 4 new pollution rules that will bury the coal industry and “necessarily” raise the price of electricity on American households. They are the Cross-State Air Pollution Rule, the Mercury and Air Toxics Standards for Utilities (MACT), the Cooling Water Intake Structures regulation, and the Disposal of Coal Combustion residuals. The former two have already been finalized while the latter two are close behind. Today, the D.C. Circuit Court struck down the EPA’s authority to implement the Cross-State Air Pollution Rule.
In August 2011, Obama’s EPA imposed a cap and trade style program to expand existing limitations on sulfur dioxide and nitrogen oxide emissions from coal-fired power plants in 28 “upwind” states. They claimed that they had unlimited authority pursuant to the Clean Air Act to cap emissions that supposedly travel across state lines. The EPA admitted that the rule would cost $2.7 billion from the private sector and force many cole-fired power plants to shut down. Priorities USA might have even run an ad against Obama claiming that his superfluous regulations cause workers to lose their health insurance and die.
Luckily, several southern states decided to sue the EPA in federal court. In EME HOMER CITY GENERATION, L.P. v. EPA, the D.C. Circuit Court of Appeals ruled 2-1 that the EPA had exceeded its authority under the Clean Air Act in two respects:
First, the statutory text grants EPA authority to require upwind States to reduce only their own significant contributions to a downwind State’s nonattainment. But under the Transport Rule, upwind States may be required to reduce emissions by more than their own significant contributions to a downwind State’s nonattainment. EPA has used the good neighbor provision to impose massive emissions reduction requirements on upwind States without regard to the limits imposed by the statutory text. Whatever its merits as a policy matter, EPA’s Transport Rule violates the statute. Second, the Clean Air Act affords States the initial opportunity to implement reductions required by EPA under the good neighbor provision. But here, when EPA quantified States’ good neighbor obligations, it did not allow the States the initial opportunity to implement the required reductions with respect to sources within their borders. Instead, EPA quantified States’ good neighbor obligations and simultaneously set forth EPA-designed Federal Implementation Plans, or FIPs, to implement those obligations at the State level. By doing so, EPA departed from its consistent prior approach to implementing the good neighbor provision and violated the Act.
Judge Brett Kavanaugh, who wrote the majority opinion, created more jobs with that decision that Obama did throughout his tenure.
While this is definitely a big victory, and underscores the importance of putting conservatives on the DC Circuit Court (which has original jurisdiction over many federal policy issues), we still need to continue a robust legislative assault against these cap and trade style regulations. The Clean Air Act and Clean Water Act still serve as an albatross around the necks of job creators and can still be used to justify many of the impending regulations, even after the court’s decision.
When Republicans take back control of government, they must move to roll back most federal involvement in regulation of pollution. With the states more than happy to pick up the slack, especially the blue states, federal involvement in this regulatory scheme can only be harmful. Rules and regulations that could potentially affect the lifeline of local economies must only be debated and implemented on a local level.
--------------------
Listen to this excellent interview with meteorologist Anthony Sadar, CCM, Air Pollution Meteorologist (In Global Warming We Trust, a Heretics Guide)
Perspective of a Lifetime on Atmospheric Modeling
By Anthony J. Sadar
The president vowed to make climate change a top priority in his second term, suggesting that a major assault on industry is coming if he is re-elected. So before the potential onslaught, some real-world perspective on climate change is essential.
First, note that the tool used to both develop future global climate scenarios and to panic the public on meteorological mayhem is atmospheric modeling.
Most of my nearly 35 years of professional life has been involved with atmospheric modeling in one way or another. I began my scientific career in meteorology in the late ‘70s. Back then, calculating air quality impacts of air pollution sources, such as smokestacks and vents, involved using a simple statistical calculator and some basic graphs derived from empirical studies—a rudimentary form of modeling.
Over the years, with more powerful computers and sophisticated graphics, air pollution meteorologists, like me, were able to analyze in more depth and with finer detail contaminant concentrations as they spread from their emission locations.
Today, air-quality models are coupled with some of the very same meteorological models used in climate studies. In this way, state-of-the-science estimates can be made to determine whether, for instance, a proposed industrial facility will contribute to unacceptable deterioration of air quality.
Air pollution models have long been used to evaluate just about any significant operation from the smallest chemical plant to the largest nuclear or coal-fired power plant. Furthermore, the models are useful in anticipating the consequences of mundane releases of contaminants to catastrophic outbursts from accidents or terrorist attacks that disperse gases or particles like chlorine dioxide or anthrax.
What I and so many other air modelers have discovered is that, as impressive as modeling has become, model results beyond the immediate downwind distance of the pollution source and within a relatively brief amount of time, are not very reliable, despite the awesome computing power available today. We know that dependence on their output is quite limited and to extrapolate too far beyond the bounds of the model assumptions is foolhardy.
Compare the experience of thousands of non-academic air modelers with the largely academic and government climate modelers. Their combined efforts have produced impressive results in scope and scale, yet, like air pollution modeling, their model outputs for long-term global climate conditions still boil down to limited guesses.
Regardless, a bit of understanding about the global atmosphere has been spun into a trillion-dollar bonanza by a colaition of supporters. These cheerleaders take the form of career politicians, bureaucrats, environmental and social activists, academics and educators, technologists and consultants, journalists, bloggers, and groupies of all stripes.
But realism and humility about the limitations of climate modeling must set in soon with enough scientists and those of the general public who care enough to pay attention. Let’s face it: if Mr. Obama gets his way in November, then more than our supposed climate future with be in dire straits.
Meteorologist Anthony J. Sadar is the author of In Global Warming We Trust: A Heretic’s Guide to Climate Science (Telescope Books: www.telescopebooks.com).