

By Brendan O’Neill, ABC Drum
What is it about freakishly cold winters that so agitates intolerant moralists?
In Europe 500 years ago, any sign of a dip in the winter weather would be greeted by much gnashing of teeth from the morality police. Sometimes they’d even burn at the stake “witches” who were said to have caused the extreme cold through their wicked behaviour and sorcery.
Fast-forward to the 21st century and still there’s nothing like a bitingly cold winter to drive moralists mad with priestly fury. Only today, in a more PC, less pyromaniacal version of what their forebears did, they don’t burn people at the stake for causing cold winters - no, they prefer to hector us with op-eds and insults instead.
The last couple of winters in western Europe have been bitterly cold. Last year the British Isles were coated in thick snow, causing chaos. This winter is shaping up to be a bit warmer, though cold snaps are expected in the new year.
All this iciness has put green-leaning moralists in a tailspin. They scour the press and the blogs for any whiff of a hint of a suggestion that perhaps these cold winters disprove the global-warming thesis, and inform us that, actually, extreme coldness is yet another side-effect of man’s constant farting of CO2 into the environment.
This week, a top Welsh scientist highlighted one of the key problems associated with very cold winters - no, not the possibility of elderly people going hypothermia or an increased risk of car accidents on slushy roads, but the danger that the dumb public will think all this snow proves hot-headed environmentalists wrong.
Professor Michael Hambrey of the University of Aberystwyth said “the public must not be misled into believing that a series of cold winters are evidence that climate change is a myth”.
Echoing green activists, who get strangely defensive during very cold winters, Professor Hambrey reminded us that climate change is not only going to make the world hellishly hotter but will also lead to a situation where “more extreme winters become the norm”.
Last year, during Britain’s big freeze, greens incessantly lectured us about how cold winters are just as much the fault of greedy, hubristic, polluting man as recent heatwaves and droughts have been.
A writer for The Times said anyone who seizes the opportunity of a wicked winter to ask “what happened to global warming?” is an “idiot”, because nobody ever claimed that climate change would “make Britain hotter in the long run”. (Er, yes they did.)
A headline in the Guardian informed us that: “The snow outside is what global warming looks like”, and the reason the plebs and simpletons who make up modern Britain can’t understand this fact is because they are:
“simple, earthy creatures, governed by the senses… What [they] see and taste and feel overrides analysis. The cold has reason in a deathly grip.”
Perhaps. Or perhaps the reason the public’s cynicism towards environmentalism goes up a notch whenever it snows is because for the past 10 years, before the recent big freezes set in, environmentalists told us we’d never see snow again.
“Snow is starting to disappear from our lives”, declared the Independent in March 2000, quoting an expert from the Climatic Research Unit at the University of East Anglia - a major producer of climate-change info - saying that “children just aren’t going to know what snow is”.
Mark Lynas, one of Britain’s chief climate-change alarmists, told us in 2004 to prepare for life on a “hotter planet” in which “the traditional British winter [is] probably gone for good”.
And yet today, any mortal who dares to wonder out loud why it’s snowing so much if the planet is supposed to be getting hotter is told to shut up, branded an “idiot”, pityingly looked upon as a “simple creature” lacking reason. Weird wintry weather is as manmade as hotness is, we’re told. In short, snow, like floods and droughts and plagues of locusts, is another by-product of our destructive behaviour.
These greens don’t seem to realise how much they sound like medieval witch-hunters. In the Dark Ages, before man enlightened himself, witches were frequently hunted and burned on the basis that they were causing climate change - specifically very cold winters.
One of the driving forces behind the witch-hunting mania in Europe between the 15th and 17th centuries was the idea that these peculiar creatures had warped the weather.
As the German historian Wolfgang Behringer argued in his 2004 book, Witches and Witch-Hunts, “large-scale persecutions were clearly linked to years of extreme hardship and in particular the type of misery related to extreme climatic events”.
So during the Little Ice Age, the period of unusual coldness that started around the mid-1500s, there was an upsurge in witch-hunting. There was another outburst in 1628, described by historians as “the year without a summer”, because once again people’s crops failed and they were desperate to find someone to blame. As Behringer puts it, when the “climate stayed unfavourable or ‘unnatural’ the demand for persecutions persisted”.
Johann Weyer, the 16th-century physicist who spoke out against witch-hunting, described how one woman was forced to confess to causing climate change:
“[A] poor old woman was driven by torture to confess - as she was about to be offered to Vulcan’s flames - that she had caused the incredible severity of the previous winter of 1565, and the extreme cold, and the lasting ice.”
Pointy-hatted Witchfinder Generals were convinced that foul, immoral people, through the magic of their thoughts and words, had conjured up climatic mayhem and icy conditions. Sound familiar? Yep - today, too, hectoring moralists hold wicked human beings responsible for causing unusual coldness.
In the old witch-hunting era, it was a powerful sense of social uncertainty and fear of the future which led the priestly class to view mysterious individuals as being culpable for climate change. Today, too, a similarly profound social and moral malaise has led elite greens to claim that the throng, with its reckless ways and insatiable material desires, is causing dangerously freezing/hot conditions.
Of course, in one important way today’s green moaners are more enlightened than the witch-hunters of old: they don’t hurl anyone on to “Vulcan’s flames”. But in another sense they’re more backward than the medieval moralists since they don’t only old a few sad old women responsible for climatic disarray, but rather point the finger of blame at everyone - all the “idiots” and “simple creatures” whose desire for stuff and wealth and holidays is apparently causing both cruel summers and harsh winters. In the eyes of the green lobby, we are all witches now.
By Anthony Watts
The post below on Dr. Roy Spencer’s blog that contains responses from Spencer and Christy deserves wide distribution and attention, because it shows just how badly Ben Santer and John Abraham want to squelch this dataset. Particularly amusing is the labeling of a graph in an Andrew Freedman article at WaPo as a listing of “corrections”, when in fact it is nothing more than the advance of the trend in step with the graph below (enlarged).
Addressing Criticisms of the UAH Temperature Dataset at 1/3 Century
by Roy W. Spencer, Ph. D.
The UAH satellite-based global temperature dataset has reached 1/3 of a century in length, a milestone we marked with a press release in the last week (e.g. covered here).
As a result of that press release, a Capital Weather Gang blog post by Andrew Freedman was dutifully dispatched as damage control, since we had inconveniently noted the continuing disagreement between climate models used to predict global warming and the satellite observations.
What follows is a response by John Christy, who has been producing these datasets with me for the last 20 years:
Many of you are aware that as a matter of preference I do not use the blogosphere to report information about climate or to correct the considerable amount of misinformation that appears out there related to our work. My general rule is never to get in a fight with someone who owns an obnoxious website, because you are simply a tool of the gatekeeper at that point.
However, I thought I would do so here because a number of folks have requested an explanation about a blog post connected to the Washington Post that appeared on 20 Dec. Unfortunately, some of the issues are complicated, so the comments here will probably not satisfy those who want the details and I don’t have time to address all of its errors.
Earlier this week we reported on the latest monthly global temperature update, as we do every month, which is distributed to dozens of news outlets. With 33 years of satellite data now in the hopper (essentially a third of a century) we decided to comment on the long-term character, noting that the overall temperature trend of the bulk troposphere is less than that of the IPCC AR4 climate model projections for the same period. This has been noted in several publications, and to us is not a new or unusual statement.
Suggesting that the actual climate is at odds with model projections does not sit well with those who desire that climate model output be granted high credibility. I was alerted to this blog post within which are, what I can only call, “myths” about the UAH lower tropospheric dataset and model simulations. I’m unfamiliar with the author (Andrew Freedman) but the piece was clearly designed to present a series of assertions about the UAH data and model evaluation, to which we were not asked to respond. Without such a knowledgeable response from the expert creators of the UAH dataset, the mythology of the post may be preserved.
The first issue I want to address deals the relationship between temperature trends of observations versus model output. I often see such posts refer to an old CCSP document (2006) which, as I’ve reported in congressional testimony, was not very accurate to begin with, but which has been superseded and contradicted by several more recent publications.
These publications specifically document the fact that bulk atmospheric temperatures in the climate system are warming at only 1/2 to 1/4 the rate of the IPCC AR4 model trends. Indeed actual upper air temperatures are warming the same or less than the observed surface temperatures (most obvious in the tropics) which is in clear and significant contradiction to model projections, which suggest warming should be amplified with altitude.
The blog post even indicates one of its quoted scientists, Ben Santer, agrees that the upper air is warming less than the surface - a result with which no model agrees. So, the model vs. observational issue was not presented accurately in the post. This has been addressed in the peer reviewed literature by us and others (Christy et al. 2007, 2010, 2011, McKitrick et al. 2010, Klotzbach et al. 2009, 2010.)
Then, some people find comfort in simply denigrating the uncooperative UAH data (about which there have been many validation studies.) We were the first to develop a microwave-based global temperature product. We have sought to produce the most accurate representation of the real world possible with these data - there is no premium in generating problematic data. When problems with various instruments or processes are discovered, we characterize, fix and publish the information. That adjustments are required through time is obvious as no one can predict when an instrument might run into problems, and the development of such a dataset from satellites was uncharted territory before we developed the first methods.
The Freedman blog post is completely wrong when it states that “when the problems are fixed, the trend always goes up.” Indeed, there have been a number of corrections that adjusted for spurious warming, leading to a reduction in the warming trend. That the scientists quoted in the post didn’t mention this says something about their bias.
The most significant of these problems we discovered in the late 1990’s in which the calibration of the radiometer was found to be influenced by the temperature of the instrument itself (due to variable solar shadowing effects on a drifting polar orbiting spacecraft.) Both positive and negative adjustments were listed in the CCSP report mentioned above.
We are always working to provide the best products, and we may soon have another adjustment to account for an apparent spurious warming in the last few years of the aging Aqua AMSU (see operational notes here). We know the data are not perfect (no data are), but we have documented the relatively small error bounds of the reported trends using internal and external evidence (Christy et al. 2011.)
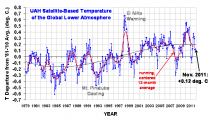
A further misunderstanding in the blog post is promoted by the embedded figure (below, with credit given to a John Abraham, no affiliation). The figure is not, as claimed in the caption, a listing of “corrections”:

The major result of this diagram is simply how the trend of the data, which started in 1979, changed as time progressed (with minor satellite adjustments included.) The largest effect one sees here is due to the spike in warming from the super El Nino of 1998 that tilted the trend to be much more positive after that date. (Note that the diamonds are incorrectly placed on the publication dates, rather than the date of the last year in the trend reported in the corresponding paper - so the diamonds should be shifted to the left by about a year. The 33 year trend through 2011 is +0.14C/decade.)
The notion in the blog post that surface temperature datasets are somehow robust and pristine is remarkable. I encourage readers to check out papers such as my examination of the Central California and East African temperature records. Here I show, by using 10 times as many stations utilized in the popular surface temperature datasets, that recent surface temperature trends are highly overstated in these regions (Christy et al. 2006; 2009). We also document how surface development disrupts the formation of the nocturnal boundary layer in many ways, leading to warming nighttime temperatures.
That’s enough for now. The Washington Post blogger, in my view, is writing as a convinced advocate, not as a curious scientist or impartial journalist. But, you already knew that.
In addition to the above, I (Roy) would like to address comments made by Ben Santer in the Washington Post blog:
A second misleading claim the (UAH) press release makes is that it’s simply not possible to identify the human contribution to global warming, despite the publication of studies that have done just that. “While many scientists believe it [warming] is almost entirely due to humans, that view cannot be proved scientifically,” Spencer states.
Ben Santer, a climate researcher at Lawrence Livermore National Laboratory in California, said Spencer and Christy are mistaken. “People who claim (like Roy Spencer did) that it is “impossible” to separate human from natural influences on climate are seriously misinformed,” he wrote via email. “They are ignoring several decades of relevant research and literature. They are embracing ignorance.” “Many dozens of scientific studies have identified a human “fingerprint” in observations of surface and lower tropospheric temperature change,” Santer stated.
In my opinion, the supposed “fingerprint” evidence of human-caused warming continues to be one of the great pseudo-scientific frauds of the global warming debate. There is no way to distinguish warming caused by increasing carbon dioxide from warming caused by a more humid atmosphere responding to (say) naturally warming oceans responding to a slight decrease in maritime cloud cover (see, for example, “Oceanic Influences on Recent continental Warming").
Many papers indeed have claimed to find a human “fingerprint”, but upon close examination the evidence is simply consistent with human caused warming - while conveniently neglecting to point out that the evidence would also be consistent with naturally caused warming. This disingenuous sleight-of-hand is just one more example of why the public is increasingly distrustful of the climate scientists they support with their tax dollars.
By George Russell, Fox News
The U.S. Environmental Protection Agency wants to change how it analyzes problems and makes decisions, in a way that would give it vastly expanded power to regulate businesses, communities and ecosystems in the name of “sustainable development,” the centerpiece of a global United Nations conference slated for Rio de Janeiro next June.
The major focus of the EPA thinking is a weighty study the agency commissioned last year from the National Academies of Science. Published in August, the study, entitled “Sustainability and the U.S. EPA,” cost nearly $700,000 and involved a team of a dozen outside experts and about half as many National Academies staff.
Its aim: how to integrate sustainability “as one of the key drivers within the regulatory responsibilities of EPA.” The panel who wrote the study declares part of its job to be “providing guidance to EPA on how it might implement its existing statutory authority to contribute more fully to a more sustainable-development trajectory for the United States.”
Or, in other words, how to use existing laws to new ends.
According to the Academies, the sustainability study “both incorporates and goes beyond an approach based on assessing and managing the risks posed by pollutants that has largely shaped environmental policy since the 1980s.”
It is already known in EPA circles as the “Green Book” and is frequently compared by insiders to the “Red Book,” a study on using risk management techniques to guide evaluation of carcinogenic chemicals that the agency touts as the basis of its overall approach to environmental issues for the past 30 years.
At the time that the “Green Book” study was commissioned, in August, 2010, EPA Administrator Lisa Jackson termed it “the next phase of environmental protection,” and asserted that it will be “fundamental to the future of the EPA.”
Jackson compared the new approach, it would articulate to “the difference between treating disease and pursuing wellness.” It was, she said, “a new opportunity to show how environmentally protective and sustainable we can be,” and would affect “every aspect” of EPA’s work.
According to the study itself, the adoption of the new “sustainability framework” will make the EPA more “anticipatory” in its approach to environmental issues, broaden its focus to include both social and economic as well as environmental “pillars,” and “strengthen EPA as an organization and a leader in the nation’s progress toward a sustainable future.”
Whatever EPA does with its suggestions, the study emphasizes, will be “discretionary.” But the study urges EPA to “create a new culture among all EPA employees,” and hire an array of new experts in order to bring the sustainability focus to every corner of the agency and its operations. Changes will move faster “as EPA’s intentions and goals in sustainability become clear to employees,” the study says.
The National Academies and the EPA held a meeting last week in Washington to begin public discussion of the study.
Even as it begins to go public, EPA, which has come under renewed fire for its recent rulings on new auto emissions standards and limits on coal-fueled power plant emissions, is being determinedly low-key about the study.
Initially questioned about the document by Fox News weeks ago, an EPA spokesman eventually declared that “we are currently reviewing the recommendations and have not yet made any decisions on implementation.” During the deliberations, he said, “the agency will seek a wide range of perspectives on the recommendations from the business community, non-governmental organizations, the scientific community, and others.”
The spokesman also said that EPA had “no current plans” for the so-called “Rio + 20” environmental summit next summer “that pertains to the Green Book’s recommendations.”
The U.N. summit meeting, however, is mentioned in the Green Book itself as an instance where “sustainability is gaining increasing recognition as a useful framework for addressing otherwise intractable problems. The framework can be applied at any scale of governance, in nearly any situation, and anywhere in the world.”
When it comes to applying the framework via EPA, the study says it is likely to happen only “over time.” The Red Book risk assessment approach now in use, it notes, “was not immediately adopted within EPA or elsewhere. It required several years for its general acceptance at EPA and its diffusion to state and local agencies.”
What is “sustainability” in the first place? That is a question the study ducks, noting that it is only advising EPA on how to bring it within the agency’s canon.
The experts take their definition from an Obama Administration executive order of October, 2009, entitled Federal Leadership in Environmental, Energy and Economic Performance. It defines sustainability in sweeping fashion as the ability “to create and maintain conditions, under which humans and nature can exist in productive harmony, that permit fulfilling the social, economic, and other requirements of present and future generations.”
The study specifically notes that “although addressing economic issues is not a core part of EPA’s mission, it is explicitly part of the definition of sustainability.”
The experience of the European Union is deemed “particularly relevant” to achieving the sustainability goal.
That European strategy involves a virtually all-encompassing regulatory vision. The study notes that its priorities include “climate change and clean energy; sustainable transport; sustainable consumption and production; conservation and management of natural resources; public health; social inclusion, demography, and migration; and global poverty and sustainable development challenges.”
In an American context, the study says sustainable development “raises questions that are not fully or directly addressed in U.S. law or policy.” Among them: “how to define and control unsustainable patterns of production and consumption and how to encourage the development of sustainable communities, biodiversity protection, clean energy, environmentally sustainable economic development, and climate change controls.”
The study notes that sustainable development is “broader than the sum of U.S. environmental and conservation laws.”
It adds that “a great deal more needs to be done to achieve sustainability in the United States.”
The experts say they found the legal authority for EPA to foster sustainable development without further congressional approval in the wording of the National Environmental Policy Act of 1969, or NEPA. The study says the law, the cornerstone of U.S. environmental policy, declared that the “continuing policy of the Federal Government” is to “create and maintain conditions, under which humans and nature can exist in productive harmony, that permit fulfilling the social, economic, and other requirements of present and future generations.”
(In fact, the study quotes selectively from that portion of NEPA. What that section of the Act says in full is that “it is the continuing policy of the Federal Government, in cooperation with State and local governments, and other concerned public and private organizations, to use all practicable means and measures, including financial and technical assistance, in a manner calculated to foster and promote the general welfare, to create and maintain conditions under which man and nature can exist in productive harmony, and fulfill the social, economic, and other requirements of present and future generations of Americans.)
What ends that tacit authority should be used for are far less clear, because the study asserts that they need to be made up and codified as EPA goes along.
“EPA needs to formally develop and specify its vision for sustainability,” the study says. “Vision, in the sense discussed here, is a future state that EPA is trying to reach or is trying to help the country or the world to reach.”
The study offers up new tools for EPA to do the job. As opposed to environmental impact assessment, the study encourages the use of “sustainability impact assessment” in the evaluation of the hundreds and thousands of projects that come under EPA scrutiny to see whether they are moving in the proper direction
“Environmental impact assessment tends to focus primarily on the projected environmental effects of a particular action and alternatives to that action,” the study says. Sustainability impact assessment examines “the probable effects of a particular project or proposal on the social, environmental, and economic pillars of sustainability” - a greatly expanded approach.
One outcome: “The culture change being proposed here will require EPA to conduct an expanding number of assessments.”
As a result, “The agency can become more anticipatory, making greater use of new science and of forecasting.”
The catch, the study recognizes, is that under the new approach the EPA becomes more involved than ever in predicting the future.
“Forecasting is unavoidable when dealing with sustainability, but our ability to do forecasting is limited,” the document says.
One forecast it is safe to make: the study shows whatever else the new sustainability mission does for EPA, it aims to be a much, much more important - and powerful- federal agency than it is, even now.