

https://townhall.com/columnists/stephenmoore/2018/12/18/follow-the-climate-change-money-n2537638
Tony Heller’s videos take on NASA and NOAA claims about runaway climate change and then the alarmist NCA nonsense.
---------
For three decades, global warming alarmists have harassed society with stories of gloom and doom as a result of the carbon dioxide emitted into the air by the burning of fossil fuel. They are exercising precisely what prominent writer H.L. Mencken described as “the whole point of practical politics is to keep the populace alarmed and hence clamorous to be led to safety by menacing it with an endless series of hobgoblins, all of them imaginary”.
In fact, the man-caused global warming or climate change panic may well be the best hobgoblin ever conceived. It has half the world clamoring to be led to safety from climate change without a shred of physical evidence. Every single statement issued to support these fearmongering claims presented in a new 1,500-page report from 13 separate agencies of the federal government by 300 Obama-appointed scientists, has no basis in physical measurements or observations.
What they do have are mathematical equations considered to be models of the Earth’s climate. However, they have only a handful of the hundreds of variables that impact climate and the numbers inserted for the arbitrarily selected variables are little more than guesses. Unfortunately, the U.S. government has financed more than one hundred efforts to model our climate for the better part of three decades, with none coming close to actual results.
The problem real scientists who study climate—not those paid for bias—face, is that the public has no clue what a mathematical model actually is, how it works, and what they can and cannot do. Let’s simplify the subject and enlighten all Americans, and the rest of the world’s population as well.
There are many ways in which things or systems can be described. Before we build buildings or airplanes, we make physical small-scale models and test them against the stress and performances that will be required of them when they are actually built. When dealing with systems that are totally beyond our control we try and describe them with computer programs or mathematical equations that we hope may give answers to the questions we have about the system today and in the future. Historically, mathematical descriptions of such systems were used to better understand how the system might work. We would attempt to understand the variables that affect the outcomes of the system. Then we would alter the variables and see how the outcomes are altered. This is called sensitivity testing, the very best use of mathematical models.
Throughout our history, we were never foolish enough to make economic decisions based on predictions calculated from equations we think might dictate how nature works. My first introduction to using math to try and understand nature occurred almost 60 years ago when I was performing graduate work on contaminated fluid transport in subsurface rocks. It was fun and instructive but was never intended to serve as a crystal ball for the future. However, that is exactly what the well-paid math modelers throughout the academic world now claim they can do.
All problems can be viewed as having three stages, observation, modeling, and prediction. Perhaps the most active area for mathematical modeling is the economy and the stock market. No one has ever succeeded in getting it right and there are far fewer variables than occur in determining the climate of our planet.
For many years, the Wall Street Journal selected five eminent economic analysts to select a stock they were sure would rise in the following month. Then, they had chimpanzees throw five darts at a wall covered with that days’ stock-market results. A month later they determined who did better choosing winners, the analysts or the chimpanzees. In a majority of years, the chimps won.
I am not saying that today’s mathematical modelers would not beat chimps throwing darts at future Earth temperatures, but I will not object if you reach that conclusion. Their predictions for the past 20 years could just as well have been reached with darts because they have all been wrong.
Consider the following: we do not know all the variables but we are quite sure they are likely in the hundreds. We know how very few work. Clouds must play a significant role in the planet’s climate and we do not even know how they work. Yet today’s modelers believe they can tell you the planet’s climate decades or even a century in the future and want to manage the economy accordingly. Either they are crazy to think this or we are crazy to believe them. I suspect both to be true.
Dr. Willie Soon of the Harvard-Smithsonian astrophysics laboratory once calculated that if we could know all the variables affecting climate and plugged them into the world’s largest computer, it would take 40 years to reach a conclusive answer.
Should we waste a single brain cell even considering the doomsday predictions that 300 scientists working in 13 government agencies all hired by President Obama are telling us we must all plan for? The answer is obviously no. And we should all go back to preparing for a wonderful winter holiday.
Jay Lehr (jlehr@heartland.org) is science director at The Heartland Institute.
See Jay at the NYC Council on the real truth on sea level:
The late Dr. Bob Carter goes after the UN IPCC here.
Alarmist Claim Rebuttal Overview
Below are a series of rebuttals of the most common climate alarmists’ claims such as those made in the recently released Fourth National Climate Assessment Report. The authors of these rebuttals are all recognized experts in the relevant scientific fields. The rebuttals demonstrate the falsity of EPA’s claims merely by citing the most credible empirical data on the topic.
For each alarmist claim, a summary of the relevant rebuttal is provided below along with a link to the full text of the rebuttal, which includes the names and the credentials of the authors of each rebuttal.
Claim: Heat Waves are increasing at an alarming rate and heat kills.
Summary of Rebuttal
There has been no detectable long-term increase in heat waves in the United States or elsewhere in the world. Most all-time record highs here in the U.S. happened many years ago, long before mankind was using much fossil fuel. Thirty-eight states set their all-time record highs before 1960 (23 in the 1930s!). Here in the United States, the number of 100F, 95F and 90F days per year has been steadily declining since the 1930s. The Environmental Protection Agency Heat Wave Index confirms the 1930s as the hottest decade.
James Hansen while at NASA in 1999 said about the U.S. temperature record “In the U.S. the warmest decade was the 1930s and the warmest year was 1934”.
When NASA was challenged on the declining heat records in the U.S, the reply was that the U.S. is just 2% of the world. However, all the continents recorded their all-time record highs before 1980.
Interestingly while the media gives a great deal of coverage to even minor heat waves to support the case that man-made global warming is occurring, the media tends to ignore deadly cold waves. But in actual fact, worldwide cold kills 20 times as many people as heat. This is documented in the “Excess Winter Mortality” which shows that the number of deaths in the 4 coldest winter months is much higher than the other 8 months of the year. The USA death rate in January and February is more than 1000 deaths per day greater than in it is July and August.
Clearly, there is no problem with increased heat waves due to Climate Change.
Detailed Rebuttal and Authors: AC Rebuttal Heat Waves
--------------
Claim: Global warming is causing more hurricanes and stronger hurricanes.
Summary of Rebuttal
The long-term linear trend in the number and intensity of global hurricane activity has remained flat. Hurricane activity does vary year-to-year and over longer periods as short-term ocean cycles like El Nino/La Nina and multidecadal cycles in the Pacific (PDO) and Atlantic (AMO) ocean temperature regimes favor changes in activity levels and some basins over others.
Credible data show this is true despite much better open ocean detection than before the 1960s when many short-lived storms at sea would have been missed as there were no satellites, no aircraft reconnaissance, no radar, no buoys and no automated weather stations.
Landfall counts are more reliable. This data shows that the number of U.S. landfalling hurricanes and major hurricanes has been on the decline since the late 1800s.
However, the impacts on the United States has varied considerably with time, with very active seasons giving way to long lulls during which the public forgets the lessons from past storms and the risks of settling in vulnerable areas. The regions targeted vary too. The period from 1926 to 1935 was very active in the Gulf area. After decades of no impact storms, there were 8 major devastating storms on the east coast from 1938 to 1960 then a 25-year lull until Gloria and then Hugo began another active era.
This century Isabel in 2003, Charley, Frances, Ivan and Jeanne in 2004 and Dennis, Katrina, Rita and Wilma in 2005 all made landfall on the mainland. 2005 holds the record for 5 category 4 and 4 category 5 impact storms. At the time, some speculated this was the new norm for the Atlantic due to climate change. However, after the active 2005 season and before the landfall of two major storms on the U.S. in 2017, the U.S. had gone 4324 days (just short of 12 years) without a major hurricane landfall, exceeding the prior record 8-year lull in the 1860s.
Harvey in 2017 was the first hurricane to make landfall in Texas since Ike in 2008 and the first Category 4 hurricane in Texas since Hurricane Carla in 1961. Note that there has been no increase in Texas in either hurricanes or major hurricanes. In 2017, Irma was the first landfalling hurricane and major hurricane in Florida since Wilma in 2005. This was also after a record lull - 4439 days. The previous record lull back to 1851 was 2191 days from 1979 to 1985.
Michael whose tight core winds did major damage on a portion of the Florida panhandle in 2018 had the 20th lowest pressure for an Atlantic storm and was third lowest for a storm making landfall behind the Labor Day Hurricane in 1935 and Hurricane Camille in 1969.
In short, there is nothing unique or unprecedented about recent hurricane seasons or hurricanes. Active Atlantic seasons like 2004 and 2005 and 2017 were similar to 1893, 1926, 1933, 1950 and 1995. 1893 had 5 major hurricanes two of which both caused over 2000 deaths making that year the deadliest on record at that time. 7 years later in 1900, the Great Galveston hurricane killed up to 12,000, making it the most deadly in U.S. history.
Strong hurricanes like Maria in 2017 with devastation on the Caribbean islands are not unique. The Great Hurricane of 1780 killed 27,500 while ravaging the Caribbean islands with winds estimated over 200 mph. It was one of three hurricanes that year with death tolls over 1000.
The heavy rains associated with slow moving Harvey and Florence led to claims that slow movement was related to climate change. Careful analysis of the data shows a flat linear trend in storm motion over land for over the last half century.
The most recent (2018) U.S. Government analysis of the 36 most costly hurricane disasters in U.S. history, showed that increasing damages are due to increasing population density and infrastructure vulnerability, not due to storm intensity.
Chris Landsea (NOAA) in 2011 noted “instead of a dramatically increasing trend of hurricane damages, destruction from these storms varies on a decade-to-decade timescale with more damages in the early 1900s, low damages during the late 1900s to early 1920s, much higher destruction in late 1920s to the early 1960s, and reduced damages from the late 1960s to early 1990s. Certainly, the U.S. hurricane damages from 1996 to 2005 were quite high, but now it is evident that these were quite similar to the decade of 1926 to 1935. So, after straightforward consideration of the non-meteorological factors of inflation, wealth increases, and population change, there remains no indication that there has been a long-term pick up of U.S. hurricane losses that could be related to global warming today. There have been no peer-reviewed studies published anywhere that refute this.”
Detailed Rebuttal and Authors: AC Rebuttal Hurricanes
------------
Claim: Global warming is causing more and stronger tornadoes.
Summary of Rebuttal
Tornadoes are failing to follow “global warming” predictions. Strong tornadoes have seen a decline in frequency since the 1950s. The years 2012, 2013, 2014, 2015 and 2016 all saw below average to near record low tornado counts in the U.S. since records began in 1954. 2017 rebounded only to the long-term mean. 2018 as of the end of May is ranking below the 25th percentile.
This lull followed a very active and deadly strong La Nina of 2010/11, which like the strong La Nina of 1973/74 produced record setting and very deadly outbreaks of tornadoes. Population growth and expansion outside urban areas have exposed more people to the tornadoes that once roamed through open fields.
Tornado detection has improved with the addition of NEXRAD, the growth of the trained spotter networks, storm chasers armed with cellular data and imagery and the proliferation of cell phone cameras and social media. This shows up most in the weak EF0 tornado count but for storms from moderate EF1 to strong EF 3+ intensity, the trend slope has been flat to down despite improved detection.
Detailed Rebuttal and Authors: AC Rebuttal Tornadoes
-------------
Claim: Global warming is increasing the magnitude and frequency of droughts and floods.
Summary of Rebuttal
Our use of fossil fuels to power our civilization is not causing droughts or floods. NOAA found there is no evidence that floods and droughts are increasing because of climate change. The number, extend or severity of these events does increase dramatically for a brief period of years at some locations from time to time but then conditions return to more normal. This is simply the long-established constant variation of weather resulting from a confluence of natural factors.
In testimony before Congress Professor Roger Pielke, Jr. said: “It is misleading, and just plain incorrect, to claim that disasters associated with hurricanes, tornadoes, floods, or droughts have increased on climate timescales either in the United States or globally. Droughts have, for the most part, become shorter, less frequent, and cover a smaller portion of the U.S. over the last century.”
“The good news is U.S. flood damage is sharply down over 70 years,” Roger Pielke Jr. said. “Remember, disasters can happen any time...”. “But it is also good to understand long-term trends based on data, not hype.”
Detailed Rebuttal and Authors: AC Rebuttal Droughts and Floods
----------
Claim: Global Warming has increased U.S. Wildfires.
Summary of Rebuttal
Wildfires are in the news almost every late summer and fall. The National Interagency Fire Center has recorded the number of fires and acreage affected since 1985. This data show the number of fires trending down slightly, though the acreage burned had increased before leveling off over the last 20 years. The NWS tracks the number of days where conditions are conducive to wildfires when they issue red-flag warnings. It is little changed.
Weather and normal seasonal and year-to-year variations brings a varying number and extent of wildfires to the west every year and other areas from time to time. The 2016/17 winter was a very wet one in the mountains in the west, in parts of the northern Sierra, the wettest/snowiest on record). Wet winters cause more spring growth that will dry up in the dry summer heat season and become tinder for late summer and early fall fires before the seasonal rains return.
2017 was an active fire year in the U.S. but by no means a record. The U.S. had 64,610 fires, the 7th most in 11 years and the most since 2012. The 9,574, 533 acres burned was the 4th most in 11 years and most since 2015. The fires burned in the Northwest including Montana with a very dry summer then the action shifted south seasonally with the seasonal start of the wind events like Diablo in northern California and Santa Ana to the south.
Fires spread to northern California in October with an episode of the dry Diablo wind that blows from the east and then in December as strong and persistent Santa Ana winds and dry air triggered a round of large fires in Ventura County.
According to the California Department of Forestry and Fire Protection, the 2017 California wildfire season was the most destructive one on record with a total of 8,987 fires that burned 1,241,158 acres. It included five of the 20 most destructive wildland-urban interface fires in the state’s history.
When it comes to considering the number of deaths and structures destroyed, the seven-fold increase in population in California from 1930 to 2017 must be noted. Not only does this increase in population mean more people and home structures in the path of fires, but it also means more fires. Lightning and campfires caused most historic fires; today most are the result of power lines igniting trees. The power lines have increased proportionately with the population, so it can be reasoned that most of the damage from wild fires in California is a result of increased population not Global Warming. The increased danger is also greatly aggravated by poor government forest management choices. The explosive failure of power lines and other electrical equipment has regularly ranked among the top three singular sources of California wildfires for the last several years. In 2015, the last year of reported data, electrical power problems sparked the burning of 149,241 acres - more than twice the amount from any other cause.
Detailed Rebuttal and Authors: AC Rebuttal Wildfires
------------
Claim: Global warming is causing snow to disappear.
Summary of Rebuttal
This is one claim that has been repeated for decades even as nature showed very much the opposite trend with unprecedented snows even in the big coastal cities. Every time they repeated the claim, it seems nature upped the ante more.
Alarmists have eventually evolved to crediting warming with producing greater snowfall, because of increased moisture but the snow events in recent years have usually occurred in colder winters with high snow water equivalent ratios in frigid arctic air.
The eastern United States as an example has had 29 high impact winter snowstorms in the last 10 years. No prior ten-year period had more than 10.
Snowcover in the Northern Hemisphere, North America and Eurasia has been increasing since the 1960s in the fall and winter but declining in the spring and summer. However, as NOAA advised might be the case, snowcover measurement methodology changes at the turn of this century may be responsible for part of the warm season differences.
Detailed Rebuttal and Authors: AC Rebuttal Snow
-----------
Claim: Global warming is resulting in rising sea levels as seen in both tide gauge and satellite technology.
Summary of Rebuttal
This claim is demonstrably false. It really hinges on this statement: “Tide gauges and satellites agree with the model projections.” The models project a rapid acceleration of sea level rise over the next 30 to 70 years. However, while the models may project acceleration, the tide gauges clearly do not.
All data from tide gauges in areas where land is not rising or sinking show instead a steady linear and unchanging sea level rate of rise from 4 up to 6 inches/century, with variations due to gravitational factors. It is true that where the land is sinking as it is in the Tidewater area of Virginia and the Mississippi Delta region, sea levels will appear to rise faster but no changes in CO2 emissions would change that.
The implication that measured, validated, and verified Tide Gauge data support this conclusion remains simply false. All such references rely on “semi-empirical” information, which merges, concatenates, combines, and joins, actual tide gauge data with various models of the reference author’s choosing. Nowhere on this planet can a tide gauge be found, that shows even half of the claimed 3.3 mm/yr sea level rise rate in “Tectonically Inert” coastal zones. These are areas that lie between regions of geological uplift and subsidence. They are essentially neutral with respect to vertical land motion, and tide gauges located therein show between 1 mm/yr (3.9 inches/century) and 1.5 mm/yr (6 inches/century rise). The great Swedish Oceanographer, Nils-Axel Morner, has commented on this extensively, and his latest papers confirm this ‘inconvenient truth’.
Furthermore, alarmist claims that “Satellites agree with the model projection” are false. Satellite technology was introduced to provide more objective measurement of the sea level rise because properly adjusted tide gauge data was not fitting Alarmists’ claims. However, the new satellite and radar altimeter data lacked the resolution to accurately measure sea levels down to the mm level. Moreover, the raw data from this technology also conflicted with Alarmists’ claims. As a result, adjustments to this data were also made - most notably a Glacial Isostatic Adjustment (GIA). GIA assumes that basically all land is rebounding from long ago glaciations and oceanic basins are deepening. The assumption is that this rebounding is masking the true sea level rise. Alarmists continue to proclaim that their models project a rapid acceleration of sea level rise over the next 30 to 70 years, when those same models have failed to even come close to accurately predicting the past 25 years.
Detailed Rebuttal and Authors: AC Rebuttal - Sea Level
------------
Claim: Arctic, Antarctic and Greenland ice loss is accelerating due to global warming.
Summary of Rebuttal
Satellite and surface temperature records and sea surface temperatures show that both the East Antarctic Ice Sheet and the West Antarctic Ice Sheet are cooling, not warming and glacial ice is increasing, not melting. Satellite and surface temperature measurements of the southern polar area show no warming over the past 37 years. Growth of the Antarctic ice sheets means sea level rise is not being caused by melting of polar ice and, in fact, is slightly lowering the rate of rise. Satellite Antarctic temperature records show 0.02C/decade cooling since 1979. The Southern Ocean around Antarctica has been getting sharply colder since 2006. Antarctic sea ice is increasing, reaching all-time highs. Surface temperatures at 13 stations show the Antarctic Peninsula has been sharply cooling since 2000.
The Arctic includes the Arctic Ocean, Greenland, Iceland, and part of Siberia and northern Alaska. Because of the absence of any land mass in the Arctic Ocean, most of area lacks glaciers, which require a land mass. Thus, most of the Arctic contains only floating sea ice. Greenland, Iceland, northern Alaska, and northern Siberia contain the only glaciers in the general Arctic region.
Because of the absence of any land mass in the Arctic Ocean, most of the Arctic contains only floating sea ice. Because the arctic ice is floating, it is subject to intrusians of warmer water under the ice during the natural multidecadal warm cycles especially from the North Atlantic, which thins the ice and reduces the ice extent in summer with its accompanying warmer air temperatures. Increased ice and colder temperatures are observed during cold water ocean cycles.
Arctic temperature records show that the 1920s and 1930s were warmer than 2000. Official historical fluctuations of Arctic sea ice begin with the first satellite images in 1979. That happens to coincide with the end of the recent 1945-1977 global cold period and the resulting maximum extent of Arctic sea ice. During the warm period from 1978 until recently, the extent of sea ice has diminished, but increased in the past several years. The Greenland ice sheet has also grown recently.
Detailed Rebuttal and Authors: AC Rebuttal Arctic, Antarctic and Greenland
-------------
Claim: Rising atmospheric CO2 concentrations are causing ocean acidification, which is catastrophically harming marine life.
Summary of Rebuttal
As the air’s CO2 content rises in response to ever-increasing anthropogenic CO2 emissions, more and more carbon dioxide is expected to dissolve into the surface waters of the world’s oceans, which dissolution is projected to cause a 0.3 to 0.7 pH unit decline in the planet’s oceanic waters by the year 2300. A potential pH reduction of this magnitude has provoked concern and led to predictions that, if it occurs, marine life will be severely harmed - with some species potentially driven to extinction - as they experience negative impacts in growth, development, fertility and survival.
This ocean acidification hypothesis, as it has come to be known, has gained great momentum in recent years, because it offers a second independent reason to regulate fossil fuel emissions in addition to that provided by concerns over traditional global warming. For even if the climate models are proven to be wrong with respect to their predictions of atmospheric warming, extreme weather, glacial melt, sea level rise, or any other attendant catastrophe, those who seek to regulate and reduce CO2 emissions have a fall-back position, claiming that no matter what happens to the climate, the nations of the Earth must reduce their greenhouse gas emissions because of projected direct negative impacts on marine organisms via ocean acidification.
The ocean chemistry aspect of the ocean acidification hypothesis is rather straightforward, but it is not as solid as it is often claimed to be. For one thing, the work of a number of respected scientists suggests that the drop in oceanic pH will not be nearly as great as the IPCC and others predict. And, as with all phenomena involving living organisms, the introduction of life into the analysis greatly complicates things. When a number of interrelated biological phenomena are considered, it becomes much more difficult, if not impossible, to draw such sweeping negative conclusions about the reaction of marine organisms to ocean acidification. Quite to the contrary, when life is considered, ocean acidification is often found to be a non-problem, or even a benefit. And in this regard, numerous scientific studies have demonstrated the robustness of multiple marine plant and animal species to ocean acidification - when they are properly performed under realistic experimental conditions.
Detailed Rebuttal and Author: AC Rebuttal - Ocean Acidification
------------
Claim: Carbon pollution is a health hazard.
Summary of Rebuttal
The term “carbon pollution” is a deliberate, ambiguous, disingenuous term, designed to mislead people into thinking carbon dioxide is pollution. It is used by the environmentalists to confuse the environmental impacts of CO2 emissions with the impact of the emissions of unwanted waste products of combustion. The burning of carbon-based fuels (fossil fuels - coal, oil, natural gas - and biofuels and biomass) converts the carbon in the fuels to carbon dioxide (CO2), which is an odorless invisible gas that is plant food and it is essential to life on the planet.
Because the burning of the fuel is never 100% efficient, trace amounts of pollutants including unburnt carbon are produced in the form of fine particulates (soot), hydrocarbon gases and carbon monoxide. In addition, trace amounts of sulfur oxides, nitrogen oxides and other pollutant constituents can be produced. In the US, all mobile and industrial stationary combustion sources must have emission control systems that remove the particulates and gaseous pollutants so that the emissions are in compliance with EPA’s emission standards. The ambient air pollutant concentrations have been decreasing for decades and are going to keep decreasing for the foreseeable future because of existing non-GHG-related regulations.
Detailed Rebuttal and Authors: AC Rebuttal Health
-------------
Conclusion
The well-documented invalidation of the “three lines of evidence” upon which EPA attributes global warming to human -caused CO2 emissions breaks the causal link between such CO2 emissions and global warming. {See here and here}
This in turn necessarily breaks the causal chain between CO2 emissions and the alleged knock-on effects of global warming, such as loss of Arctic ice, increased sea level, and increased heat waves, floods, droughts, hurricanes, tornadoes, etc. These alleged downstream effects are constantly cited to whip up alarm and create demands for ever tighter CO2 regulation. EPA explicitly relied on predicted increases in such events to justify the Endangerment Finding supporting its Clean Power Plan. But as shown above, there is no evidence to support such claims, and copious empirical evidence that refutes them.
The enormous cost and essentially limitless scope of the government’s regulatory authority over GHG/CO2 emissions cannot lawfully rest upon a collection of scary stories that are conclusively disproven by readily available empirical data.
The legal criteria for reconsidering the Endangerment Finding are clearly present in this case. The scientific foundation of the Endangerment Finding has been invalidated. The parade of horrible calamities that the Endangerment Finding predicts and that a vast program of regulation seeks to prevent have been comprehensively and conclusively refuted by empirical data. The Petition for Reconsideration should be granted.
By Roger Bezdek and Paul Driessen Sunday, December 2, 2018
If you like power when it’s available, instead of when you need it; having your lights, heat, computer and TV go off and on 30 times a day; and paying 78 cents a kilowatt-hour, instead of 9 cents - you’ll love Dominion (Virginia) Energy’s plan to install two Washington Monument-sized wind turbines off the Norfolk coast.
Virginia lawmakers recently approved an offshore wind project - with no competitive bidding and an estimated cost of $300 million. Virginians will pay 25 times the U.S. market price for the turbines - and then pay 78 cents/kilowatt-hour for their intermittent electricity. That’s 26 times the 3 cents per kWh wholesale price for coal, gas, hydroelectric or nuclear electricity in the Commonwealth.
State utility regulators blasted the decision. The legislature nevertheless enacted it at the behest of Gov. Ralph Northam, to demonstrate his commitment to “fighting climate change.” After the two “demonstration” turbines run awhile, they could be joined by hundreds more.
That forest of turbines would impact surface and submarine ship traffic, and constant vibration noises will impair marine mammals’ sonar navigation systems.
But when green preening and climate virtue-signaling is the objective, not even the Republican Virginia Legislature will be shackled by energy, environmental or economic reality. Here are some relevant facts. Consumers demand and require reliable, affordable electricity 24/7/365. Weather dependent, intermittent wind power requires 100 percent backup by coal or gas power plants that are running all the time on “spinning reserve,” ready to step in every time the wind dies down. That means extra costs, materials and fuels for the backup units.
Wind power often fails when electricity is most urgently required. Industrial wind promoters claim turbines generate electricity about a third of the time: a 33 percent “nameplate capacity factor.” Energy experts put actual output at 20 percent to 30 percent or even lower, depending on locations.
During the July 2006 California heat wave, turbines generated only 5 percent of nameplate capacity. In Texas, wind capacity factors are generally below 9 percent and Lone Star State non-coastal turbines have an historical capacity factor of 12 percent during torrid summer months, and often a third of that.
Wind generation was virtually non-existent in the Pacific Northwest in January 2009. Amid a 2012 heat wave, northern Illinois electricity demand averaged 22,000 megawatts, but turbines generated a miserly 4 MW. Similar realities prevail across the United States and world.
The problem worsens as turbines age. One British study found that onshore wind electricity output declines by 16 percent per decade of operation. It’s worse offshore, because of storms and salt spray.
Offshore wind is also very expensive. The first U.S. offshore wind farm went online off Rhode Island in 2017 - at $150,000 per household powered. The newest U.S. nuclear reactor cost $4.7 billion but powers 4.5 million homes - at $1,040 per household.
Rhode Island offshore wind electricity costs 24.4 cents/kWh today. Under its contractual price escalator of 3.5 percent a year, in 20 years Rhode Island consumers will be paying twice that.
Decommissioning (removing) wind turbines is enormously difficult and hugely expensive. Natural gas plants have 30-40 year lifetimes; nuclear plants can operate for 60 years or more. Wind turbines last 15-20 years, and often far less for offshore leviathans. Off Virginia, salt corrosion is compounded by 50-80 foot storm waves and category 1-3 hurricanes.
Maintenance and removal require huge derrick barges and can be done only during near-perfect weather, with minimal wave height. Actual removal costs depend on the size and type of project, distance from shore, whether monopolies and electrical cables must be fully removed, and whether the seabed must be returned to its original condition.
Virginia’s turbines will be 27 miles from the coast. The cost of removing any industrial-scale “wind farm” could run into the billions, and could double the cost of wind power.
Oil, mining, logging, construction and other projects are typically required to post sizable bonds, before they are permitted to operate. Wind turbine projects are generally exempt. That means billion-dollar decommissioning costs will likely bring corporate insolvency - and state taxpayers and ratepayers will get stuck with the bills.
Demolition has begun for one of Europe’s earliest offshore wind projects, off Denmark. The blades, nacelle and tower must be dismantled and individually removed by big mobile cranes on enormous barges. The concrete foundations must be dismantled on-site by hydraulic demolition shears, then hauled ashore.
By 2023 more than 10,000 of Germany’s 28,000 wind turbines must be decommissioned. Their concrete and rebar bases can be 100 feet in the ground. Rotor blades are fiberglass, carbon fibers and petroleum resins; burning them releases dust and toxic gases, and thus is prohibited. Nor can they be recycled. The same facts apply to U.S. turbines.
Imagine putting 115-foot turbine blades in landfills - or 245-foot blades from the new monster turbines. One study estimates that it will cost $565,000 per megawatt to decommission Europe’s offshore turbines - or about $3.4 million for each new generation 6-MW turbine.
From an economic, environmental or energy perspective, this is simply unsustainable. And it’s all being justified by climate change hyperbole and hysteria.
Gov. Northam and legislators who supported this fiasco should be prosecuted for energy and climate fraud - or at least forced to run their homes and offices in perpetuity on intermittent, ultra-expensive electricity from wind turbines.
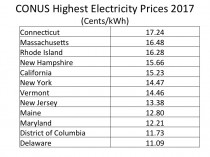
ICECAP NOTE: Virginia also plans to join RGGI - the northeast state fiasco that has the states paying the highest electricity rates in the lower 48 states. This hurts those who can least afford it the most.

Roger Bezdek is president of Management Information Services Inc. Paul Driessen is senior policy analyst for the Committee For A Constructive Tomorrow.