

Important updates: See Anthony Watts and Lubos Motl respond using comments from Muller BEST co-author Judith Curry. Muller had so many people attack his findings and premature release of incomplete data before peer review that he has his own page on Climate Depot.
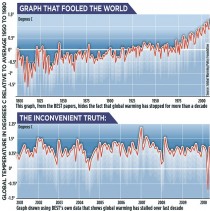
See enlarged of Best confirmation that global warming stopped.
by Willis Eschenbach, WUWT
My theory is that the BEST folks must have eaten at a Hollywood Chinese restaurant. You can tell because when you eat there, an hour later you find you’re hungry for stardom.
Now that the BEST folks have demanded and received their fifteen minutes of fame before their results have gone through peer review, now that they have succeeded in deceiving many people into thinking that Muller is a skeptic and that somehow BEST has ‘proven the skeptics wrong’, now that they’ve returned to the wilds of their natural scientific habitat far from the reach of National Geographic photographers and people asking real questions, I thought I might take a look at the data itself. Media whores are always predictable and boring, but data always contains surprises. It can be downloaded from the bottom of this page, but please note that they do not show the actual results on that page, they show smoothed results. Here’s their actual un-smoothed monthly data:
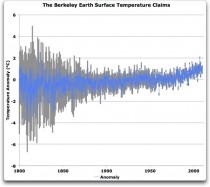
Figure 1. BEST global surface temperature estimates. Gray bars show what BEST says are the 95% confidence intervals (95%CI) for each datapoint (enlarged).
I don’t know about you, but Figure 1 immediately made me think of the repeated claim by Michael Mann that the temperatures of the 1990s were the warmest in a thousand years.
WHAT I FIND IN THE BEST DATA
Uncertainty
I agree with William Briggs and Doug Keenan that “the uncertainty bands are too narrow”. Please read the two authors to see why.
I thought of Mann’s claim because, even with BEST’s narrow uncertainty figures, their results show we know very little about relative temperatures over the last two centuries. For example, we certainly cannot say that the current temperatures are greater than anything before about 1945. The uncertainty bands overlap, and so we simply don’t know if e.g. 2010 was warmer than 1910. Seems likely, to be sure...but we do not have the evidence to back that up.
And that, of course, means that Mann’s claims of ‘warmest in a mill-yun years’ or whatever he has ramped it up to by now are not sustainable. We can’t tell, using actual thermometer records, if we’re warmer than a mere century ago. How can a few trees and clamshells tell us more than dozens of thermometers?
Disagreement with satellite observations
The BEST folks say that there is no urban heat island (UHI) effect detectable in their analysis. Their actual claim is that “urban warming does not unduly bias estimates of recent global temperature change”. Here’s a comment from NASA, which indicates that, well, there might be a bias. Emphasis mine.
The compact city of Providence, R.I., for example, has surface temperatures that are about 12.2 C (21.9 F) warmer than the surrounding countryside, while similarly-sized but spread-out Buffalo, N.Y., produces a heat island of only about 7.2 C (12.9 F), according to satellite data. SOURCE
A 22F (12C) UHI warming in Providence, and BEST says no UHI effect...and that’s just a couple cities.
If there were no UHI, then (per the generally accepted theories) the atmosphere should be warming more than the ground. If there is UHI, on the other hand, the ground station records would have an upwards bias and might even indicate more warming than the atmosphere.
After a number of adjustments, the two satellite records, from RSS and UAH, are pretty similar. Figure 2 shows their records for global land-only lower tropospheric temperatures:
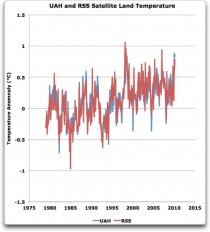
Figure 2. UAH and RSS satellite temperature records. Anomaly period 1979-1984 = 0 (enlarged).
Since they are so close, I have averaged them together in Figure 3 to avoid disputes. You can substitute either one if you wish. Figure three shows a three-year centered Gaussian average of the data. The final 1.5 years are truncated to avoid end effects.
Remember what we would expect to find if all of the ground records were correct. They’d all lie on or near the same line, and the satellite temperatures would be rising faster than the ground temperatures. Here are the actual results, showing BEST, satellite, GISS, CRUTEM, and GHCN land temperatures:
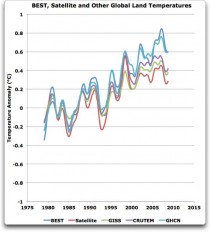
Figure 3. BEST, average satellite, and other estimates of the global land temperature over the satellite era. Anomaly period 1979-1984 = 0 (enlarged).
In Figure 3, we find the opposite of what we expected. The land temperatures are rising faster than the atmospheric temperatures, contrary to theory. In addition, the BEST data is the worst of the lot in this regard.
Disagreement with other ground-based records.
The disagreement between the four ground-based results also begs for an explanation. Note that the records diverge at the rate of about 0.2C in thirty years, which is 0.7 per century. Since this is the approximate amount of the last century’s warming, this is by no means a trivial difference.
My conclusion? We still have not resolved the UHI issue, in any of the land datasets. I’m happy to discuss other alternative explanations for what we find in Figure 3. I just can’t think of too many. With the ground records, nobody has looked at the other guys’ analysis and algorithms harshly, aggressively, and critically. They’ve all taken their own paths, and they haven’t disputed much with each other. The satellite data algorithms, on the other hand, has been examined minutely by two very competitive groups, UAH and RSS, in a strongly adversarial scientific manner. As is common in science, the two groups have each found errors in the other’s work, and when corrected the two records agree quite well. It’s possible they’re both wrong, but that doesn’t seem likely. If the ground-based folks did that, we might get better agreement. But as with the climate models and modelers, they’re all far too well-mannered to critically examine each other’s work in any serious fashion. Because heck, if they did that to the other guy, he might return the favor and point out flaws in their work, don’t want that kind of ugliness to intrude on their genteel, collegiate relationship, can’t we just be friends and not look too deeply"…
w.
PS - I remind folks again that the hype about BEST showing skeptics are wrong is just that. Most folks knew already that the world has been generally warming for hundreds of years, and BEST’s results in that regard were no surprise. BEST showed nothing about whether humans are affecting the climate, nor could it have done so. There are still large unresolved issues in the land temperature record which BEST has not clarified or solved. The jury is out on the BEST results, and it is only in part because they haven’t even gone through peer review.
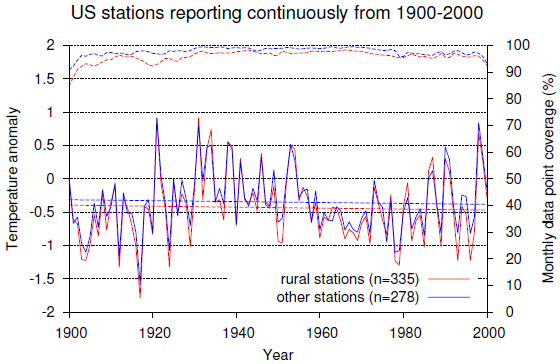
Addendum: Palmer’s stations that reported continuously since 1900

By: Marc Morano 10/23/11
OpEd Contributor
Many of the proponents of man-made global warming are now claiming that climate change is worse than they predicted. According to an Oct. 18, 2011, Daily Climate article, global warming activists claim that the “evidence builds that scientists underplay climate impacts,” and “if anything, global climate disruption is likely to be significantly worse than has been suggested.”
But a forthcoming Climate Depot A-Z Climate Reality Check report on the failure of the science behind man-made global warming theory will shatter any such illusions that the climate is “worse than we thought.” Recent scientific data and developments reveal that Mother Nature is playing a cruel joke on the promoters of man-made climate fears.
The scientific reality is that on virtually every claim, the scientific case for man-made climate fears has collapsed. The only thing “worse than we thought” is the shoddy journalism of the mainstream media, which parrots global warming activists’ baseless talking points.
Consider these facts:
The Antarctic sea ice extent has been at or near record extent in the past few summers; the Arctic has rebounded in recent years since the low point in 2007; polar bears are thriving; the sea level is not showing acceleration and is actually dropping; cholera and malaria are failing to follow global warming predictions; Mount Kilimanjaro-melt fears are being made a mockery by gains in snow cover; global temperatures have been holding steady for a decade or more as many scientists are predicting global cooling is ahead; deaths because of extreme weather are radically declining; global tropical cyclone activity is near historic lows; the frequency of major U.S. hurricanes has declined; the oceans are missing their predicted heat content; big tornadoes have dramatically declined since the 1970s; droughts are neither historically unusual nor caused by mankind; there is no evidence we are currently having unusual weather; scandals continue to rock the climate fear movement; the United Nations’ Intergovernmental Panel on Climate Change has been exposed as being a hotbed of environmental activists; and scientists continue to dissent at a rapid pace.
Even President Obama has been criticized by former Vice President Gore for failing to do enough when it comes to climate change legislation. The now-defunct congressional climate bill failed because the Democrats realized it was political suicide. The new political expediency in Washington is global warming skepticism. The U.N. global warming treaty process lies in shambles.
The promoters of man-made climate fears are now reduced to claiming—as University of California, Berkeley, professor Richard Muller did last week—that any warming trend equals some sort of “proof” of man-made warming. Those of us who laugh at Gore’s mythical “climate crisis” tip our hat to Obama for not pushing very hard for the Congressional Climate Bill and for being so tepid at U.N. climate conferences.
Of course, Obama is still threatening to unleash the U.S. Environmental Protection Agency to regulate that harmless trace essential gas we exhale from our mouths—CO2—but that effort will most likely wait until after the next presidential election.
As for Gore and the U.N.’s scientific claims, it has been quite a joy to watch the entire man-made global warming fear movement disintegrate before our eyes. A movement that had the divisive Gore as its face was bound to fail. A movement that utilized the scandal-ridden U.N.—which is massively distrusted by the American people—as the repository of science was doomed to fail. Gore is now reduced to pointing to every storm, flood, hurricane or tornado as proof of man-made global warming.
But a scientific moment of clarity is now prevailing: The U.N. and Congress do not have the power to legislate, tax or regulate the weather.
Professor emeritus of biogeography Philip Stott of the University of London explained the crux of the entire global warming debate when he rebutted the notion that CO2 is the main climate driver.
“As I have said, over and over again, the fundamental point has always been this: Climate change is governed by hundreds of factors, or variables, and the very idea that we can manage climate change predictably by understanding and manipulating at the margins one politically-selected factor (CO2), is as misguided as it gets,” Stott wrote.
To put it bluntly, the great man-made global warming catastrophe that was predicted has been canceled! And that is a victory for science.
Marc Morano is publisher of Climate Depot and a former staff member of the U.S. Senate Environment and Public Works Committee.
By Dr. William Briggs, William M. Briggs Blog
Physicist Richard Muller has a piece in today’s Wall Street Journal that should be read by everyone (The Case Against Global-Warming Skepticism).
Muller concedes - in public - what many skeptics have claimed for years: that our temperature record is poor, especially over the oceans, that it is limited, filled with errors and biases, and when used as a basis for judgment, leads to over-certainty.
[link mine]The temperature-station quality is largely awful. The most important stations in the U.S. are included in the Department of Energy’s Historical Climatology Network. A careful survey of these stations by a team led by meteorologist Anthony Watts showed that 70% of these stations have such poor siting that, by the U.S. government’s own measure, they result in temperature uncertainties of between two and five degrees Celsius or more. We do not know how much worse are the stations in the developing world.
Using data from all these poor stations, the U.N.’s Intergovernmental Panel on Climate Change estimates an average global 0.64C temperature rise in the past 50 years, “most” of which the IPCC says is due to humans. Yet the margin of error for the stations is at least three times larger than the estimated warming.
Even more delightfully, Muller admits that it has not been growing stormier (sorry, Big Al):
The number of named hurricanes has been on the rise for years, but that’s in part a result of better detection technologies (satellites and buoys) that find storms in remote regions. The number of hurricanes hitting the U.S., even more intense Category 4 and 5 storms, has been gradually decreasing since 1850. The number of detected tornadoes has been increasing, possibly because radar technology has improved, but the number that touch down and cause damage has been decreasing. Meanwhile, the short-term variability in U.S. surface temperatures has been decreasing since 1800, suggesting a more stable climate.
Nevertheless, the Berkeley project he led - which brought together physicists and (finally!) statisticians - were able to perform a complete re-analysis of all the temperature data, this time taking the main statistical statistical criticisms into account. Let’s leave aside whether these analyses were complete, rigorous, or recommended. Assume that they were. The findings?
We discovered that about one-third of the world’s temperature stations have recorded cooling temperatures, and about two-thirds have recorded warming. The two-to-one ratio reflects global warming. The changes at the locations that showed warming were typically between 1-2C, much greater than the IPCC’s average of 0.64C.
His conclusion is that “Global warming is real.” He hopes that “Perhaps our results will help cool this portion of the climate debate.”
But this blog, and all of the scientists who are critics, have agreed with this conclusion since this beginning. There simply is no debate on this question. There are no tempers to cool.
There has been, and still is, a vigorous disputation on the size of the warming and our confidence on this magnitude of warming. And Muller forgets that there has been a much more contentious argumentation about why the temperature has increased (in some places and cooled in others).
Just one thing about the first point of contention. If you look, say, at the year 1945 and compare it to the year 2010, you find warming of a certain size. But if you begin at 1940, just five years earlier, you find much less warming. Temperature increases (or decreases) are always relative to something (this is a point of logic, not physics). The choice of the comparator is arbitrary and subjective. Because of this, it is possible, and it has oft occurred, that someone wanting to stress the size of the increase will choose a comparator that best makes his case. Muller doesn’t state in his editorial what his comparator is; or why he has chosen just one.
However, we can afford to be as generous as Muller when he invited skepticism and allow that his statistical results are far more certain than any prior analysis. This merely brings us to the big question. As to that, Muller admits:
How much of the warming is due to humans and what will be the likely effects? We made no independent assessment of that.
From that he insists, “you should not be a skeptic, at least not any longer.” Somebody has to remind Mr Muller that skeptics aren’t skeptical of that some warming (and some cooling) has occurred. We are skeptics about our ability to explain this warming (and cooling), and to predict skillfully future warming (and cooling).
The fallacy - and it is a fallacy Mr Muller commits - is to suppose that because many climatologists have offered one theory for the observed warming (and cooling), and that, at least for the moment, they cannot think of one better, that therefore their theory is true. Thus, I remain skeptical.