

Guest Post by Willis Eschenbach on WUWT
Much has been made in AGW circles of the sea level forecast of Vermeer and Rahmstorf, in “Global sea level linked to global temperature” (V&R2009). Their estimate of forecast sea level rise was much larger than that of the IPCC Fourth Assessment Report (FAR). Their results have been hyped at places like RealClimate as being much more realistic than the IPCC estimates.
So I figured I’d see how Vermeer and Rahmstorf are faring to date. Their results for each of the IPCC “scenarios” are archived here, and the first thirty years of their estimates are presented along with nearly twenty years of actual observations in Figure 1.
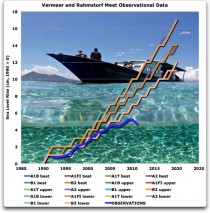
Figure 1. Enlarged. Satellite-based sea level observations (blue line), along with the V&R2009 sea level estimates corresponding to the various IPCC future scenarios. Sea level observations from the University of Colorado. PHOTO SOURCE
So...how are the V&R2009 predictions holding up?
Well,… or to be accurate, not well. As you can see, the observations showed an actual sea level rise that is below the lowest of the V&R2009 estimates from the lowest of the IPCC scenarios.
At present, assuming that the distance between their “best” estimate and their “lower” estimate is two standard deviations, the data is now more than four standard deviations below the “best’ V&R2009 estimate.
So in answer to how their forecasts are faring, the answer is… very poorly. Abysmally, in fact. Actual observations are lower by four standard deviations than the V&R2000 “best” estimate, and are two standard deviations lower than their “lower” estimate.
Technote 1 - The Colorado folks have recently included a 0.3mm/year increase in sea levels in their results. They say (possibly correctly) that this is necessary to adjust for the sinking of the ocean floor with the increasing weight of sea water from the melting at the end of the last ice age. However, since neither the IPCC nor the V&R2009 figures include that adjustment, I have not included it in this analysis so that we can compare apples to apples.
Technote 2 - I have aligned the Colorado observational results so that their trend line is zero in 1990, in order that they can be compared directly with the V&R2009 results, which have 1990=0 as their starting point. This also aligns the starting observations with the V&R2009 “best” estimate.
By Christopher Booker, UK Telegraph
In the week when it was reported that 20 per cent of the EU’s fast-soaring, trillion-euro budget may soon be spent on “fighting climate change”, it was timely that Britain’s energy companies should have met with the Department of Energy and Climate Change to raise one of the best-hidden secrets of our Government’s obsession with wind power.
Centrica and other energy companies last week told DECC that, if Britain is to spend £100 billion on building thousands of wind turbines, it will require the building of 17 new gas-fired power stations simply to provide back-up for all those times when the wind drops and the windmills produce even less power than usual.
We will thus be landed in the ludicrous position of having to spend an additional £10 billion on those 17 dedicated power stations, which will be kept running on “spinning reserve”, 24 hours a day, just to make up for the fundamental problem of wind turbines. This is that their power continually fluctuates anywhere between full capacity to zero (where it often stood last winter, when national electricity demand was at a peak). So unless back-up power is instantly available to match any shortfall, the lights will go out.
Two things make this even more absurd. One, as the energy companies pointed out to DECC, is that it will be amazingly costly and wildly uneconomical, since the dedicated power plants will often have to run at a low rate of efficiency, burning gas but not producing electricity. This will add billions more to our fuel bills for no practical purpose. The other absurdity, as recent detailed studies have confirmed, is that gas-fired power stations running on “spinning reserve” chuck out much more CO2 than when they are running at full efficiency - thus negating any savings in CO2 emissions supposedly achieved by the windmills themselves.
Is there no longer anyone around at DECC who is familiar with these very basic practical points? The policy on which our national energy strategy is now centred is a ludicrously expensive, self-defeating joke, which will achieve no benefits whatever – even if you are among the diminishing number of people who still believe that man-made CO2 is causing catastrophic climate change.
Unfortunately, among those still in the grip of these fantasies are David Cameron, Chris Huhne and the EU, who between them are now responsible for Britain’s energy policy. I’m afraid we are in the hands of very dangerous children, upon whose deranged wishful thinking a large part of our country’s future depends.
By Andrew Bolt, Herald Sun
Julia Gillard claims global warming is already killing the Great Barrier Reef:
Australian natural wonders such as the Great Barrier Reef are already being damaged, and the risk of coastal flooding could double by the end of the century.
Warmist alarmist Sir Nicholas Stern made the same claim:
The snows on Kilimanjaro are virtually gone, the Barrier Reef is probably going...
The ABC was already hypeing up the destruction of the reef by global warming in 2002:
The Great Barrier Reef Marine Park Authority says up to 10 per cent of the reef has been lost to bleaching since 1998.
ABC host Kerry O’Brien back then treated the death of the reef as imminent:
It’s not just Australia’s farmlands which are threatened by global warming, the greenhouse effect could also spell disaster for coral reefs around the world, including our own natural wonder, the Great Barrier Reef.
As Australia prepares for another hot summer, one man is on a mission to capture as many corals as possible on high-definition camera before even more stretches of once-spectacular reef are bleached bone-white.
And remember the alarmism of prominent warmist Ove Hoegh-Guldberg?
In 1998, he warned that the reef was under pressure from global warming, and much had turned white. He later admitted the reef had made a “surprising” recovery.
In 1999 he claimed global warming would cause mass bleaching of the reef every two years from 2010.
He yesterday admitted it hadn’t.
In 2006, he warned high temperatures meant “between 30 and 40 per cent of coral on Queensland’s Great Barrier Reef could die within a month”.
He later admitted this bleaching had a “minimal impact”.
All that alarmism, relentlessly pushed by this desperately dishonest government, is now blown out of the water by the latest research by Townsville’s Australian Institute of Marine Science:
Monitoring data collected annually from fixed sites at 47 reefs across 1300 km of the GBR indicate that overall regional coral cover was stable (averaging 29% and ranging from 23% to 33% cover across years) with no net decline between 1995 and 2009....
Crown-of-thorns starfish (Acanthaster planci) outbreaks and storm damage were responsible for more coral loss during this period than either bleaching or disease despite two mass bleaching events and an increase in the incidence of coral disease.
While the limited data for the GBR prior to the 1980’s suggests that coral cover was higher than in our survey, we found no evidence of consistent, system-wide decline in coral cover since 1995. Instead, fluctuations in coral cover at subregional scales (10–100 km), driven mostly by changes in fast-growing Acroporidae, occurred as a result of localized disturbance events and subsequent recovery.
You have been deceived again and again and again.