

What follows is the latest Press Release dated July 24, 2017 publicly announcing the fact our legal team has now submitted to EPA a Second Supplement to our Petition for Reconsideration of EPA’s GHG/CO2 Endangerment Finding. The Second Supplement to the Petition relies on a third new major peer reviewed scientific paper from James Wallace, Joseph D’Aleo and Craig Idso, published in June 2017. As stated in the Press Release below:
The Second Supplement to Petition states:
Adjustments that impart an ever-steeper upward trend in the data by removing the natural cyclical temperature patterns present in the data deprive the (Global Average Surface Temperature) GAST products from NOAA, NASA and Hadley CRU of the credibility required for policymaking or climate modeling, particularly when they are relied on to drive trillions of dollars in expenditures.
The invalidation of the adjusted GAST data knocks yet another essential pillar out from under the lines of evidence that are the claimed foundation of the Endangerment Finding. As the Second Supplement to Petition states:
It is therefore inescapable that if the official GAST data from NOAA, NASA and Hadley CRU are invalid, then both the “basic physical understanding” of climate and the climate models will also be invalid.
Our Ad Hoc Team, operating totally on a Pro Bono basis, submitted the Supplement in a further effort to encourage the EPA to grant our Petition for Reconsideration of its Endangerment Finding. This new Research provides a separate and distinct invalidation of its Finding.
Please make this Press Release publicly available by any means you feel appropriate. Its URL can be found here.
Please do not hesitate to call me or the lawyers listed under Media Contacts for further information on this matter.
--------
PRESS RELEASE
July 24, 2017
Electricity Consumers File New Study in Their Call for EPA to Reopen its Endangerment Finding
Key Points:
1. Just Released, new research findings demonstrate that adjustments by government agencies to the global average surface temperature (GAST) record render that record totally inconsistent with published credible temperature data sets and useless for any policy purpose.
2. The new results invalidate the claims based on GAST data of “record warming” in recent years, and thereby also invalidate the so-called “lines of evidence” on which EPA claimed to base its 2009 CO2 Endangerment Finding.
3. If the Endangerment Finding is not vacated, whether the current administration likes it or not, it is certain that electric utility, automotive and many other industries will face ongoing EPA CO2 regulation.
4. This scientifically illiterate regulation will raise U.S. energy prices thereby reducing economic growth and jobs.
July 24, 2017
The Concerned Household Electricity Consumers Council announces that on July 6, 2017 it filed with EPA a Second Supplement to the Council’s January 20, 2017 Petition asking the Agency to reconsider the scientifically invalid Endangerment Finding on which all Obama-era greenhouse gas regulations are based. The Second Supplement to Petition may be found here
The Council’s original Petition (see) and First Supplement to Petition (see) demonstrated that the Endangerment Finding is nothing more than assumptions that have each been disproved by the most relevant empirical evidence from the real world. The original Petition was substantially based on a major peer-reviewed 2016 scientific paper by James Wallace, John Christy and Joseph D’Aleo (Wallace 2016) that analyzed the best available temperature data sets and “failed to find that the steadily rising atmospheric CO2 concentrations have had a statistically significant impact on any of the 13 critically important tropical and global temperature time series data sets analyzed.” The full text of Wallace 2016 may be found here.
The First Supplement to Petition was substantially based on a new April 2017 peer reviewed scientific paper, also from the same authors (Wallace 2017A). Wallace 2017A can be found here. Wallace 2017A concluded that once impacts of natural factors such as solar, volcanic and ENSO activity are accounted for, there is no “natural factor adjusted” warming remaining to be attributed to rising atmospheric CO2 levels.
The Second Supplement to the Petition now relies on a third new major peer reviewed scientific paper from James Wallace, Joseph D’Aleo and Craig Idso, published in June 2017 (Wallace 2017B). Wallace 2017B analyzes the GAST data issued by U.S. agencies NASA and NOAA, as well as British group Hadley CRU. In this research report past changes in the previously reported historical data are quantified. It was found that each new version of GAST has nearly always exhibited a steeper warming linear trend over its entire history. And, this result was nearly always accomplished by each entity systematically removing the previously existing cyclical temperature pattern. This was true for all three entities providing GAST data measurement, NOAA, NASA and Hadley CRU.
The Second Supplement to Petition states:
Adjustments that impart an ever-steeper upward trend in the data by removing the natural cyclical temperature patterns present in the data deprive the GAST products from NOAA, NASA and Hadley CRU of the credibility required for policymaking or climate modeling, particularly when they are relied on to drive trillions of dollars in expenditures.
The invalidation of the adjusted GAST data knocks yet another essential pillar out from under the lines of evidence that are the claimed foundation of the Endangerment Finding. As the Second Supplement to Petition states:
It is therefore inescapable that if the official GAST data from NOAA, NASA and Hadley CRU are invalid, then both the “basic physical understanding” of climate and the climate models will also be invalid.
The scientific invalidity of the Endangerment Finding becomes more blindingly obvious and undeniable with each day’s accumulation of reliable empirical data. It is time for an honest and rigorous scientific re-evaluation of this Obama-era political document. The nation has been taken down a tragically foolish path of pointless regulations and wasteful mal-investments to “solve” a problem which does not actually exist. Our leaders must summon the courage to acknowledge the truth and act accordingly.
The Council brought its Petition because the Obama-era greenhouse gas regulations threaten, as President Obama himself conceded, to make the price of electricity “skyrocket.” All Americans will benefit from a new era where the cheapest sources of energy can also compete and prevail in the marketplace.
Media Contacts:
Harry W. MacDougald
Caldwell Propst & DeLoach LLP
Two Ravinia Drive, Suite 1600
Atlanta, Georgia 30346
(404) 843-1956
hmacdougald@cpdlawyers.com
Francis Menton
Law Office of Francis Menton
85 Broad Street, 18th floor
New York, New York 10004
(212) 627-1796
fmenton@manhattancontrarian.com
“I would rather have questions that can’t be answered, than answers that can’t be questioned.” - Nobel Laureate Richard Feynman, Physics
Joseph D’Aleo, CCM, AMS Fellow
WeatherBELL Analytics, LLC
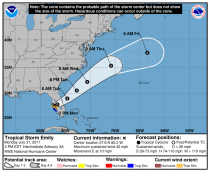
A weak tropical storm Emily came ashore in Florida this morning.
It will cross into the Atlantic and maintain tropical storm intensity according to NHC.
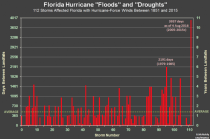
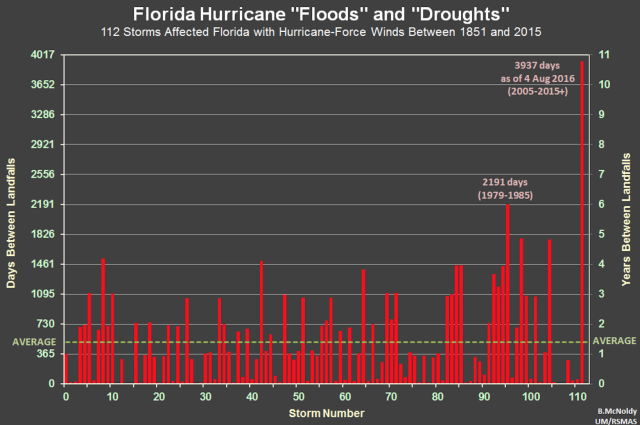
The chart above shows the intervals between major hurricane landfalls in Florida as of August 4, 2016. A year later, we will be now at an amazing 4302 days, twice the original record.
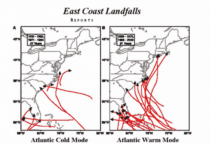
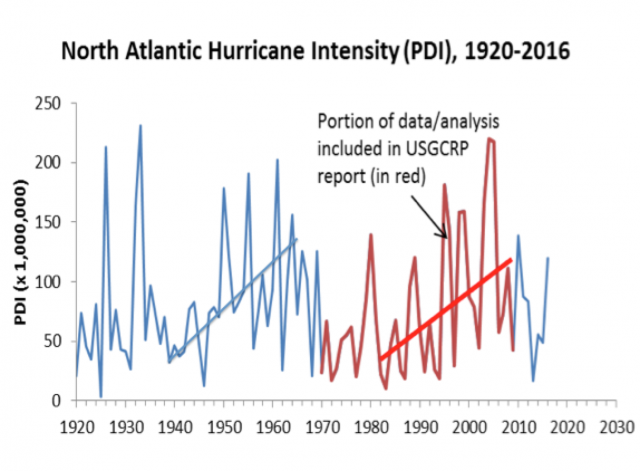
You can see cycles in Atlantic hurricane intensity.

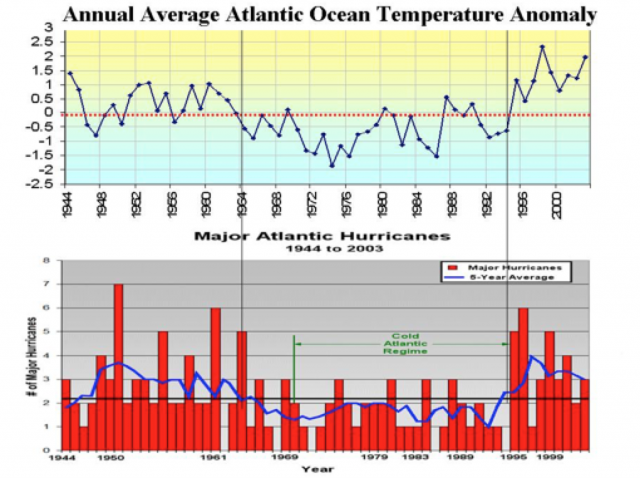
The hurricane activity in the Atlantic is tied to cycles of the Atlantic AMO warm and cold modes.

See the frequency of major hurricanes and landfall in the warm and cold modes.
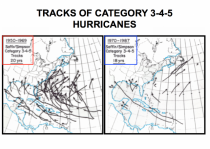
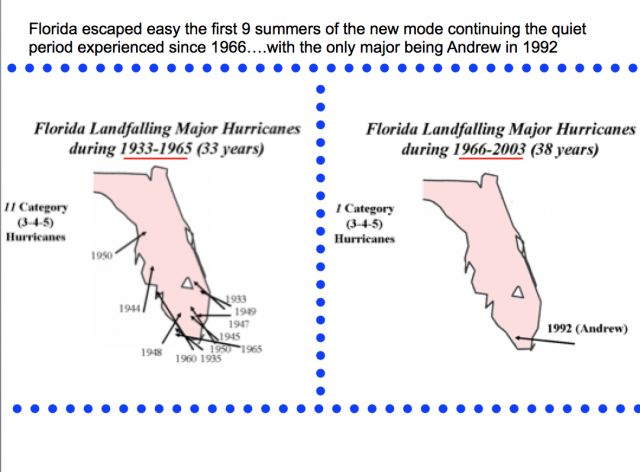
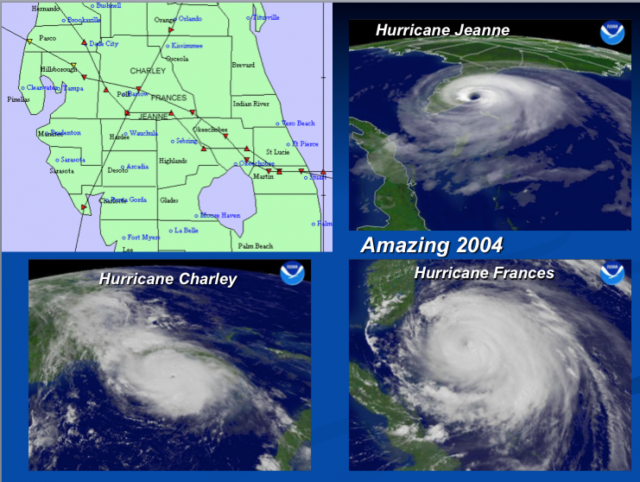
Florida peninsula escaped a major landfall during the first 9 summers of the latest warm mode starting in 1995.
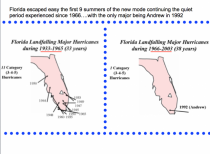
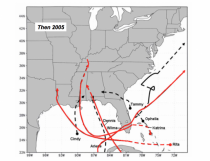
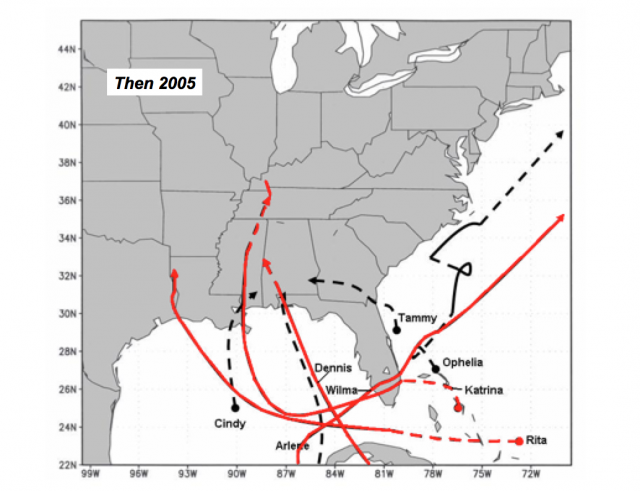
Then came 2004 with three storms and in the panhandle Ivan and then Wilma in 2005.


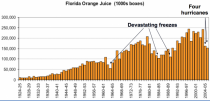
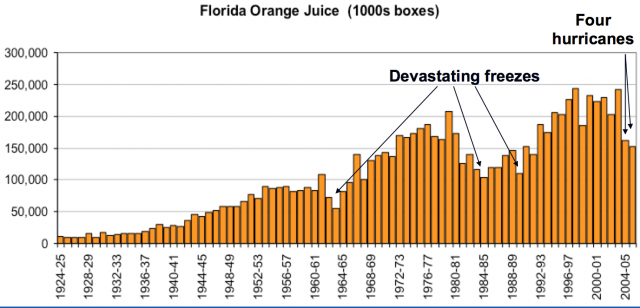
The four significant hurricanes hurt citrus like 1960s and 1989s devastating freezes.
The current SSTA pattern in not like 2004 in the North Pacific though it was similarly Modoki-like in the tropics and somewhat similar in the Atlantic.
See the difference.
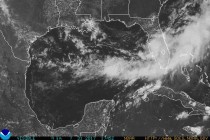
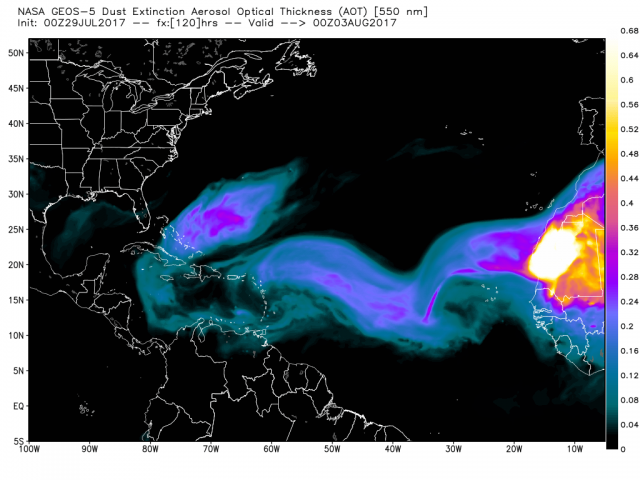
We will battle Saharan Dust a while longer. Usually Atlantic pressure changes diminish that by mid August. The season rises quickly to a peak around September 10.
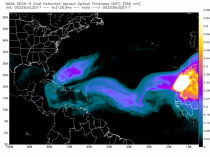
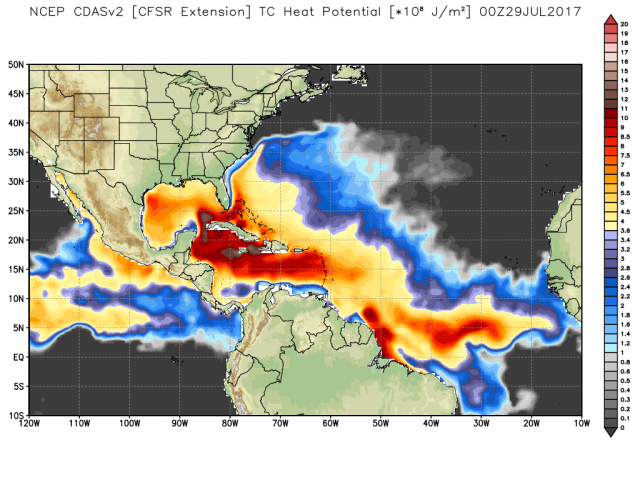
See the western Atlantic and Caribbean are primed with high ocean heat content, typical of the late summer.

By Joseph D’Aleo, CCM, Co-Chief Meteorologist, WeatherBELL Analytics
You can count on it most years about this time. Summers are rarely ‘steady as she goes’. The meanderings of the MJO will cause some dry periods and transient heat in every summer. There is nervousness among farmers at critical times like when the corn is pollinating in July. There are always forecast groups that make the headline by putting a drought gloom and doom scare into the market.
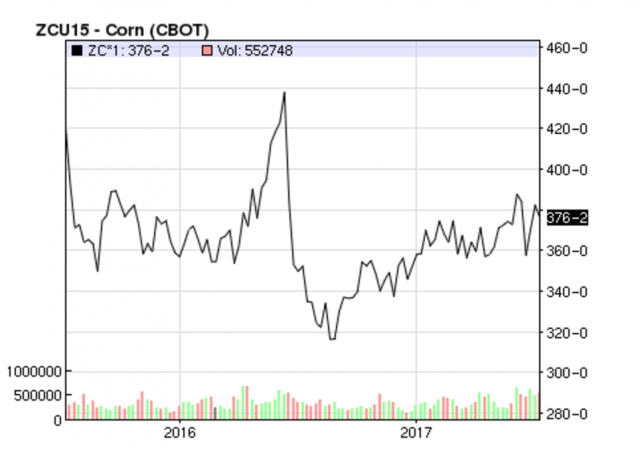
Last year this very time there was a rally based on forecasts of a withering crop due to high heat and futures corn price forecasts of $6+. Two warm days and a spike to $4.40 were followed by showers and cooling and a record crop and low corn prices (below $3.20.). See the current levels far right.

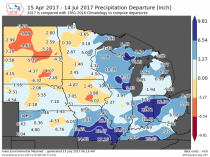
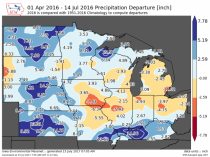
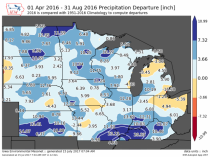
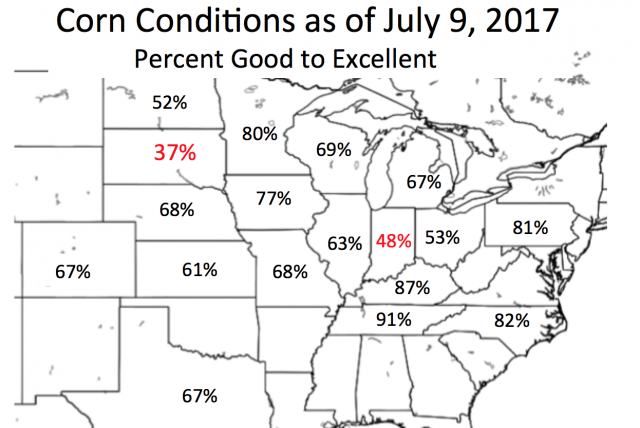
Yes we have been covering almost daily the dryness in the north central that has seriously hurt spring wheat and to a lesser degree corn and beans and made note of the borderline excessive rains in parts of the central Ohio Valley and southern Missouri.
Enlarged (ISU)

Last year on this date, see the dryness from Iowa through the Ohio Valley.
Enlarged (ISU)
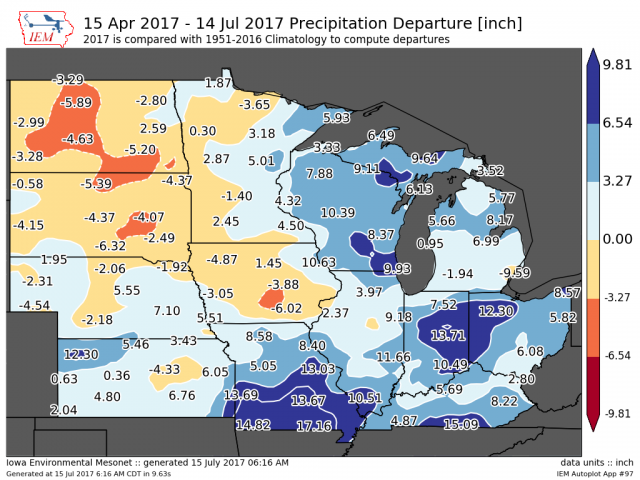
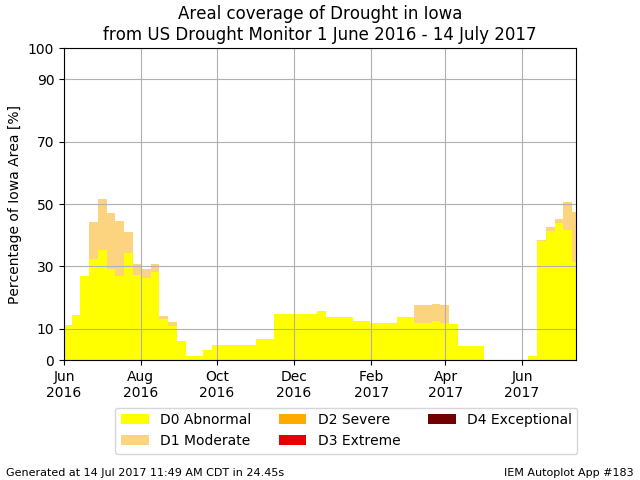
See how the same level of abnormal to moderate drought was reported in southeast Iowa this time of July as is currently the case. Last year, you can see the reason for the concern with the dryness in southeast Iowa into Illinois (the top 2 corn states). Actually a little dryness with an adequate deep soil moisture profile encourages deeper root systems that help plants get by transient heat stress. That was the case last year and is this year in the southern Iowa deficit area.

Enlarged (ISU)
But the heat that worried the market was transient as WeatherBELL forecast and the rains came to all the prime areas. In the eastern Ohio Valley, the late rains made for a better bean crop which is more drought hardy and which has its critical phases in August.
Enlarged (ISU)
James McCune, an Illinois farmer and his team did crop tours for us and he and we and very soon after the USDA NASS predicted a record crop. HIs reports can be found here and here. See how all but the eastern Corn Belt ended up normal to above for rain.The reason they recovered last year and will this year is the seasonal thunderstorm complex season last year did and this year should deliver even into the more serous drought areas of the north central.
Some forecast groups and analysts are warning the heat and ‘drought’ could cause yields to drop to 4 to 5% below long term trend lines and corn prices to spike to $6. We have expressed opinions when asked that the yields will fall short of last year (too dry in the Dakotas and too wet in spots in central Indiana and western Ohio) but with a good crop elsewhere including prime areas of Iowa, Illinois, Wisconsin and Minnesota should be above the trend line.
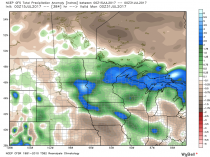
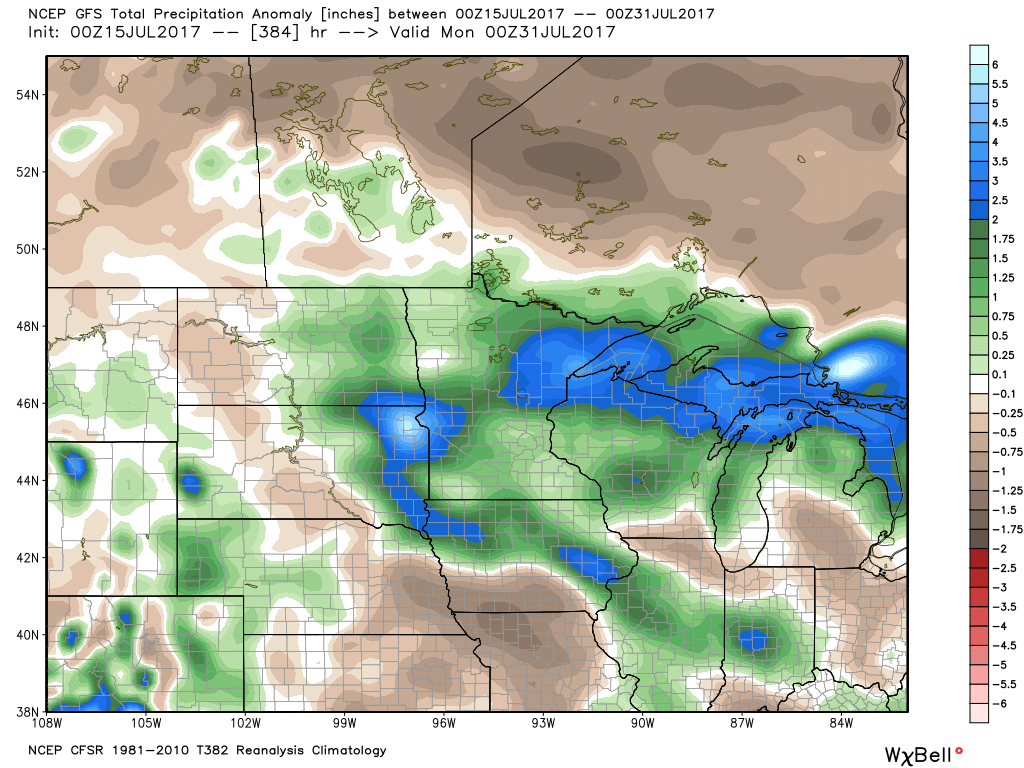
Here is the 16 day forecast of rainfall anomalies. As you can see not all models show the dryness as the forecasters warned. Note on WeatherBell we show the high res, more skillful EC forecast out to 46 days but I can’t show it on general non commercial sites. It is wetter still (and cooler).
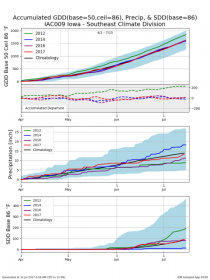
See how southeast Iowa has had normal GDDs and SDD (stress degree days) and slightly below normal rainfall. It is better in thee regards than 2016 at this time there.
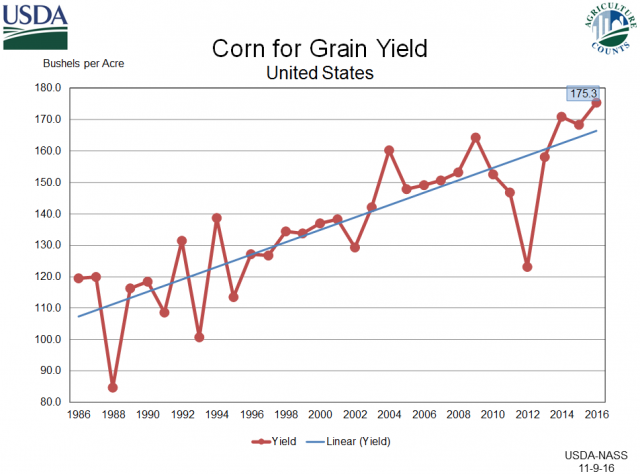
See how yields for corn have increased as the extent of heat has declined, rains have slightly increased and CO2 fertilization (CO2 also reduces water needs).

Enlarged (USDA)