

As a basic starting point, I suggest that on any story of political importance in the New York Times, the truth is probably exactly the opposite of what they report. Consider that lead story on the front page of yesterday’s Sunday print edition: “World Leaders Move Forward on Climate Change, Without U.S.” Scary! The U.S. is getting completely isolated from the world community!
In a final communiqué at the conclusion of the Group of 20 summit meeting in Hamburg, Germany, the nations took “note” of Mr. Trump’s decision to abandon the pact and “immediately cease” efforts to enact former President Barack Obama’s pledge of curbing greenhouse gas emissions 26 to 28 percent below 2005 levels by 2025. But the other 19 members of the group broke explicitly with Mr. Trump in their embrace of the international deal, signing off on a detailed policy blueprint outlining how their countries could meet their goals in the pact.
You can definitely count on Pravda not to look into what these other 19 countries have promised to do and let you know if there is any substance to it. So the hard work falls once again to the Manhattan Contrarian. If you just Google the letters “INDC” ("Intended Nationally Determined Contribution") along with the name of a country, you can find out exactly what that country has promised to do as part of the Paris Agreement. So let’s take a look at what a few of the big countries are up to.
China. We already know that answer from my post just last week. China, through its companies, is planning to build over the course of the next decade or so well more than double the number of coal power plants that the U.S. has today. It’s INDC calls for its proceeding to increase carbon emissions as much as it wants through 2030, and only then (when everyone in China presumably has electricity and a couple of cars) to level things off. By that time its emissions will probably be at least triple those of the U.S.
India. India’s INDC openly admits that it intends to increase its electricity supply by more than triple between now and 2030, with no commitment whatsoever as to how much of that will come from fossil fuels. Oh, they say that they plan to lower the “emissions intensity” of their energy generation, and greatly expand (useless) wind and solar capacity, as well as nuclear. Whoopee!
Indonesia. These things get more comical the more of them you read. The first thing you learn in reading Indonesia’s INDC is that the large majority of its emissions come from burning down the rain forest ("most emissions (63%) are the result of land use change and peat and forest fires") and very little from using fossil fuels for energy ("fossil fuels contribute[e] approximately 19% of total emissions"). So they’ll promise to burn down less of the rain forest, and nothing whatsoever as to reducing use of fossil fuels for energy. Their (completely illusory) “reduction target” of 29% by 2030 is not against a fixed amount of past usage (like the United States’ benchmark of 2005 emissions), but rather is against what they call a “business as usual” scenario of projected future emissions that are a multiple of today’s.
Russia. What, you didn’t know that Russia was a member of the G20? What is the chance that Russia would make an honest promise about emissions reductions? Their INDC calls for reducing emissions by 25-30% below 1990 by 2030. Impressive! Wait a minute! The Soviet Union collapsed in 1991. Then they closed down all that inefficient Soviet industry. According to a graph at Climate Action Tracker here, by 2000 their emissions were down by almost 40% from the 1990 level, and they have only crept up a little from there since. In other words, Russia’s supposed “commitments” again represent increases from today’s level of emissions. Yet another total scam.
Germany. Germany is part of the supposed EU commitment to reduce emissions by 40% below 1990 levels by 2030. Oh, but now that Germany has gotten its electricity production from renewables up to about 30%, it seems that it has hit a wall, and its carbon emissions have actually gone up for both of the last two years (2015 and 2016), according to Clean Energy Wire. Exactly how do they plan to meet their goal? Excellent question.
In other words, this whole thing is a total farce. The G20 “climate” thing—let alone New York Times reporting on same—is nothing more than an international effort to bully the United States into crippling its economy while everyone else goes right ahead and uses fossil fuels exactly as they please. Whatever else you might say about President Trump, he seems to be unusually immune to this kind of bullying.
Without the U.S. in the game, all the biggest players are going to be increasing emissions, not decreasing them. In reality, the whole “global action on climate change” thing is completely dead.
I can’t leave this subject without mentioning this great quote from former Obama State Department official Andrew Light:
“[T]he U.S. has isolated itself on climate change once again, and is falling back while all other major economies step up and compete in the clean energy marketplace created by the Paris Agreement estimated to be worth over 20 trillion dollars,” said Andrew Light, a senior climate change adviser at the State Department under Mr. Obama.
As you can see, knowledge of basic economics was not a requirement to work at the Obama State Department. Andrew apparently has no understanding that the forced use of less efficient energy sources destroys wealth.
Guest essay by David Archibald
From a post a couple of days ago: “an F10.7 flux above 100 causes warming and below that level causes cooling.” Greg asked “Can you prove that?” I already had in this WUWT post from 2012. But it is worth revisiting the subject because it answers the big question - If all the energy that stops the Earth from looking like Pluto comes from the Sun, what is the solar activity level that corresponds to our average climate? Because solar activity is falling and climate will follow.
As Nir Shaviv observed, the oceans are a big calorimeter. First, proof of concept comes from a much smaller body of water: Lake Victoria in East Africa. Back in the 1920s it was realized that the level of Lake Victoria went up and down with the solar cycle. Then the relationship broke down in the 1930s, corresponding to the beginning of the Modern Warm Period, before resuming again in the 1970s.
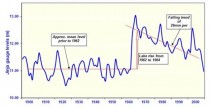
Figure 1: Lake Victoria lake level 1896 to 2005 (data courtesy of Dr Peter Mason)
If we take out the period of non-correlation and detrend afterwards for the 2 metre rise from 1962 to 1964, this is what the relationship between lake levels and solar cycles looks like:
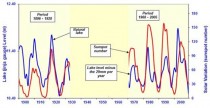
Figure 2: Solar Cycles and Lake Victoria lake level 1896 to 2005
The relationship is very clear, in fact beyond indisputable. It also holds true for the body of water that covers 70 percent of the Earth’s surface as shown by Figure 3:
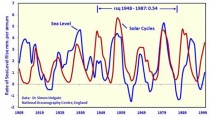
Figure 3: Solar Cycles and Sea Level 1909 to 2000
From that data, a 33-year subset from 1948 to 1987 has a high correlation:
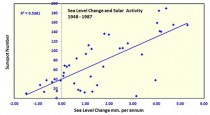 Figure 4: Sea Level Change and Solar Activity 1948 to 1987
Bingo. If we take the change in sea level from one year to the next plotted against average sunspot number for that year, we get a near-straight line relationship. The breakover between sea level rise and sea level fall, and thus warming or cooling climate, is a sunspot number of 40, which in turn corresponds to an F10.7 flux of 100. The average sunspot number over the Holocene was 40 which in turn makes sense of the last half-century of climate. The Earth's climate was in equilibrium with an average sunspot number of 40, and the higher solar activity of recent years disturbed that. Now we are returning to normal.
At the end of this decade, at the solar cycle 24/25 minimum, we might get a few years of as much as 2.0 mm per annum sea level fall. If you don't believe that, perhaps you would rather believe this:
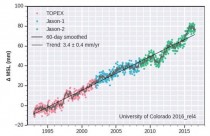
Figure 5: Global Mean Sea Level Time Series 1993 to 2016
That is from the clown show that is the Colorado University Sea Level Research Group.
That graphic is based on satellite data and shows a scary, nearly monotonic sea level rise of 3.4 mm per annum. How they get that is explained in this graph:
Figure 6: Creating a graph that keeps the grant money flowing
Figure 6, from this paper, shows that sea level, as measured by satellites - the lower line, has been flat. How they generate the graph they need, the upper line, is by adding an isostatic adjustment, which is a number plucked from thin air. No more needs to be said.
By Anthony Watts
Yesterday, the American Meteorological Society (AMS) published a letter yesterday to U.S. Secretary of Energy Rick Perry, admonishing him for having the temerity to doubt that carbon dioxide is the “primary driver” of global warming.
Here is the letter.
Here are a few of my thoughts.
The AMS, in their letter, say skepticism is welcome:
In the interview you also mentioned that it should be quite acceptable to be a skeptic about aspects of the science. We agree, and would add that skepticism and debate are always welcome and are critically important to the advancement of science.
Yet, the very letter they sent contradicts this, suggesting that there is no debate nor room for skepticism about carbon dioxide being the primary driver of temperature change.
The fundamental problem of our knowledge boils down to the sample size. We only have about 100 or so years of temperature records that are worth anything and even the most recent records on all that good because they’re terribly polluted by the infrastructure of human existence itself. And further our understanding of atmospheric and oceanic cycles is even more limited in time than the case of global temperature data.
If you were to line up our period of first-hand scientific knowledge of Earth’s processes, against the period of humanity’s intelligence, it would just be a small speck on the timeline. To assume we have certainty in knowledge about Earth’s processes, when new processes are still be discovered, is pure folly.
Even today, we are discovering more about our atmosphere than we knew 30 years ago in June 1988 when Dr. James Hansen first declared it a problem, and there are studies that show that recent record breaking warmth, such as a paper just published in Nature, Yao et al. Distinct global warming rates tied to multiple ocean surface temperature changes. covered here on WUWT.
For the AMS to admonish Perry that there’s no room for debate on Carbon Dioxide as being the primary driver, is essentially to deny the process of science itself. Science is often right, and also often wrong, but just as often, it is self-correcting. If global warming hadn’t become such an entangled and messy social and political issue, it’s likely that science would have done some levels of self-correction on the issue already.
For example, it was once believed that the Earth’s plates did not move, until plate tectonics came along. Alfred Wegener proposed continental drift in 1912, but it took until the 1960’s for it to become generally accepted, when a drastic expansion of geophysical research, driven by the cold war, produced evidence that reopened and eventually settled the debate.1 Science self-corrected, but it took decades because scientists are often reluctant to embrace change which threatens the validity of their own work. It was also generally believed that stress caused stomach ulcers, until a clinician, exasperated by lack of attention to his pointing out that the real cause was the bacterium Heliobacter Pylorii infecting the stomach lining 2, had to prove it against the consensus, and drank a bacterial cocktail and developed an ulcer himself. He won the Nobel prize for defying that consensus 3.
Science that fails to account for the possibility of being wrong is of no virtue.
The AMS should lead in science by setting an example, by showing that even in the face of overwhelming consensus on an issue, there must be room for doubt, and thus room for self-correcting science. It only takes one finding in science to refute consensus, no matter whether it’s 97%, 99%, or 100%. Science is not infallible.
Anthony Watts
-------
Nicely done, Anthony.
Shortly after the post, Ryan Maue, a fellow WeatherBELLian wrote:
Rick Perry said the following:
Asked whether CO2 emissions are primarily responsible for climate change, Perry told CNBC’s “Squawk Box”: “No, most likely the primary control knob is the ocean waters and this environment that we live in.”
“The fact is this shouldn’t be a debate about, ‘is the climate changing, is man having an effect on it?’ Yeah, we are. The question should be just how much, and what are the policy changes that we need to make to effect that?” he said.
The AMS statement says this is indisputable: “It is clear from extensive scientific evidence that the dominant cause of the rapid change in climate of the past half century is human-induced increases in the amount of atmospheric greenhouse gases ...”
Now, an eagle eyed reader with some nuanced knowledge of climate science could interpret Secretary Perry’s statement as rather profound. He posits that the oceans are acting as the “primary control knob” responsible for (recent) climate change. With the now voluminous literature on the hiatus and consensus view that the Interdecadal Pacific Oscillation (IPO) phase changes result in “pauses”, one could look back to the 1976-77 Great Pacific Climate Shift as the beginning of recent global warming as we know it. It’s not exactly clear to me how CO2 concentration changes causes these rather dramatic, decadal scale Pacific Ocean heat distribution changes.
See also Ryan Maue and Michael Bastasch story on the Daily Caller on The New Consensus On Global Warming here.
Nicely done, Ryan. My compadre at WeatherBELL, Joe Bastardi agrees:
Spot on right Ryan. I have argued and do so in the patriot posts in 2 main blogs, the Grand Slam of Climate and a short summation of my climate position, the same thing, There is nothing irrational or radical about simple observational data of the past, which by the way has support from Greenland Ice cores and tree ring study. I have the sun, the oceans, stochastic events and the VERY DESIGN OF THE ENTIRE SYSTEM (land and ocean configuration, wobbles on its axis in an elliptical orbit around a somewhat inconsistent start dwarfs the affect of CO2 given the entire planetary history of CO2/temp.
I have coauthored a series of reports covered here that the natural factors are the real drivers that has the deep state climate world throwing the big guys to try to discredit, but they simply use a call to authority. I have done a series of 5 videos called the Winds of Change : CO2- the Demon gas?, Taking the Earth’s Temperatures, Weather Extremes, The Man-made and Natural Factors (not including CO2) that really drive the climate changes and Renewable Energy and the Paris Accord. I will post links to them all here after they air on local cable. Here is the relevant part IV.
-------
ICECAP COMMENT:
For a lifelong member of the AMS, a Fellow of the AMS, a CCM, former Chair of the Committee on Weather Analysis and Forecasting and the only private meteorologist to be elected by my peer to be a councilor, it is a sad day to see a former Texas Governor to know more about the scientific method and the science of climate than the AMS Director. I dearly miss Ken Spengler more every day.
----------
Yes, Prime Minister Gets it Right: Global Warming is a Sham Front for Political and Financial Ambitions
The BBC’s news side is utterly dedicated to spreading global warming alarmism and has even had a policy of refusing to interview fully qualified scientists who question it.
But its entertainment side isn’t quite on board with that. Two years ago the program Yes, Prime Minister aired a devastating critique of climate hysteria in one of its episodes.