

World Climate Report
We hear over and over that any warming at the global scale will be amplified in the Arctic region of the Northern Hemisphere, and the warming will cause ice to melt and sea level to rise and all the rest. Let some ice-free area appear during summer near the North Pole and the global media will take the bait every time and announce we are witnessing geophysical changes of Biblical proportions. Several articles have appeared recently in leading journals with interesting results regarding the temperature history of the Arctic over the past 1,000 to 1,500 years, and they show that temperatures there have risen and fallen to a significant degree many times in the past (that is, without the benefit of large changes in atmospheric CO2 levels), and they call into question whether any unusual warming (or cooling) has occurred there in recent decades.
The first article appeared in Climatic Change and was generated by six scientists with California’s Scripps Institution of Oceanography, Japan’s Institute for Global Environmental Strategies, the French Laboratoire de Glaciologie et Geophysique de l’Environnement, Japan’s National Institute of Polar Research, the University of California, San Diego, and Japan’s Meteorological Research Institute; the work was funded by the United States National Science Foundation.
This is a long and detailed article in which the authors show that temperatures in Greenland can be reconstructed using isotopes of nitrogen and argon trapped in air bubbles that can be found in ice cores. They used an ice core from central Greenland and made detailed measurements of the nitrogen and argon isotopes. Along with many other tests, Kobashi et al. compared their reconstructed temperatures to actual historical measurements from Greenland’s south and west coasts, and as seen in Figure 1, things look rather good.
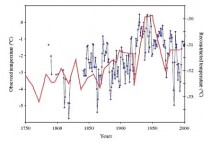
Figure 1. Enlarged. Observed (blue) and reconstructed (red) Greenland temperature records. The observed record is a compilation of records from llulissat, Nuuk, and Qaqurtop located along the south and west coast of Greenland. To smooth the observed data, a 2-year moving average is applied (from Kobashi et al., 2010)
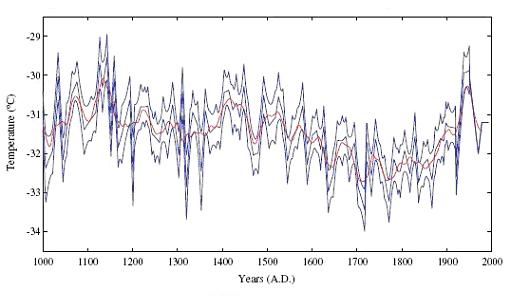
While the observational record is at best a few hundred years long, Kobashi et al.’s reconstructed temperatures go back 1,000 years (Figure 2). The full reconstruction is quite interesting as it clearly shows a relatively warm and early period culminating in greatest warmth near 1150; the Medieval Warm Period certainly appears in the record. A cooling begins near 1450 and culminates in a particularly cold period from 1700 to 1850; the authors refer specifically to the “severity of the late Little Ice Age”. Fortunately, Greenland recovered from the Little Ice Age with pronounced warming from 1850 to 1950. After the final period of cooling from 1950 through the mid-1990s that is depicted in Figure 2, temperatures have once again risen to mid-20th century levels (a rise that occurred after the end of the period of record analyzed by Kobashi et al. and thus not appearing on Figure 2). But before attributing the temperature rise during the past 10 years to the buildup of greenhouse gases, it is worth considering the ups and downs apparent in the entirety of the temperature record as shown in Figure 2, and also recalling that atmospheric CO2 levels were increasing between 1950 and 1995, when temperatures were declining in Greenland.
Figure 2. Enlarged. The last 1,000 years of Greenland temperature derived from nitrogen and argon isotopes in air bubbles in ice. Thick blue line is mean of results of Monte Carlo simulation, and thin blue lines are error bands (1σ![]() . Red line is a smoothed temperature history (50-year running mean) (from Kobashi et al., 2010)
. Red line is a smoothed temperature history (50-year running mean) (from Kobashi et al., 2010)
Peering back to 1000 AD was fun, but a second recent article in the Norwegian Journal of Geology contains an Arctic reconstruction going back even further, to 500 AD. The work was produced by three scientists with Norway’s University of Tromso and the Geological Survey of Norway. Rorvik et al. focused on a sediment core extracted from the Malangen fjord located in northern Norway. The fjord is well-situated to capture variations in temperature that would be reflected in changes in currents near the fjord. Just like magic, organic cysts collect on the bottom and over time, variations in the types of cysts are related to variations in temperature. The authors never produce a graphic showing the changes in temperature from 500 AD to present, but they clearly describe the results.
They note “In general, the time from c. AD 500 to 790 in the Malangen fjord is characterized as a cool period with reduced salinity. A cooling during this time interval, referred to as the Dark Ages Cold Period, is supported by regional and local history.” Next, they state “The dinocyst assemblages during the years AD 790 to 1500 indicate that the Medieval Warm period in the Malangen fjord, was characterized by increased inflow of warm, saline water. The Medieval optimum from the years AD 800/1000 to AD 1300/1500, has been reported as a warm phase from the Vøring Plateau, Norway, from North Sweden and northern Norway, Crete, Camp Century and GISP2 Greenland and Quelccaya Peru and from Nansen Fjord, eastern Greenland” (so much for the Medieval Warm Period being a local phenomenon - Peru is hardly near the Norwegian study area!).
Do you think they found evidence of the Little Ice Age (LIA)? Rprvik et al. state “Bottom water reconstructions in the Malangen fjord clearly reflect a cold period during the LIA and the dinocyst assemblages indicate that the time period from AD1500 to 1940 represents a cool period.” The Norwegian reconstruction shows warming since 1940 (in their zone D in the core); the authors write “The interpretation of the dinocyst assemblages of zone D, is consistent with somewhat less influence from waters outside the basin and is interpreted to represent a period with relatively high surface temperatures.”
There is no evidence presented comparing the current warm period to the Medieval Warm Period. But a message is clear - temperatures in the high latitudes are naturally quite variable, even on timescales of hundreds of years.
We’ll keep our eyes on the situation, but based on these articles, you’d be hard-pressed to conclude that temperatures in these regions as of late have risen above the rather high noise level characterizing natural variation.
References
Kobashi, T., J.P. Severinghaus, J.-M. Barnola, K. Kawamura, T. Carter, and T. Nakaegawa. 2010. Persistent multi-decadal Greenland temperature fluctuation through the last millennium. Climatic Change, 100, 733–756.
Rorvik, K.-L., K. Grosfjeld, and M. Hald. 2009. A late Holocene climate history from Malangen, a north Norwegian Fjord, based on dinocysts. Norwegian Journal of Geology, 89, 135-147.