

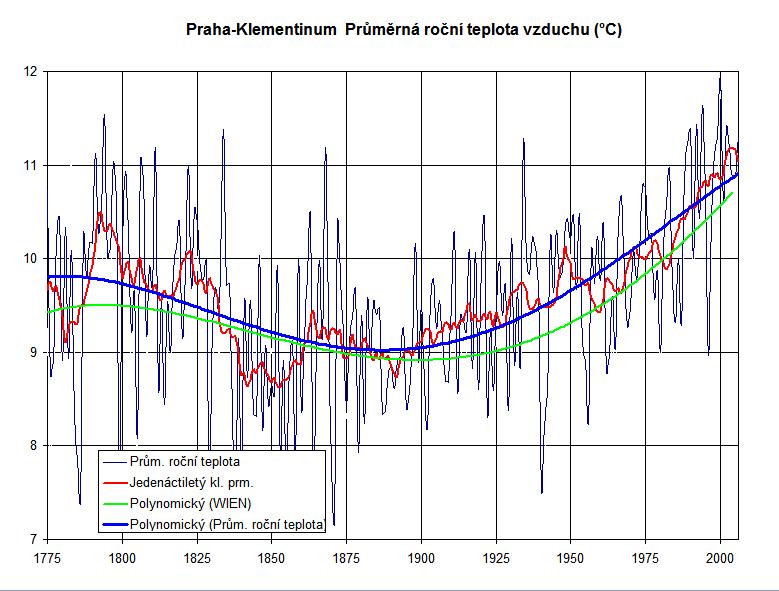
Prague’s Clementinum, an old Jesuit Convent and the current National and University Library near the Charles Bridge (Google Maps), hosts the world’s second oldest continuously working weather station after the Central England dataset (*1659) and, obviously, the oldest one in the Czech Republic. The records go back to 1770 and haven’t been interrupted or modified since 1775.
Today, Clementinum is also the warmest weather station in the Czech Republic, exceeding the annual mean temperature of 10 C, arguably because of urban effects as well as its low elevation of 192 meters. The coldest station in Czechia is on our highest peak Sněžka, elevation 1602 meters, on the Czech-Polish border. Its annual mean temperature is close to the freezing point. The Czech average is around 7 C.
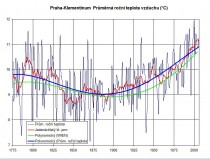
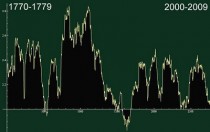
Click here to zoom in with the monthly averages since 1770 which began to be recorded during the reign of Maria Theresa of Austria, queen of Bohemia. The Clementinum temperature was mostly cooling between 1800 and 1900 and mostly warming since 1900, by roughly the same amount.
If you allow me to cherry-pick a bit, the Clementinum’s annual mean temperature in 1794 was 11.50 C but 10.88 C in 2005. The 1848 revolution in Prague. As recently as in 1850, Prague only had 157,000 inhabitants, which includes the (relatively negligible) villages that joined Prague later - much fewer than the 1.2 million population today. Guess how the urban heat effects have changed since 1800. The links above present some evidence that this robust old station which, despite the urban effects, shows that there’s been no statistically significant warming in Prague since 1800 (and at most 0.5 C or so in 200 years, and I haven’t subtracted any corrections for the intensification of Prague’s urban heat island which may be as much as 0.6 C per century and which would probably revert the 200-year trend to a significant cooling!), has been deliberately censored from the GHCN data in some way, without a known scientific reason, and replaced by some gapped and strangely artificially adjusted data from the Prague International Airport (Ruzyně, a Western suburb of the Czech capital).
A lot of seemingly problematic stuff to check.
It’s plausible that the Clementinum data actually show that there’s been no statistically significant warming in all of Central Europe for 200 years.
Warming trends in Prague since 1770
This text is a counterpart of Warming Trends in Central England Since 1659 where I explain the basic issues. The Prague record, the second oldest, is somewhat shorter.
The average temperature between 1770 and 2009 (included) is 9.6 C which is 0.4 C warmer than in Central England, 1659-2009. The standard deviation of the annual mean temperatures from this overall average is 0.98 C which is 50% higher than 0.65 C in Central England where the fluctuations are probably lower because of the relative proximity to the “stabilizing” sea (while Prague has a more continental climate).
When you look e.g. at 20-year warming trends, when the man-made warming should be really fast in the current era, our generation actually drops out of the race. The graph (enlarged here) looks like this:
A 20th century interval only appears on the 8th place in the ranking:
1779-1798, 9.187 C/century
1782-1801, 8.317 C/century
1776-1795, 8.103 C/century
1778-1797, 7.629 C/century
1783-1802, 7.407 C/century
1849-1868, 7.292 C/century
1777-1796, 7.214 C/century
1984-2003, 7.125 C/century
1850-1869, 6.984 C/century
1780-1799, 6.853 C/century
And by the way, even the fastest warming at the end of the 18th century loses when compared to the fastest 20-year cooling in the 19th century:
1821-1840, -10.05 C/century
1822-1841, -9.338 C/century
1823-1842, -8.005 C/century
1824-1843, -7.259 C/century
1819-1838, -7.029 C/century
1825-1844, -6.879 C/century
1820-1839, -6.586 C/century
1831-1850, -6.582 C/century
1826-1845, -6.461 C/century
1830-1849, -6.331 C/century
At any rate, you can’t see any unexceptional behavior in the late 20th century Prague, either. Moreover, it’s likely that if you adjusted the figures for the urban heating, the warming trend would disappear completely or change to a cooling trend.
Is there a global weirding?
An inkspiller at the New York Times has proposed a new replacement for global warming and climate change, namely global weirding. Well, until November 2009, we have seen a lot of it, but of a different type than Thomas Friedman envisioned.
In order to be able to use any weather event as a proof of climate change, which would certainly simplify the life for all the AGW gods and their prophets, he conjectures that the climate variations are increasing. And no doubt, man is to blame. However, already the first step is wrong because there is no increase of the climate variations.
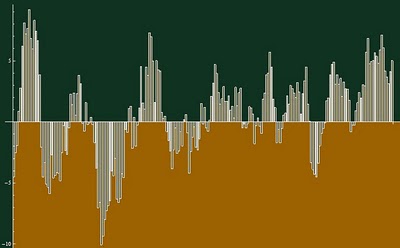
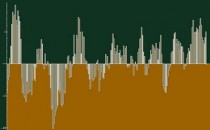
For example, the graph above (enlarged here) shows the “typical” (standard deviation, or “Pythagorean average”, as I call it) month-month variations calculated from the Prague 1770-2009 monthly anomalies (which I first have to calculate), smoothed over 10-year intervals or so (with a truncated Gaussian-like measure, but let me not go into irrelevant details).
You see that there is actually a vaguely decreasing trend in these variations. The minimum variations were sometime in 1905-1915 - it’s the point 1650 (months since the first 10-year period) on the graph above. But the maximum variations occurred around the point 1000 on the x-axis which corresponds to 1865-1875 and similar years (there are two similar peaks over there).
The decrease of the month-on-month temperature variations in the anomalies is pretty large: the maximum is around 2.8 units while the minimum is close to 2.0, which is a 20% decrease - despite the averaging over 100 month-on-month differences or so! The most recent decade is much closer to the minimum (like around 1910) than the maximum. So the temperatures are actually changing somewhat less dramatically these days, which actually can be justified theoretically, too (the pole-tropic differences have decreased, reducing gradients and storminess etc.).
Similar methods to calculate these things actually lead to similar graphs with similarly located maxima and minima (even when I start with the year-on-year jumps, the basic structure looks very similar).
The quantity I drew, being inspired by Mr Friedman, could be interesting to study but global weirding is just not taking place right now. Before Mr Friedman blames SUVs for his global weirding, he should have noticed that only himself, and not the Earth’s climate, has actually been a victim of such a recent global weirding. ![]() See full post here.
See full post here.
By Climate Realists, Piers Corbyn
The feeble defence today (BBC Radio4 here) of the failed science of Man-made climate change by Lord Martin Rees President of the Royal Society is a “dereliction of his duty to defend the integrity of science and a surrender to the politically driven agenda of the UN which is mounting a ‘Custer’s last stand’ review of IPCC procedures in a desperate bid to save its credibility”, said Piers Corbyn astrophysicist and founder of WeatherAction long range weather and climate forecasters.
Piers (speaking on his birthday March 10th) further said: “Martin Rees is a great scientist but his support today of failed science over evidence-based factual observations is a betrayal of the scientific method in favour of anti-scientific dogma. One wonders at what point should political expediency ever over-rule evidence-based science?”
“His defence of the refuted theory of man-made climate change on the grounds that ‘CO2 has been rising recently at an unprecedented rate and very simple physics’ is without foundation.
Firstly the claim that current rates of rise of CO2 are unprecedented is neither relevant nor justifiable. Recognized published peer-reviewed work shows:
(i) measured data over hundreds, or thousands, or millions of years proves CO2 changes have no net driving effect on world temperature or climate, indeed the relationship is observed to be the other way around - for example at the end of ice-ages temperature rises drive CO2 rises with a lag of centuries. This means that current changes of CO2 are also of no consequence. This is demonstrated by world cooling for the last 8 years while CO2 has been rapidly rising.
(ii) ice core data smooths out rapid fluctuations in CO2 levels which occurred in the past and other methods of measuring CO2 in more recent times show rapid changes. The claim of unprecedented rises in something of no consequence is scaremongering nonsense. “Secondly the ‘very simple physics’ he claims to draw on is just too simple and leaves out other pretty simple physics. The supposed large magnifying effect of water vapour which is a more significant contributor to infra-red absorption and emission than the trace gas CO2 has been widely challenged along with other assumptions of the CO2 centred theory. More fundamentally wherever those considerations lead a number of feedback effects totally negate any impact CO2 changes may have on surface temperatures. For example extra CO2 enhances plant growth and photosynthetic transpiration which is a powerful cooling effect and the more CO2 the more the cooling. So any extra surface warming due to extra CO2 in the atmosphere is negated by extra cooling caused by extra photosynthetic transpiration. Warming also enhances plant growth so if at one point there were insufficient plants to do the cooling and therefore warming occurred that would enhance plant growth and extend the growing season until there are sufficient plants to provide cooling to negate any warming.
“Martin Rees and the IPCC should be prepared to defend their CO2-driven climate change position but they have still failed to produce any observational evidence for their hypothesis and the BBC consistently avoids allowing any air time to Climate Realist scientists who can easily refute the CO2 hypothesis. Nevertheless I am glad Martin Ress did not repeat the banal claims of Professor Corine Le Quere of the University of East Anglia that ‘There is no other explanation for it. Perhaps he realizes that our WeatherAction verification of predicted chains of events leading from solar activity to extreme weather events is evidence that the Sun causes ‘it’.
Read this and more here.
UK Telegraph
Snowfalls of up to 50 centimetres (20 inches) were forecast for the worst affected areas of the region of Catalonia, prompting the regional government to cancel classes for more than 142,000 students at 476 public schools.
Power was lost in homes throughout the region, with energy company Fecsa-Endesa reporting 200,000 clients without electricity, mostly in the province of Girona.

services workers helped evacuate some 500 passengers who became trapped on trains traveling between Barcelona and Portbou, on the French border, which became stuck due to the lack of power, said regional interior minister Joan Boada.
Thousands of commuters were left scrambling for an alternative way to get home after the blizzard forced the suspension of bus services in Barcelona and the closure of five suburban train lines in the Mediterranean port city.
Barcelona city hall ordered the metro system to stay open all night to help people move around the city. Traffic on over 60 roads in Catalonia was either prohibited or restricted. Spain’s border with France at La Jonquera was closed because of the snow, leaving some 4,000 trucks stranded, public television TVE reported.
While Barcelona’s El Prat airport was operating normally, 21 flights out of the airport in nearby Girona were cancelled and nine others were diverted to other cities due to the snow and strong winds, airport officials said. See story here.
See here how worst snow on March 8 since 1962/63 brings Barcelona to a complete collapse. Spring is around the corner, yet it was minus 6ºC last night in Madrid. The region of Catalonia had the worst snow storm in 25 years. Barcelona received enough snow to cause a collapse in traffic, and its beaches were covered in the white stuff. It is worse in the rest of the region, which is struggling under up to 60 cm of snow (more in the mountains). Snow tires are unknown in the country, so people struggle to put on chains when they are stranded ( not an easy job, and your fingers freeze quickly while doing it ). Thirty three high tension pylons collapsed under high winds which also caused 7-meter-high waves to crash on the coast. Two hundred thousand homes are still without electricity. Thousands of truck were stuck on the roads, and traffic jams on the motorway to France were 50 km long. Snow in the streets turned into ice, causing multiple accidents, and making sidewalks dangerous to walk on.
This is the third serious white winter Northern Spain had in a row. Further south, in Andalusia, it’s been raining for 3 months, and they hadn’t seen so much water in decades. The countryside is flooded in many parts, and some old houses have collapsed. Locals hadn’t experienced such inundations since the great one of 1963. See more here and here.
See in this story how the snow closed the border between France and Spain. Here is a photo from Elne in southern France.

----------------------
European Storms
By World Climate Report
The winter of 2009-2010 has produced its fair share of winter storms in the Northern Hemisphere - recall that President Obama arrived back in Washington from his appearance at the Copenhagen climate conference only to find the White House grounds buried under near-record amounts of snow. Europe and Asia have seen their share of large winter storms as well during the 2009-2010 winter. Hardly a large storm goes by without someone, somewhere suggesting that whatever we are seeing, it is related to “climate change”. If one looked no further than the Technical Summary of the IPCC, they would discover that the IPCC is rather quiet on this subject with no claims whatsoever that winter storms will increase in frequency, magnitude, duration, or intensity due to the ongoing changes in atmospheric composition.
Two new articles are out that further confirm that global warming has not and will not be causing mid-latitude winter storms to become some new destructive result of the greenhouse effect.
The first is by two scientists from Sweden and Poland, the article appears in the International Journal of Climatology, and the work was funded by the European Community. The title lets us know the authors are dealing with Scandinavian storminess back to 1780; one line in the abstract caught our attention as it says “We find pronounced interdecadal variability in cyclonic activity but no significant overall consistent long-term trend.”
Barring and Fortuniak begin their piece noting that “Long-term variability in extra-tropical cyclone frequency and strength is at the centre of international attention, both because of scientific theoretical analysis of climate change and because of socio-economic consequences of potential changes in storminess activity.” They state that these storms cause severe damage to property and forests and that storm surges associated with intense storms are damaging as well. They quite correctly remind us that “The question is whether changes to such storminess characteristics are a result of changes in frequency and intensity of deep cyclones in exposed regions. The essential problem is thus if any changes to cyclone activity are within natural variability or not, that is, the classical problem of climate change detection. As intense cyclones and severe windstorms are comparatively rare events, long-term records are required to capture the natural variability.”
We completely agree with their assessment - long-term records provide a necessary dimension of historical perspective and can often make any recent trends look very different. Barring and Fortuniak note that “Several studies using reanalysis data covering the second half of the 20th century suggest increasing storm intensity in the northeastern Atlantic and European sector.” So to extend the record back in time, they examined the thrice-daily sea level atmospheric pressure measurements taken in Stockholm and Lund. Their statistical methodology was complicated, but they showed that their method could clearly identify large storms in the past.
The authors present many graphs of storm activity, but the one below is probably the best one for capturing temporal variations in storm activity. The graph shows principal component scores taken from the Lund and Stockholm datasets; the values are standardized with a mean of zero and a standard deviation of one; higher positive values are associated with periods with large storms and large negative values show periods of low storm activity. Imagine if the dataset began in 1950...the upward trend would lack the necessary context and perspective and might seem unusual–which, as the longer perspective shows, it is not.

Figure 1. Time evolution of principal component scores from the Lund and Stockholm datasets (from Barring and Fortuniak, 2009) enlarged here.
Barring and Fortuniak do not waste any words with their conclusions (the Dalton minimum occurred between 1790 and 1830, and was a time of low sunspot activity). They state “(1) There is no significant overall long-term trend common to all indices in cyclone activity in the North Atlantic and European region since the Dalton minimum. (2) The marked positive trend beginning around 1960 ended in the mid-1990s and has since then reversed. This positive trend was more an effect of a 20th century minimum in cyclone activity around 1960, rather than extraordinary high values in 1990s. Both the 1960s minimum and the 1990s maximum were within the long-term variability. (3) Because the period between the 1960s minima and the 1990s maxima spans a substantial part of the period covered by most reanalysis datasets, any analysis relying solely on such data is likely to find trends in cyclone activity and related measures.”
Our next article on the subject was published recently in Quaternary International by scientists with the UK’s University of Nottingham and Loughborough University. Their interest lies with western European coastlines and storms over a variety of timescales. Clarke and Rendell begin stating “There is growing evidence that periods of sand drift and dune development provide proxy records of the impacts of storms in coastal areas”. Furthermore, “An understanding of the patterns of past storminess is particularly important in the context of future anthropogenically driven climate change, with predictions of increased storm frequency and sea level rise by the end of the current century”. Once again, someone is out there suggesting an increase in storms frequency thanks to global warming.
They examine many other studies in their review article, and conclude (LIA is the Little Ice Age) “The analysis of documentary records, discontinuous instrumental data and proxy records indicate that the period of the LIA (AD 1570–1900) included periods of enhanced storminess relative to present. This increased storminess coincided with numerous episodes of sand drift and dune building along the western European coast, as demonstrated by both documentary records and independent dating of sand movement.” Furthermore, Clarke and Rendell found “The Holocene record of sand drift in western Europe includes episodes of movement corresponding to periods of Northern Hemisphere cooling, particularly 8.2 ka, and provides the additional evidence that these periods, like the LIA, were also stormy”
In other words, these articles suggest that it is the cooler periods in Europe that were stormier, not the warmer ones.
References:
Barring, L. and K. Fortuniak. 2009. Multi-indices analysis of southern Scandinavian storminess 1780–2005 and links to interdecadal variations in the NW Europe - North Sea region. International Journal of Climatology, 29, 373-384.
Clarke, M.L. and H.M. Rendell. 2009. The impact of North Atlantic storminess on western European coasts: A review. Quaternary International, 195, 31-41.