

By Jennifer A. Dlouhy, Houston Chronicle Washington Bureau
Republican and Democratic senators negotiating a possible compromise on climate change legislation insisted Tuesday that the measure must include provisions to boost nuclear power and expand offshore drilling.
Sen. Lindsey Graham, R-S.C., who has been huddling with Sen. Joseph Lieberman, I-Conn., and other moderates on the issue, said linking nuclear power and offshore drilling with a cap-and-trade plan for limiting carbon dioxide emissions is “the winning formula” to pushing the measure through the Senate.
The leading climate change bill in the Senate, sponsored by Sens. John Kerry, D-Mass., and Barbara Boxer, D-Calif., gives scant attention to nuclear power and is silent on offshore drilling.
The Kerry-Boxer bill would force owners of oil refineries and power plants and others to comply with progressively tighter limits on greenhouse gas emissions. Polluters could stay within the limits by buying and trading an increasingly smaller pool of permits to release the emissions blamed for climate change.
See plan as energy tax
Many congressional Republicans have decried such a cap-and-trade program as an energy tax that would raise bills for heating homes and powering factories.
Graham said “more than a handful” of Senate Republicans could be persuaded to support a climate change bill if it includes “a robust nuclear power component” and provisions to expand “offshore drilling in a responsible manner.”
“To get a bipartisan bill on climate change, you’re going to have to make it attractive for Republicans to vote for a cap-and-trade system,” Graham said.
“There’s a way to grow Republican support but it is a give-and-take. Republicans have to give in the area of recognizing that climate change is real and a cap-and-trade system is part of the solution. I’d ask our Democratic colleagues to give on the idea that you can’t be serious about climate change solutions if you exclude nuclear power.”
Kerry has been in talks with Graham and other Senate moderates over possible compromises.
The current Kerry-Boxer bill includes a modest nuclear section focused mainly on worker training. But nuclear advocates want to see the measure include loan guarantees to propel new plants - the last one was built in 1990 - and solutions for one of the biggest issues confounding the industry: how to store spent fuel rods.
The measure ultimately could be combined with a broad energy bill sponsored by Sen. Jeff Bingaman, D-N.M., that would expand oil and gas drilling in the Gulf of Mexico, modernize the nation’s electric grid and boost U.S. reliance on renewable power sources.
Effort by ‘Gang of 20’
Graham said an offshore drilling plan for the climate bill could be modeled after ideas advanced by Carper, Graham, Klobuchar and other members of a self-titled “Gang of 20” senators.
Last year, the group pushed a plan to open up part of the eastern Gulf of Mexico for new oil and gas exploration and give Georgia, South Carolina, North Carolina and Virginia the option to allow drilling off their shores.
The Kerry-Boxer climate change bill left out details on some major components of a cap-and-trade system, leaving room for as many as six Senate committees to assemble a package that the chamber could debate next year.
Senators will be looking to fill in gaps on how to allocate emissions allowances and whether to include trade protections for U.S. manufacturers if China and other countries don’t impose similar greenhouse gas curbs.
Some lawmakers also are likely to push for tough regulation of the new carbon allowances market, as well as trading in carbon “offsets,” or investments in climate-friendly projects such as reforesting.
A House-passed bill would give two agencies - the Commodities Futures Trading Commission and the Federal Energy Regulatory Commission - the power to oversee the new markets. But the Kerry-Boxer bill puts the regulation in the hands of just the CFTC.
Gary Gensler, the CFTC chairman, on Tuesday told the Platts Energy Podium that the agency was well positioned to regulate any new carbon markets created by Congress. “Our agency has the expertise to oversee these centralized markets,” he said.
Read more here.
By Marc Sheppard, American Thinker
For years, claims that UN climate reports represent the consensus of the majority of international scientists have been mindlessly accepted and regurgitated by left-leaning policy makers and the media at large. But in the past week or so, it’s become more apparent than ever that those who’ve accused the international organization of politicizing science and manipulating data have been right all along.
This latest disclosure again concerns what has become the favorite propaganda propagation tool of climate activists—the infamous “Hockey Stick Graph.” The familiar reconstruction, which deceitfully depicts last millennium’s global temperatures as flat prior to a dramatic upturn last century, has been displayed and touted ad nauseum as irrefutable proof of unprecedented and, therefore, anthropogenic, global warming (AGW).
Despite its previous debunking, the embattled AGW poster-child continues to languish in UN climate reports, which are unduly revered and quoted as gospel by all manner of proselytizers. In fact, just last week it had the bad timing to show up in a desperate UN compendium, released just days before Climate Audit published facts that promise to be the Hockey Stick’s (HS) long overdue epitaph. And those facts not only assuage any doubt of the chart’s fraudulence, but also of the deliberate and devious complicity of its creators, defenders and leading UN sponsors.
But before delving into the sordid details, perhaps a little background is in order.
The Real Inconvenient Truth
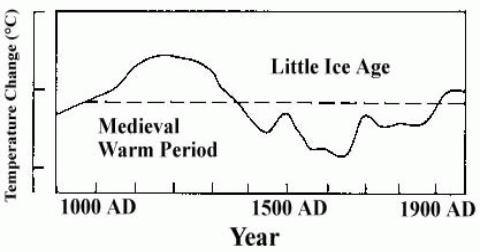
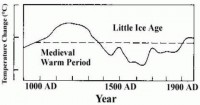
Prior to the 2001 Intergovernmental Panel on Climate Change (IPCC) Third Assessment Report (TAR), the accepted depiction of the prior millennium’s warmth was that published in the panel’s 1990 maiden assessment. Specifically—global temperatures had fluctuated drastically over the period. This schematic, taken from IPCC 1990 Figure 7c, clearly demonstrates the IPCC “consensus” of the time:
And data derived from sources including tree-rings, lake sediments, ice cores and historic documents bear that position out. Indeed, it’s abundantly evident that since the last glacial period ended, over 14,000 years ago, the Earth’s climate has undergone multi-century swings from warming to cooling that occur often and with remarkable rapidity. And not one but three such radical shifts occurred within the past millennium.
The years 900-1300 AD have been labeled the Medieval Warming Period (MWP), as global temperatures rose precipitously from the bitter cold of the previous epoch—the Dark Ages—to levels several degrees warmer than today. A sudden period of cooling then followed and lasted until the year 1850. This Little Ice Age (LIA) brought on extremely cold temperatures, corresponding with three periods of protracted solar inactivity, the lowest temperatures coinciding with the quietest of the three (The Maunder Minimum 1645-1710).
And then began the modern warming period, which, by the way, many scientists believe ended with the millennium itself. Given these natural shifts over the past 1000 years, it’s certainly not surprising that after a period of cooling, which followed a period of warming, we’d again enter a period of warming.
And that, of course, presented quite the quandary to opportunists hell-bent on blaming warming on industrial revolution-triggered atmospheric CO2 increases. Something had to be done to convince the world that modern warming was unprecedented and could therefore only be explained by something unnatural, specifically—the “Greenhouse Effect.” And something was.
The End of a Warming Era
During testimony before the Senate Committee on Environment & Public Works Hearing on Climate Change and the Media in 2006, University of Oklahoma geophysicist Dr. David Deming recalled “an astonishing email from a major researcher in the area of climate change” who told him that “we have to get rid of the Medieval Warm Period.” In June of this year, piece, Deming identified the year of that email as 1995 and the source only as a lead author of that month’s Global Climate Change Impacts in the United States report.
Many believe that man to be Jonathan Overpeck - which Prof. Deming didn’t deny in an email response—who would later also serve as an IPCC lead author. So it comes as no surprise that this reconstruction, which did indeed “get rid of the Medieval Warm Period,” was featured prominently in the subsequent 2001 TAR, particularly in the Summary for Policymakers (SPM), the highly-politicized synopsis which commands the bulk of media and political attention.

This, the original and by far most ubiquitous version of the HS graph, was derived from a 1998 paper by Michael E. Mann, Raymond S. Bradley and Malcolm K. Hughes (MBH98). It was promptly met with challenges to both its proxy data and statistical analysis methodology. Of these, various papers by two Canadians—statistician Stephen McIntyre and economist Ross McKitrick—stood out in dispelling the AGW-supporting hockey-stick shape arrived at by MBH, claiming it the result of severe data defects and flawed calculations, particularly an invalid principal component analysis.
In a coordinated effort to defend the refuted thesis, alarmed alarmists tendered a handful of supporting studies. Mann himself cheered those either attacking McIntyre and McKitrick or supporting his own reconstruction and dubbed them the “Hockey Team.” And the position of team forward and co-captain was bestowed upon Keith Briffa of Britain’s Climatic Research Unit (CRU), whose temperature graphs, derived from Yamal, Russia tree ring data were heavily cited by the IPCC as supporting evidence of MBH’s assertion of unprecedented 20th century warming.
While studies reaffirming both the MWP and LIA continued to be published, congressional hearings and expert panels found MBH to be largely unsupported by studies relying on legitimate proxy data other than Briffa’s. Still, most alarmists continued (and continue) to defend the HS on principle.
Which in no way dilutes this plain truth: By the time most Americans received their first lesson in climate hysteria in the Albert Gore lecture hall that was the 2006 film An Inconvenient Truth, the MBH chart the nutty professor stood before and offered as proof of impending doom was already held in disrepute by most serious persons of science.
Lest there be any doubt, why else would the 2007 Fourth Assessment Report (AR4)—notwithstanding the appointments of both Briffa and Overpeck as lead authors - give the graph short mention and exclude it entirely from the SPM? It appeared the Hockey Team was being sent back to the minors.
That is—for the moment.
Desperate Times Call For Disparate Actions
Given the current economic and political climate, it’s not surprising that the globe’s climate ranks dead last when Americans are asked to name the “most important issue facing the country right now.” Needless to say, that’s an uncomfortable position for the Greenhouse Gas Team, what with a Senate Climate Bill promising even more government control than its House counterpart at the plate and the December Copenhagen Climate Summit on deck.
Accordingly, on September 24th, in a transparently desperate effort to stoke the coals, the United Nations Environment Programme (UNEP) released its Climate Change Science Compendium 2009. The eco-plea opens with these words from UN Secretary-General Ban Ki-moon: “The science has become more irrevocable than ever: Climate change is happening. The evidence is all around us. And unless we act, we will see catastrophic consequences including rising sea-levels, droughts and famine, and the loss of up to a third of the world’s plant and animal species.”
Amazing. But the frantic hype of this call-to-pointless-action quickly segues to blatant lies just three sentences later when Ban states “that climate change is accelerating at a much faster pace than was previously thought by scientists.” It would appear the Sec-Gen believes that the cooling temperatures the new millennium issued in have somehow escaped everyone’s notice. Imagine the uphill battle he’ll face should predictions of the U.S. Northeast suffering its coldest winter in a decade due to a weak El Nino come true.
So it wasn’t all that shocking to spot this undeniably dramatic graph on only the fifth of this end-is-near report’s 75 pages.
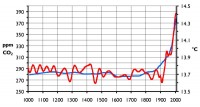
The striking chart is marked as Figure 1.3: Correlation between temperature and CO2. As its title suggests, it attempts to plot atmospheric CO2 concentrations and mean global temperature during the past millennium. Notice anything vaguely familiar about the temperature plot in red?
Ehy, it’s our old friend, Mr. Hockey Stick – apparently having sat for a bit of a makeover. Interestingly enough, this reconstruction wasn’t lifted from prior IPCC assessments, or, for that matter, any UN entity at all. No, the source was actually a graphic posted to Wikimedia in 2005 by Hanno Sandvik, a Norwegian research biologist. Sandvik cited two data sources for his temperature plot – a 2004 paper by Jones and Mann (abracadabra - no more MWP) for 1000-1880, and, for the remainder, “instrumental records published on the web” by Jones, Parker, Osborn and - wait for it...Briffa.
So the chart the UN climate experts used to sell the CO2 - temperature connection to an increasingly skeptical public was pulled from Wiki, crafted by an unknown biologist, conveniently ends about the same year warming ended, and based on a debunked temperature reconstruction. It would therefore appear they consider Sanvik quite the unsung authority. Yet I wonder whether these geniuses are aware of this 2006 graphic, also from Sandvik, and plotting northern hemisphere temperatures over the past 2000 years. This one cites 2005 data published by Moberg, Sonechkin, Holmgren, Datsenko, Karlen, and Lauritzen as its source and paints a somewhat different picture. Hello MWP and LIA, where’ve you been?
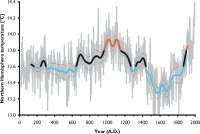
Any guesses whether or not UNEP would have used Sandvik’s chart had his temperature dataset been from Moberg et al. rather than Mann et al.? I contacted Hanno Sandvik a week ago last Saturday and asked him essentially that same question. He responded that he was unaware of the UNEP Compendium and therefore had “no idea which graphics they may have chosen.” He also pointed out that while Mann’s was global data, Mobergs was northern hemisphere only—a point well taken, however MHB98 was also derived from NH data yet remarkably resembles the Mann “global” data Sandvik used.
Also—Take a look at the period between 1000 and 1800 in both reconstructions. Is it even the least bit feasible that averaging southern hemisphere data into the latter would produce the former? Or that UNEP strived to present the facts honestly?
Read much more including more on the Mann-made global warming here. See also the follow up story on how the UN quietly removed the graph from the report.
By Roger Pielke Sr., Climate Science
I have been very critical of Tom Karl, Director of the National Climate Data Center and currently President of the American Meteorological Society, in his failure to provide a balanced assessment of climate issues despite his leadership roles in climate analyses (e. g. see and see). He (sincerely I believe) assumes he is representing the science without any lack of bias, but the reality is quite different. As I documented, for instance, in
Pielke Sr., Roger A., 2005: Public Comment on CCSP Report ”Temperature Trends in the Lower Atmosphere: Steps for Understanding and Reconciling Differences”. 88 pp including appendices.
He is judging the merits of the same research results in which he supervises and has published on. There cannot be a clearer conflict of interest.
There is now another new example of his misuse of his leadership position. I have reproduced below (and thanks to Joe D’Aleo for sharing it with us) a media presentation that he is leading. He certainly can chose to be an advocate and lobbyist for a particular perspective on climate, but for him to fail to communicate this bias, as well as prevent the presentation of other viewpoints, should be widely recognized.
AMS Communication
From: Kelly G. Savoie
To: ksavoie@ametsoc.org
Sent: Friday, October 02, 2009 9:06 AM
Subject: AMS Item of Interest
Dear CBM/Sealholder:
Following is an item you may find of interest.
* Extreme Weather and Global Warming in the Southwest U.S.
Media Advisory
Climate Science Briefing for Broadcast Meteorologists:
Extreme Weather and Global Warming in the Southwest U.S.
A teleconference for Southwestern broadcast meteorologists featuring authors of the U.S. Global Change Research Program’s latest scientific assessment report, “Global Climate Change Impacts in the United States,” will be held on Tuesday, Oct. 6, 2009. The report, which identifies the consensus climate science conducted by academic researchers, U.S. agencies, and international bodies, is the first of its kind to detail the impacts of global warming on extreme weather by region in the United States.
The discussion will be moderated by Dr. Thomas Karl, president of the American Meteorological Society and co-chair of “Global Climate Change Impacts in the United States.” Speakers will focus on the latest authoritative research about how climate change is affecting weather extremes in the Southwestern U.S. - heat waves, wildfires, drought and other water issues - and in turn the impacts on human health and quality of life.
When: Tuesday, Oct. 6, 2009, 1 p.m. PDT/2 p.m. MDT
Teleconference number: 1-800-290-9461, Passcode 23821
Panelists:
Dr. Thomas Karl, Director of the U.S. National Oceanic and Atmospheric Administration’s National Climatic Data Center and President of AMS
Dr. Bradley Udall, director of the Western Water Assessment, a joint effort of the University of Colorado and NOAA
Mike Nelson, Chief Meteorologist at KMGH-TV, Denver; author of “The Colorado Weather Almanac”
For more information please visit the GCRP’s web site.
Supplemental materials to the call and a web-based guide to government reports for broadcast meteorologists are available here. This site includes links to full scientific reports and regional fact sheet summaries, as well as information about this teleconference and past science briefings. Funding for the briefing and web site is provided by the William and Flora Hewlett Foundation, the Rockefeller Brothers Fund and the Mertz Gilmore Foundation. The teleconference and web site are a service of Resource Media, a 501 (c) 3 nonprofit organization.
Please note: for meteorologists unable to call in to the teleconference, a recording and transcript will be posted here shortly after the call.
Follow weather and climate issues on Twitter at or on Facebook through the “Global Warming Climate Change Report” Group.
Contact:
Kim Curtis, Resource Media, 415-397-5000 ext. 305
Jillian Ward, Resource Media, 415-397-5000 ext. 309; 415-609-8500
See Roger’s Post and new site here.