

Steven Reviczky
State of Connecticut Department of Agriculture
165 Capital Avenue
Hartford, CT 06106
Art Horn, Meteorologist
185 Pine street # 308
Manchester, CT 06040
Saturday 8/3/13
Mr. Reviczky,
I am a meteorologist and climate researcher with 37 years of experience in the field. For twenty five of those years I worked as a television meteorologist with 13 of those years being at NBC30 in west Hartford.
One of the reasons we teach people about history is to give them ability to place current events into their proper context. The same can be said about weather history. Those who do not know the history of weather do not know how to place current events such as hurricanes, tornadoes, snowstorms, floods, droughts, heat waves, cold waves and all other types of weather phenomena into their proper context. If one does not know weather history than that person might think that all “unusual” weather is new and unprecedented.
In a July 30th, 2013 Associated Press story titled “Connecticut warns of dire climate change consequences” you were quoted as saying “You can see what’s happening”. You went on to say “The intensity of storms is pretty significant. The damage has been equally significant.” I would agree with both of those statements but I believe what you were trying to convey was that storms are becoming more severe and more frequent in Connecticut than in the past. I could be wrong.
Connecticut has experienced four tornadoes this summer. This is not unprecedented or unusual. Outbreaks of three or more tornadoes on a single day occurred in 1786, 1787, 1878, 1973, 1989, 1998 and 2001. In 1973 there were 8 tornadoes on 6 different days.
Connecticut averages about one tornado a year so they are not unknown or unusual here. In addition, our ability to detect tornadoes is significantly better than in the past. There has been no increase in the number of tornadoes nationally nor here in Connecticut. The long term trend in strong to violent tornadoes nationally is actually down since the 1970s.
The Associated Press story was written by Stephen Singer who wrote that Connecticut was struck by Tropical Storm Irene in August of 2011, a “freak” snow storm in late October of that year and “Super Storm” Sandy in late October of 2012. I believe he was trying to imply that there was something strange and unusual about these storms. He does not know weather history. Tropical Storm Irene was not a major storm by any measure used to evaluate these storms. It was a Tropical Storm with sustained winds below low lowest category of Hurricanes, a category one. It struck at the new moon high tide in some portions of Southern New England accentuating the storm surge in coastal areas. Connecticut had not been hit directly by a Tropical Storm or Hurricane since Hurricane Gloria in 1985 so we were inexperienced and vulnerable to the effects of a storm with Tropical Storm force winds when the trees were in leaf.
The snow storm of late October was unusual but not unprecedented. A snowstorm struck the Northeastern United States on October the 4th, 1987, nearly a month earlier. That storm dumped 9 to 20 inches of snow across portions of Connecticut, Massachusetts, New York State and Vermont. Other notable October snow storms occurred on October 6th, 1836 and October 10th, 1925. A Tropical Storm combined with cold air produced large amounts of snow across interior Connecticut on October the 9th, 1804. These storms were all weeks earlier than what took place in 2011.
Hurricane Sandy was not a “Super Storm”. This label was assigned by the news media. Those who called Sandy a Super Storm did so because they liked the sound of “Super Storm.” Having worked in television news rooms for 25 years I am well acquainted with these exaggerations. The term “Super Storm Sandy” sounds much more dramatic than “Sandy is a category one Hurricane on a scale of one to five” which is what it was. Sandy had a wide circulation of Tropical Storm force winds of 39 to 73 miles per hour, partially due to a large high pressure area to the northeast of the storm and partially because it was being absorbed by a mid-latitude jet stream. Actually there were no sustained Hurricane force winds anywhere on the east coast of the United States from Sandy. The angle at which Sandy hit the coast at the full moon high tide in areas that had not been hit by a tropical storm in many years were three significant factors in causing so much damage not to mention building structures right up to the waters edge.
A true “Super Storm” did strike Connecticut seventy five years ago. The New England Hurricane of September 21st, 1938 was far, far worse than Sandy. This was a category three Hurricane traveling at sixty miles per hour. There are no wind measurements from the storm in Connecticut even though there was a sufficient network of anemometers across the state. The 1938 hurricane blew them all away when the winds reach 100 miles per hour. Estimates from barometer readings and computer simulations indicate this storm had maximum sustained winds of 120 miles per hour with gusts as high as 160, a true Super Storm. Atmospheric carbon dioxide levels were around 310 parts per million at the time of the 1938 storm. Today carbon dioxide levels are up to 400 parts per million. The amount of carbon dioxide in the air in 1938 had nothing to do with that Hurricane and the amount of carbon dioxide in the air today had nothing to do with Hurricane Sandy. Somehow reducing the amount of carbon dioxide in the air to 1938 levels would not have prevented Hurricane Sandy.
The frequency and intensity of Hurricanes in the North Atlantic is principally determined by the long term cycle of the Pacific Decadal Oscillation, the short term occurrence of El Nino and La Nina and the Atlantic Multi-Decadal Oscillation. It has nothing to do with how much carbon dioxide is in the air, it never has and never will. The idea that we can control bad weather by reducing the amount of carbon dioxide in the air is fantasy gone very wrong. Years from now people will look back on this era and say thing like “They actually thought they could control the weather and climate.”
As a percentage of the atmosphere, carbon dioxide has increased a total of 0.01% since 1850. History is full of terrible storms when carbon dioxide levels were much lower than today. Ice core temperature reconstructions from Greenland clearly show us that weather is much more extreme when the earth is colder, not warmer. It is the temperature contrast between the poles and the equator that makes weather. The bigger the temperature difference between the poles and the equator, the more extreme the weather is. The ice core data proves this beyond a shadow of a doubt. A warmer world would have less temperature contrast and therefore less extreme weather. The global warming crowd has it backwards. It’s advocacy not science.
When confronted by these facts many people have no ability to reply so they point to authority institutions such as NOAA, NCAR, NCDC, NASA, The National Science Foundation, The National Academy of Science, American Physical Society, The American Meteorological Society and many other government and academic institutions and societies. All of these organizations have issued proclamations that man made global warming is real and is caused by burning fossil fuels. Based on their unanimity we are therefore supposed to believe they are correct. Some people believe that large institutions are exempt from making mistakes. As an example, in 2006 NASA predicted sunspot cycle 24, the current cycle we’re in now, would be the strongest in 300 years. The reality is that it will be the weakest in 100 years. They could not have been more wrong.
The truth is that we really don’t know what these government agencies and other organizations and institutions think of global warming. The department heads of government agencies and the boards of directors of academic institutions and societies may claim that their respective organizations support the man made global warming theory. The problem is that they never asked the people who actually make up these government agencies or institutions what they think. For all I know 75% of all NASA employees may not believe in man made global warming, but nobody knows because nobody asked them. Just as President Obama does not speak for me and at least 57 million other Americans, The department heads and leaders of government agencies and other large institutions don’t necessarily speak for their membership.
I know this is long winded but I believe this subject is so important to the future of America that we need to address this issue seriously and objectively, especially due to it’s critical impact on our energy future and therefore our prosperity.
Art Horn, Meteorologist AMS TV Seal #199
--------
Will History Repeat Itself?
On January 13, 1920, the New York Times ridiculed the ideas of Robert H. Goddard. Goddard, a physicist and pioneer in the field of rocketry, was at the time sponsored by the Smithsonian. Nonetheless, the Gray Lady argued in an editorial that thinking that any sort of rocket could ever work in the vacuum of space is essentially foolishness and a blatant disregard for a high school understanding of physics. The editors even went into reasonable detail in order to debunk Goddard.
Luckily, the Times was willing to print a correction. The only hitch: They printed it the day after Apollo 11’s launch in 1969. Three days before humans first walked on the moon, they recanted their editorial with this bit of understatement:
“Further investigation and experimentation have confirmed the findings of Isaac Newton in the 17th century and it is not definitely established that a rocket can function in a vacuum as well as in an atmosphere. The Times regrets the error.”
Update:
Santa Cruz, California Sea Level Drops To Its Lowest Level In The Satellite Era
Posted on August 4, 2013 by Steven Goddard
Last year, Heidi’s geniuses predicted that California sea level would rise at least six inches by 2030.
April 20, 2012
In the 20th century, the sea level rose on average 8 inches along California’s coastline, research by Climate Central and others shows.
Middle-of-the-road expectations are that it will rise 6 to 8 more inches by 2030, 12 inches by 2050 and 24 inches by 2070.
By 2100, it could be 3 to 5 feet higher, said Gary Griggs, director of the Institute of Marine Sciences at UC Santa Cruz.
As Earth Day nears, Calif. worries about rising sea levels | The Republic
Since these expert forecasts were made, University of Colorado satellite data shows sea level at Santa Cruz dropping to its lowest level on record.
-------
Geologist Dr. Don Easterbrook debunks new warmist study claiming 1,700 U.S. cities will be below sea level by 2100 - Easterbrook: ‘The rate used by [Lead Author] Strauss for his predictions is more than 10 times the rate over the past century!’ Strauss’s work is another example of fear journalism practiced by the alarmists at Climate Central/and sadly TWC/WSI.
Easterbrook: “The accelerated rise is based on postulated accelerated warming but there has been no warming in the past 15 years and, in fact, the climate has cooled during that time. So no climatic warming means no accelerated sea level rise as postulated by Strauss...the huge rise of sea level rates proposed by Strauss are absurd and that the maximum sea level rise by 2100 will be less than one foot!”
Also see this paper where they conclude: Our analyses do not indicate acceleration in sea level in U.S. tide gauge records during the 20th century. Instead, for each time period we consider, the records show small decelerations that are consistent with a number of earlier studies of worldwide-gauge records. The decelerations that we obtain are opposite in sign and one to two orders of magnitude less than the+0.07 to +0.28 mm/y2 accelerations that are required to reach sea levels predicted for 2100 by Vermeer and Rahmsdorf (2009), Jevrejeva, Moore, and Grinsted (2010), and Grinsted, Moore, and Jevrejeva (2010).
See also Dr. Willie Soon on sea level experiments:
--------
By Alan Caruba
New York Congressman Jerrold Nadler (D) and forty members of Congress believe the sea levels are rising, that a panel should be created to determine what should be done, and, of course, to throw billions of dollars at a problem that does not exist. Politicians were eager to scare the public with the discredited global warming hoax and now they have found a new one.
In New York City, Mayor Bloomberg has proposed a $20 billion flood barrier system to protect the city from future hurricanes and rising sea levels. Well, hurricanes like tropical storm Sandy are real, but rare. Rising sea levels, however, represent no threat at all.
William Happer who researched ocean physics for the U.S. Air Force and is currently a physics professor at Princeton University notes that “The sea level has been rising since 1800, at the end of the ‘little ice age’”, a cooling cycle last from around 1300 to 1850. Far from heating up, the Earth entered a new cooling cycle around 1996 or so.
Harrison Schmitt, a former Apollo 17 astronaut, U.S. Senator, and a geologist, says “Predicting a sea level rise of seven feet over the next few thousand years would see too risky a prediction on which to spend tax dollars” and that is surely an understatement. Wasting billons on “climate change”, however, is the new siren call of the Obama administration, but the National Research Council is warning, as Fox News reported, “that those kinds of subsidies are virtually useless at quelling greenhouse gases.”
In fact, as the amount of carbon dioxide, the leading greenhouse gas - alleged to “trap” heat - has risen and has had zero effect on the cooling cycle.
A recent article in the British newspaper, The Register, reported on a study by scientists in Germany, the Netherlands, and the United Kingdom, that was published in “Nature Geoscience” that concluded there was no “scientific consensus” to suggest the rate of the seas’ rise will accelerate dangerously.
The notion of the seas rising, swamping coastal cities, and creating havoc is the stuff of science fiction, not science. This is why spending millions or billions on the assertions of some who have a real stake in keeping the public frightened is a very bad idea.
At the center of the global warming scare campaign is the United Nations Intergovernmental Panel on Climate Change (IPCC). Its most recent report said that “no long-term acceleration of sea level has been identified using 20th-century data alone” but that does not discourage the IPCC from forecasting an increase due to global warming. This organization should be disbanded and, if I were in charge, many of its leaders would be in jail right now for fraud.
Who can you believe? One such person is Dr. Nils-Axel Morner, the former chair of the Paleogeophysics and Geodynamics department at Stockholm University in Sweden. He is the past president (1999-2003) of the International Union for Quaternary Research Commission on Sea Level Changes and Coastal Evolution. He has been studying sea level and its effects on coastal areas for more than 35 years. I cited his credentials because others making predictions lack the same level of authority.
Dr. Morner acknowledges that “sea level was indeed rising from, let us say, 1850 to 1930-40. And that rise had a rate in the order of 1 millimeter per year. (Emphasis added). Get out your pocket ruler and look at what one millimeter represents. It is small. It is very small. Not surprisingly Dr. Morner is very critical of the IPCC and its headline-grabbing doomsday predictions. He scorns the IPCC’s claim to “know” that facts about sea level rise, noting that real scientists “are searching for the answer” by continuing to collect data “because we are field geologists; they are computer scientists. So all this talk that sea level is rising, this stems from the computer modeling, not from observations. The observations don’t find it!”
A recent paper reviewed by CO2 Science finds that sea levels have risen from 2002-2011 at a rate of only 1.7 millimeters per year over the past 110 years, the equivalent of 6.7 inches per century. This is close to Dr. Morner’s assertion that, at most, there has been a rate of increase that tops out at 1.1 millimeter per year. The review concluded that there is no evidence of any human influence on sea levels.
Even so, in early July a scientist at the NASA Jet Propulsion Laboratory, Josh Willis, told Fox News, that “There is no question that the time to prepare for sea level rise is now...We will definitely see seven feet of sea level rise- the only question is when.” And who funds NASA?
Between the scientists trying to gin up more government money for their agencies and departments and the politicians trying to find a new reason to spend more money, the public is left wondering if the oceans are rising and whether that represents something worth worrying about. The answer is (a) yes, sea levels are rising in infinitesimal amounts and (b) no, we need to stop spending money based on such claims.
It’s not the sea level rise you should worry about. It is the rising levels of national debt and the deficit.
Dismantling the EPA’s extremist views regarding CO2, Patriot Post.
By Joe Bastardi · July 16, 2013
The systematic assault on economical energy sources and the economy by the EPA was given de facto approval, if not encouragement by President Obama in his speech two weeks ago on the environment. As his words sunk in it became apparent that he seeks to isolate and demonize those who wish to confront him on this matter with facts, and by doing so, destroy opposition to a policy that his EPA has enacted based on easily disproven assumptions. Give the fact that poverty rates continue to rise in our nation under his watch and that the true workforce continues to drop, he seems dangerously out of touch with the facts. Yet he accuses others of such behavior either out of ignorance, arrogance, or both. His EPA has been ruling by decree based on ideas that ignore facts and disregard the harm they are doing to the nation.
There are three lines of evidence the EPA uses to back their environmental policies.
(1) Greenhouse Gas Trapping Hot Spot Theory.
(2) The so-called unusual rise in GAST (Globally Averaged Surface Temperatures).
(3) Assumed validity of climate models, used for policy analysis purposes. (See, for example, SOUTHEASTERN LEGAL FOUNDATION, INC., ET AL., Petitioners, v. ENVIRONMENTAL PROTECTION AGENCY, ET AL. Nos. 12-1268, 12-1269, 12-1272.)
One at a time, let’s show why they don’t have a leg to stand on.
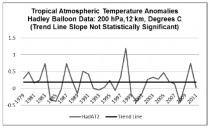
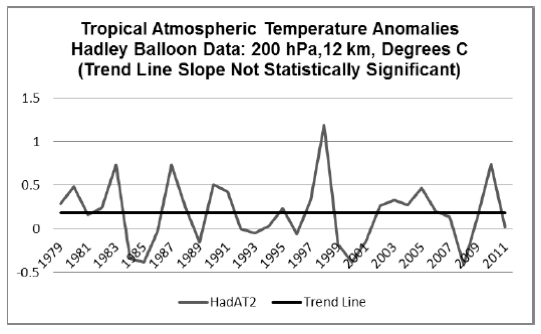
Greenhouse Gas Trapping Hot Spot
There is none. In fact, temperature trends in the middle and upper troposphere are flat. For example, a look at the 200 mb level from the Hadley Center Balloon Data shows no rise at all.
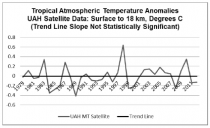
The entire layer—the surface to 18km—shows no rise.
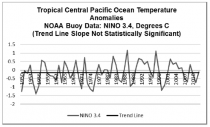
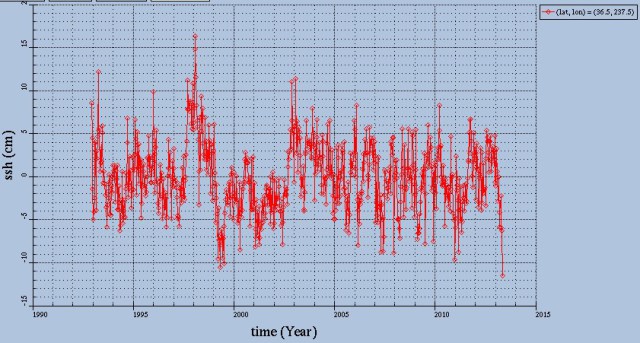
The figure bellow shows the Tropical Central Pacific Temperatures. Similarly, it shows no statistically significant slope. There is simply no evidence of EPA’s assumed Tropical Hot Spot.
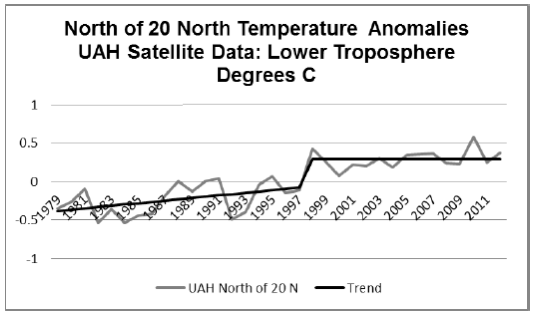
Unusual rise in GAST
Their second line of evidence of a catastrophic rise in Globally Averaged Surface Temperatures (GAST) in the last 50 years due to CO2 concentrations is easily debunked when one looks at reality.
First of all, there has been a lot of fudging of data since the satellite era started—not with the objective satellite data, but the pre-satellite era where researches have adjusted temperatures down. What is most egregious is the estimation of Arctic temperatures which could not be reliably measured in a widespread fashion without the use of satellites prior to 1978. So right off the bat, there are questions about the “fox guarding the henhouse” with data manipulation. But even taking that into account, the fact is that the link between CO2 and temperatures disappeared once the cyclical warming of the oceans—a natural occurrence—was accounted for in the atmosphere. A temperature leveling and turnaround has begun (the leveling has been occurring over the last 17 years). But let’s look at this so-called “catastrophic” warming. (Amazing how mankind is now living in the most advanced age with more people supported on the planet, in large part due to the freedoms fossil fuels have supported.)
The warming linked to the earth coming out of the cold cycle of the Pacific can clearly be seen below, followed by the leveling off.

The disconnect with CO2 can be seen here:

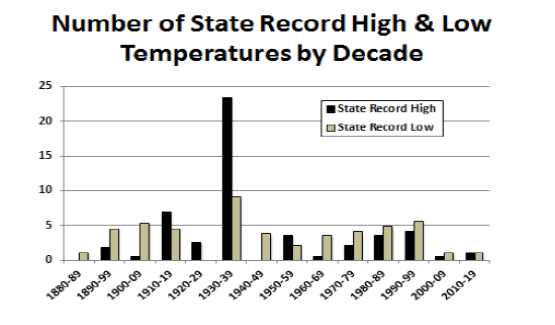
But is the warming over the entire period as unusual as the EPA claims?
The 1930s still stick out far and away as the decade with the most current high temperature records. The following graph depicts state records by decade.
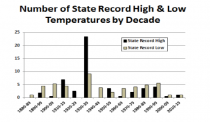
There is simply no justification for the idea that CO2 is driving a catastrophic warmup. Quite the contrary, man has never been more prosperous on a whole, or produced so much as during the current age we are living in.
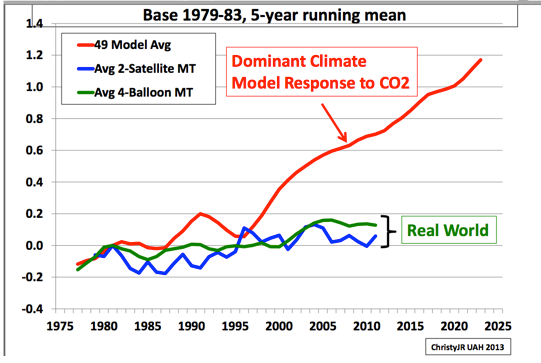
Assumed validity of climate models
This is almost laughable. Anyone who works in the field every day—as we do in the private sector—knows how bad models can be. In fact, in spite of the heat wave in the Northeast and Midwest this week, the coming cool—combined with the coolness of the summer overall which was not predicted in many circles before the summer—is saving this country billions of dollars in energy and agriculture costs (a record corn crop is likely). This was not the pre-summer missive from the modeling (my company Weatherbell.com predicted a cooler summer than the previous three, saying that the Midwest could turn into the Garden of Eden agriculture-wise this year rather than a drought driven heat wave as was opined by some). But the point is that the models are a mathematical representation of a chaotic field and I can not even fathom that this could be one of their reasons. It shows the ignorance as to the nature of the climate. It also shows the willingness of those that truly don’t understand weather and climate to place trust in a model. It’s flabbergasting.
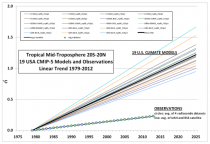
One picture destroys the whole premise. Dr. John Christy, who testified before congress on this matter, has put this graph together:

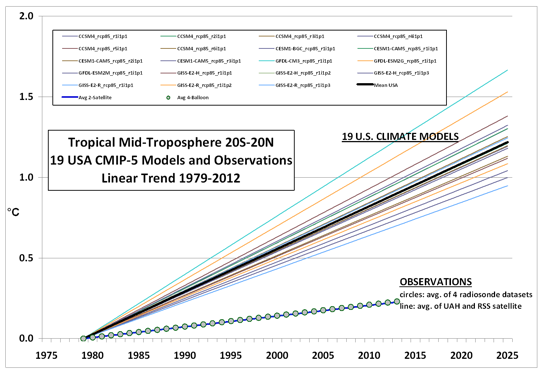
The following graph from Dr. Dr Roy Spencer is even more dramatic. While Dr. Christy shows the average, Dr. Spencer shows how the individual predictions of 19 US models are all well above actual observations. And the EPA is trying to base policy on this?
Why anyone would think they could justify EPA’s regulatory plans or suggest a carbon tax as an alternative given the facts presented above is beyond me.
The facts clearly reveal that the EPA and the president do not have a leg to stand on as their policies assault the very energy lifeline of our economy at this critical time in our nation’s history. The EPA’s decisions are based on erroneous ideas. Quite sinister is the fact that the foundational core values of this country—the encouragement of liberal free thinking, competition and tolerance—are all opposite of what the EPA and this president are doing in regards to climate change. Their policy is to shut down exposure to the facts, destroy the chance to compete in a free and vibrant market, and not tolerate any dissent.
There is more than just a cat fight among scientists involved here, and in fact I would argue that it is a side show to the main agenda despite the fact that each of the EPA’s lines of “evidence” are invalid as shown above. People are already getting hurt. Close to 150 coal plants have been shutdown, throwing people out of work and driving up costs. And that’s just the tip of the iceberg. It prompted this:
Democratic Senator Joe Manchin (WV) said Obama was waging “a war on coal ... a war on jobs ... a war on America.”
Given the immense problems facing our nation today—which includes the increasingly turbulent Middle East; America could be energy independent and more prosperous by exploiting the resources we have here—why are people pushing these policies? They are either frightfully out of touch with the situation, or worse, they may have an agenda that is weakening the fiber of the nation.
You see the evidence. What is your verdict?
Joe Bastardi is chief forecaster at WeatherBELL Analytics, a meteorological consulting firm.