

Climate alarmists didn’t get all they wanted but they put us on a very slippery slope
David Rothbard and Craig Rucker
The eighteenth Conference of Parties to the Kyoto Protocol (COP-18) has ended. It was the latest chapter in the interminable negotiations over wealth redistribution and control of energy use and economic growth - in the name of preventing “dangerous manmade global warming.”
For people who believe humans can prevent “catastrophic climate change” by adjusting atmospheric carbon dioxide levels by a few parts per million - or are determined to crave control “destructive” fossil fuels and “unsustainable” economic systems - Doha was a failure.
Only 37 of 194 nations signed the treaty that replaces the Kyoto Protocol, which expires December 31 - and several countries may withdraw their consent. That means the new agreement is legally non-binding and covers only 15% of global carbon dioxide emissions.
While the European Union joined in and remains committed to “carbon trading” (making former UNFCC chair Yvo DeBoer happy in his new role as a carbon trader, á la Al Gore), the United States, Brazil, Russia, India, China, Canada, Japan and other major emitters refused to sign, and the new treaty sets no binding emission limits. Atmospheric CO2 levels will thus continue to climb - and climate campaigners will remain distraught over allegedly disastrous weather events, imminent habitat devastation, species extinctions, injustice for the world’s poor, and the disappearance of island nations beneath the waves.
For those who say computer models are meaningless, climate change and weather extremes are natural, and economic growth should be sustained to lift more billions out of poverty, Doha represents a partial success. Few nations signed the treaty, even the Obama Administration did not commit to it, the document is not binding, and countless billions of dollars will be available for continued economic development and disaster relief. instead of being squandered on fruitless attempts to control Earth’s infinitely complex climate and weather.
Even Christina Figueres, DeBoer’s successor at the UN Framework Convention on Climate Change, could proclaim victory. She wants to keep the planet’s temperature from rising more than the internationally agreed maximum of two degrees Celsius. That goal has arguably been reached already. There has been no detectable increase in average global temperatures for 16 years.
In fact, while last summer was hot and dry in much of the continental USA, nearing records set during the Dust Bowl years of the 1930s, it was a very cold summer in Alaska and parts of Europe. Winter 2012 was snowy and nasty in Central Europe and very cold in South Africa and South America. Britain just had its coldest autumn in nineteen years, Himalayan glaciers are growing, interior Greenland is not melting, summer Antarctic sea ice is near record extent, and seas are not rising any faster.
All this helps explain why climate alarmists keep changing their rhetoric: from global cooling to global warming, to climate change to climate disruption, and now to extreme weather. Indeed, they now try to link every unusual weather event to CO2 (and now methane, or natural gas, the fuel produced through hydraulic fracturing or fracking). However, as Dr. Roger Pielke, Jr. has noted, when the Atlantic hurricane season starts next June 1, it will have been 2,777 days since a category 3, 4 or 5 hurricane made landfall along the U.S. coast, the longest such period since 1900. 2012 also marked the quietest U.S. tornado season on record; only twelve tornadoes touched down in the United States in July 2012.
Of course, there are always disasters and human tragedies at the hands of a not-always-benevolent Mother Nature. Hardly a year has ever gone by without many such weather events somewhere on Planet Earth.
This year, however, climate alarmists have blamed virtually all of them on humans and CO2 emissions from Sandy in the USA to 2011 and 2012 typhoons in the Philippines, and droughts in Africa. It’s easy to see why. As a Greenpeace director cogently explained, “The key issue is money” as in the redistribution of wealth from rich, formerly rich and soon-to-be formerly rich nations to still poor countries. The other issue is power and control: as in who gets to make energy, economic, and human health and welfare decisions: individuals, families, communities and nations – or eco-activists and UN bureaucrats.
That brings us to the in-between: the uncharted waters separating “bitter failure” and “partial success.”
As climate activists and media “journalists” have observed, there is no legally binding agreement on reducing greenhouse gas emissions. The world’s two biggest CO2 emitters, China and the United States, did not sign. What was agreed to contains only vague promises that, “beginning in 2020, at least $100 billion a year will flow from public, private and other sources” to poor countries, supposedly to help them cope with the “devastating effects” of climate change and “extreme weather.” There is no agreement as to where that $1 trillion per decade will come from, or how much will be available annually between now and 2020, especially if the global economic downturn continues.
But don’t believe the vague promises, bitter failure, bitterly disappointed rhetoric. The climate alarmists got a lot of what they came for, they gave up little or nothing, they’ll be back for more, and in the meantime they will still get billions of dollars annually from taxpayers – to conduct climate change causation, mitigation, adaptation and compensation “research,” issue “balanced reports,” and attend many more conferences (all expenses paid) where virtually no one except alarmists is allowed to speak or participate in official “discussions” and “negotiations.”
More than 7,000 environmental NGO activists attended the Doha confab and next time around they won’t forget who sent them, now that Jonathan Pershing, chief U.S. negotiator for climate change at Doha, has pointedly reminded them who paid for their presence in Qatar. They and the official delegates will be there for specific objectives: more money, more power, more control.
In Doha, they reached several benchmarks that they had achieved during previous COP events. Most important, they enshrined in the treaty the concept ‘of loss and damage” supposedly resulting from “manmade climate change” and secured pledges from “rich” nations that poor countries would receive billions of dollars per year in “all” to repair any “loss and damage,” as part of a “climate compensation mechanism.” They also incorporated “principles” of “equity” and “justice” and “common but differentiated responsibilities” to distinguish between nations that “caused” climate change and “extreme weather events” and countries that presumably did not or are “especially vulnerable.”
It is true that words like “compensation,” “fault” and “liability” were excised from the final treaty language and that it will be all but impossible to determine how much, if any, loss and damage from a tornado, hurricane, typhoon, flood or drought was due to “manmade climate change” versus how much from natural climate change and natural, normal extreme weather events. Who will pay how much, from existing aid programs versus new programs, and through what UN or other conduits, will likewise have to be decided at one of the presumably many future Conferences Of Parties to the new climate agreement.
“This is just the beginning of the process,” a Greenpeace activist, helpfully explained.
Indeed, the “parties” and thus their taxpayers, food and energy consumers, and citizens hoping to pursue their dreams are slowly but surely, piece by piece, surrendering their rights, freedoms, sovereignty and hard-earned wealth to a gaggle of unelected and unaccountable activists, agitators, bureaucrats, autocrats and kleptocrats. The slippery slope is just ahead, if we are not already on it.
The scientific case for manmade global warming disasters grows weaker by the day. But no one should ever underestimate the desperation, audacity and political brilliance of those who have staked their careers, reputations, salaries and pensions on the notion that our energy use and quest for improved living standards for all humanity have somehow usurped the natural forces that have driven climate changes from time immemorial. We underestimate the alarmists at our peril.
David Rothbard serves as president of the Washington, DC-based Committee For A Constructive Tomorrow (www.CFACT.org and www.CFACT.tv). Craig Rucker is CFACT’s executive director.
Posted by Jeff Condon on September 11, 2011
It looks like the “skeptics” (if that’s what you call them) were right again. Steve McIntyre pointed out a paper in print at GRL that was similar in content to some of his an Ross McKitrick’s own work (MMH10) demonstrating again that climate models run generally higher than observations. This is particularly true in the case of the tropical warming in the upper troposphere covered in this paper - On the warming in the tropical upper troposphere:Models versus observations (free). The paper was written by Qiang Fu, Syukuro Manabe, and Celeste M. Johanson (FMJ11).
Abstract:
[1] IPCC (Intergovernmental Panel on Climate Change) AR4 (Fourth Assessment Report) GCMs (General Circulation Models) predict a tropical tropospheric warming that increases with height, reaches its maximum at ∼200 hPa, and decreases to zero near the tropical tropopause. This study examines the GCM‐predicted maximum warming in the tropical upper troposphere using satellite MSU (microwave sounding unit)‐derived deeplayer temperatures in the tropical upper‐ and lower‐middle troposphere for 1979 to 2010. While satellite MSU/AMSU observations generally support GCM results with tropical deep‐layer tropospheric warming faster than surface, it is evident that the AR4 GCMs exaggerate the increase in static stability between tropical middle and upper troposphere during the last three decades. Citation: Fu, Q., S. Manabe, and C. M. Johanson (2011), On the warming in the tropical upper troposphere:
My bold of course. This is a key factor in the global warming debate as the missing hot spot is an indicator that feedback mechanisms are not properly quantified in climate models. The results of FMJ11 are rather stunning to see in print these days as there was um… considerable review difficulty experienced in rebutting the Santer 08 paper claiming that models do match observations. It is worth noting that Santer has a new paper out on the topic which I will discuss in another post here.
Now this is a slightly different claim than Santer and MMH10 which looked at simple trends of the atmosphere, but the result is perhaps more important in that climate science is now recognizing in print that key differences between observed vs modeled feedbacks DO exist and that modeled trends are overstated. I have yet to see any of the best known climate scientists admit these unquestionable discrepancies. The methods of the paper seem reasonable enough and are not difficult to follow except that you do need to understand the data in question is the difference in the temperature trends between tropical upper‐ and lower‐middle troposphere (T24‐T2LT) as defined and discussed in the paper linked above. How much upper vs lower troposphere warming is observed is a result of CO2 heat capture and feedback in real world and modeled climate systems.
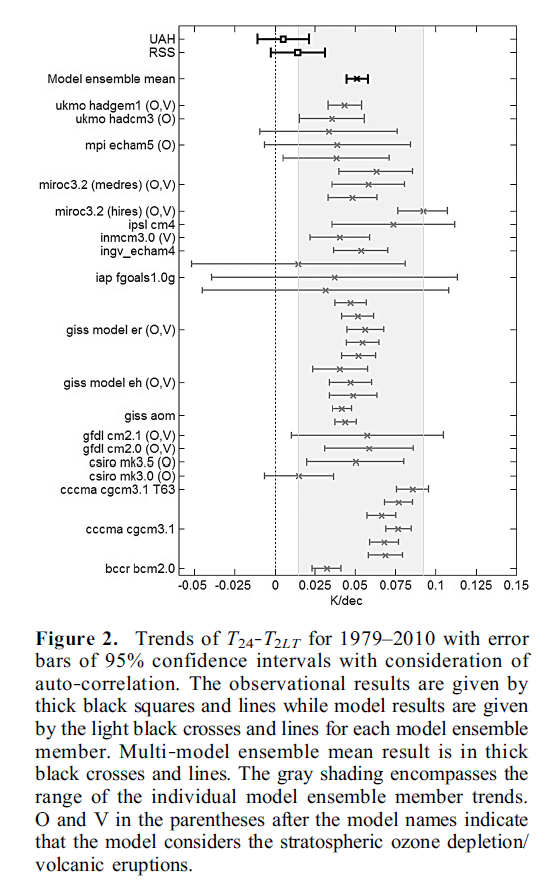
Below is the key plot of modeled vs observed temperatures:
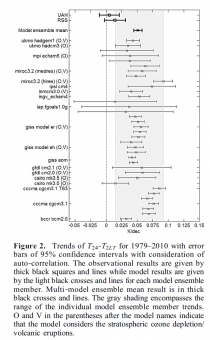
As we have seen so often in blogs and print, the models run hot in comparison to observed trends both individually and in aggregate. Again, the difference here is that this paper analyzes the heat buildup region of the tropical troposphere which is a key prediction of climate models. This is different from the result of MMH10 which shows that the model trends are generally high. Instead, this is a clue to the reason as to WHY they are running high.

In the text, however, a simple statement is made which corroborates MMH10, the numerous posts by Chad Herman at TreesFortheForest and Steve McIntyre on Briffa 08, Lucia and others and contradicts the general conclusions of Santer08 that climate models are accurately representing observation.
Tropical surface temperature trend from multi‐model ensemble mean is more than 60% larger than those from observations (Table 1), indicating that AR4 GCMs overestimate the warming in the tropics for 1979 to 2010. Thus larger T24‐T2LT trends from AR4 GCMs are partly caused by GCM overestimation of tropical temperature trends.
The models are running too hot. Either that or the thermometers need to be replaced. There has been a lot of denial in the climate scientist community on these basic facts perhaps we should begin collecting quotes for the future retractions as the main stream will soon need to address this reality. One can’t help but wonder if a change in predicted warming magnitude will affect the overall anti-industrial, anti-capitalist message of the climate community.
The conclusion with my bold:
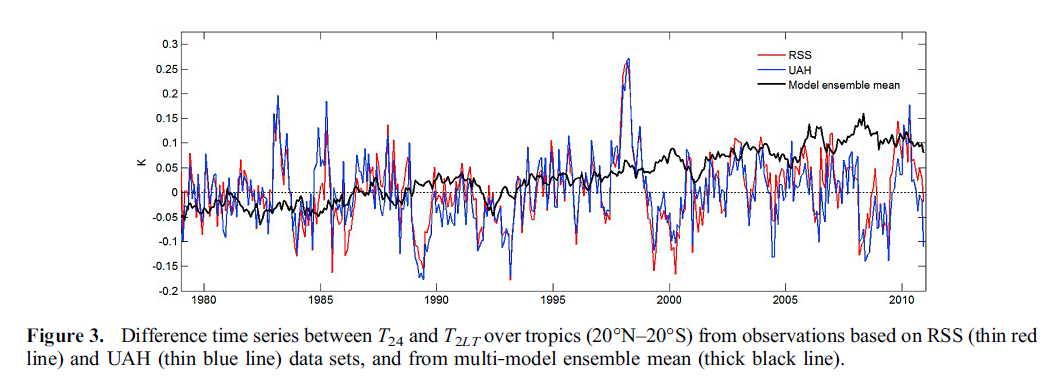
One of the striking features in GCM‐predicted climate change due to the increase of greenhouse gases is the much enhanced warming in the tropical upper troposphere. Here we examine this feature by using satellite MSU/AMSUderived deep‐layer temperatures in the tropical upper‐ (T24) and lower‐ (T2LT) middle troposphere for 1979to2010. It is shown that T24‐T2LT trends from both RSS and UAH are significantly smaller than those from AR4 GCMs. This indicates possible common errors among GCMs although we cannot exclude the possibility that the discrepancy between models and observations is partly caused by biases in satellite data.
IPCC AR4 GCMs overestimate the warming in the tropics for 1979 to 2010, which is partly responsible for the larger T24‐T2LT trends in GCMs. It is found that the discrepancy between model and observations is also caused by the trend ratio of T24 to T2LT, which is ∼1.2 from models but ∼1.1 from observations. While strong observational evidence indicates that tropical deep‐layer troposphere warms faster than surface, this study suggests that the AR4 GCMs may exaggerate the increase in static stability between tropical middle and upper troposphere in the last three decades. In view of the importance of the enhanced tropical upper tropospheric warming to the climate sensitivity and to the change of atmospheric circulations, it is critically important to understand the causes responsible for the discrepancy between the models and observations.
With so many papers coming out in support of a less severe warming effect, the climate community might do well to accelerate the release of AR5 before they are forced to recognize these problems. As an aside, it isn’t the message that is causing public opinion to change, it isn’t the fact that the public doesn’t understand, it is the regular discovery of the truly uncertain nature of the climate future which cuts into the message.
-----------
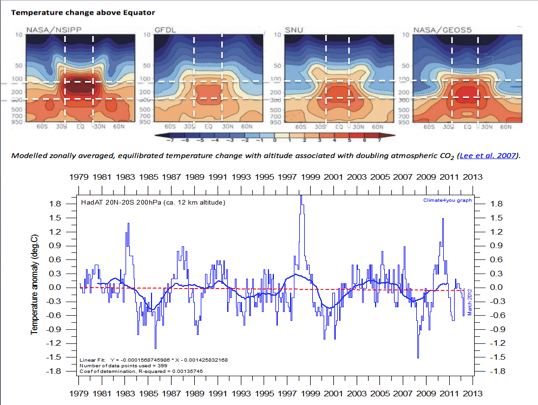
This is supported by the Hadley Balloon and NOAA buoy based ocean temperatures.

Enlarged. Top row shows mode forecast warming concentrated in polar low levels in tropical high levels. Bottom show the Hadley weather balloon for the level supposedly at the core of the warming.
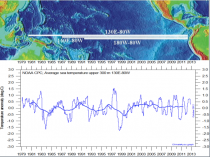
Enlarged This is the 0 to 300m temperature trend for the entire tropical Pacific. CO2 is supposed to be warming the oceans in the tropics and translating to the warming above. Both are not observed.
Source: SPPI
Source: SPPI
From Christopher Monckton of Arabia in Doha, Qatar
I have been a bad boy. At the U.N. climate conference in Doha, I addressed a plenary session of national negotiating delegates though only accredited as an observer.
Tsk, tsk. See me after class. Five demerits. Get down and give me 20!
One just couldn’t resist. There they all were, earnestly outbidding each other to demand that the West should keep them in pampered luxury for the rest of their indolent lives, and all on the pretext of preventing global warming that has now become embarrassingly notorious for its long absence.
No one was allowed to give the alternative - and scientifically correct – viewpoint. The U.N.’s wall of silence was rigidly in place.
The microphone was just in front of me. All I had to do was press the button. I pressed it. The Chair recognized Myanmar (Burmese for Burma). I was on.
On behalf of the Asian Coastal Co-operation Initiative, an outfit I had thought up on the spur of the moment (it sounded just like one of the many dubious taxpayer-funded propaganda groups at the conference), I spoke for less than a minute.
Quietly, politely, authoritatively, I told the delegates three inconvenient truths they would not hear from anyone else:
There has been no global warming for 16 of the 18 years of these wearisome, self-congratulatory yadayadathons.
It is at least ten times more cost-effective to see how much global warming happens and then adapt in a focused way to what little harm it may cause than to spend a single red cent futilely attempting to mitigate it today.
An independent scientific enquiry should establish whether the U.N.’s climate conferences are still heading in the right direction.
As I delivered the last of my three points, there were keening shrieks of rage from the delegates. They had not heard any of this before. They could not believe it. Outrage! Silence him! Free speech? No! This is the U.N.! Gerrimoff! Eeeeeeeeeagh!
One of the hundreds of beefy, truncheon-toting U.N. police at the conference approached me as I left the hall and I was soon surrounded by him and a colleague. They took my conference pass, peered at it and murmured into cellphones.
Trouble was, they were having great difficulty keeping a straight face.
Put yourself in their sensible shoes. They have to stand around listening to the tedious, flatulent mendacities of pompous, overpaid, under-educated diplomats day after week after year. Suddenly, at last, someone says “Boo!” and tells the truth.
Frankly, they loved it. They didn’t say so, of course, or they’d have burst out laughing and their stony-faced U.N. superiors would not have been pleased.
I was amiably accompanied out into the balmy night, where an impressive indaba of stony-faced U.N. officials were alternately murmuring into cellphones and murmuring into cellphones. Murmuring into cellphones is what they do best.
After a few minutes the head of security - upper lip trembling and chest pulsating as he did his best to keep his laughter to himself - briefly stopped murmuring into his cellphone and bade me a cheerful and courteous goodnight.
The national delegation from Burma, whose microphone I had borrowed while they were out partying somewhere in the souk, snorted an official protest into its cellphone.
An eco-freako journalist, quivering with unrighteous indignation, wrote that I had been “evicted”. Well, not really. All they did was to say a cheery toodle-pip at the end of that day’s session. They couldn’t have been nicer about it.
The journalist mentioned my statement to my fellow-delegates that there had been no global warming for 16 years. What she was careful not to mention was that she had interviewed me at some length earlier in the day. She had sneered that 97% of climate scientists thought I was wrong.
I had explained to her that 100% of climate scientists would agree with me that there had been no global warming for 16 years if they were to check the facts, which is how science (as opposed to U.N. politics) is done.
I had also told her how to check the facts (but she had not checked them):
Step 1. Get the monthly mean global surface temperature anomalies since January 1997 from the Hadley Centre/CRU. The data, freely available online, are the U.N.’s preferred way to measure how much global warming has happened. Or you could use the more reliable satellite data from the University of Alabama at Huntsville or from Remote Sensing Systems Inc.
Step 2. Put the data into Microsoft Excel and use its routine that calculates the least-squares linear-regression trend on the data. Linear regression determines the underlying trend in a dataset over a given period as the slope of the unique straight line through the data that minimizes the sum of the squares of the absolute differences or “residuals” between the points corresponding to each time interval in the data and on the trend-line. Phew! If that is too much like doing real work (though Excel will do it for you at the touch of a button), find a friendly, honest statistician.
Step 3. Look up the measurement uncertainty in the dataset. Since measuring global temperature reliably is quite difficult, properly-collated temperature data are presented as central estimates flanked by upper and lower estimates known as the “error bars”.
Step 4. Check whether the warming (which is the difference between the first and last value on the trend-line) is greater or smaller than the measurement uncertainty. If it is smaller, falling within the error-bars, the trend is statistically indistinguishable from zero. There has been no warming – or, to be mathematically nerdy, there has been no statistically-significant warming.
The main point that the shrieking delegates here in Doha don’t get is this. It doesn’t matter how many profiteering mad scientists say global warming is dangerously accelerating. It isn’t. Period. Get over it.
The fact that there has been no global warming for 16 years is just that a fact. It does not mean there is no such thing as global warming, or there has not been any global warming in the past, or there will be none in future.
In the global instrumental temperature record, which began in 1860, there have been several periods of ten years or more without global warming. However, precisely because these periods occur frequently, they tend to constrain the overall rate of warming.
Ideally, one should study periods of warming that are either multiples of 60 years or centered on a transition year between the warming and cooling (or cooling and warming) phases of the great ocean oscillations. That way, the distortions caused by the naturally-occurring 30-year cooling and 30-year warming phases are minimized.
Let’s do it. I have had the pleasure of being on the planet for 60 years. I arrived when it first became theoretically possible for our CO2 emissions to have a detectable effect on global temperature. From 1952 to the present, the planet has warmed at a rate equivalent to 1.2 Celsius degrees per century.
Or we could go back to 1990, the year of the first of the four quinquennial Assessment Reports of the Intergovernmental Panel on Climate Change (IPeCaC). It predicted that from 1990-2025 the world would warm at 0.3 C/century, giving 1 C warming by 2025.
Late in 2001 there was a phase-transition from the warming to the cooling phase of the Pacific Decadal Oscillation, the most influential of the ocean oscillations. From 1990-2001 is 11 years; from 2001-2012 is 11 years. So 1990-2012 is a period centered on a phase-transition: with minimal natural distortion, it will indicate the recent temperature trend.
Since 1990 the world has warmed at 1.4 C, century, or a little under 0.3 C in all. Note that 1.4 C/century is a little greater than the 1.2 C/century observed since 1952. However, the period since 1990 is little more than a third of the period since 1952, and shorter periods are liable to exhibit somewhat steeper trends than longer periods.
So the slightly higher warming rate of the more recent period does not necessarily indicate that the warming rate is rising, and it is certainly not rising dangerously.
For the 21st century as a whole, IPeCaC is predicting not 1.2 or 1.4 C warming but close to 3 C, more than doubling the observed post-1990 warming rate. Or, if you believe the latest scare paper from our old fiends the University of East Anglia, up to 6 C, quadrupling it.
That is not at all likely. The maximum warming rate that persisted for at least ten years in the global instrumental record since 1850 has been 0.17 C. This rate occurred from 1860-1880; 1910-1940; and 1976-2001.
It is only in the last of these three periods that we could have had any warming influence: yet the rate of warming over that period is the same as in the two previous periods.
All three of these periods of rapidish warming coincided with warming phases of the Pacific Decadal Oscillation. The climate scare got underway about halfway through the 1976-2001 warming phase.
In 1976 there had been an unusually sharp phase-transition from the cooling to the warming phase. By 1988 James Hansen was making his lurid (and now disproven) temperature predictions before the U.S. Congress, after Al Gore and Sen. Tim Wirth had chosen a very hot June day for the hearing and had deliberately turned off the air-con.
Here is a summary of the measured and predicted warming rates:
Measured warming rate, 1997-2012
0.0 C/century
Measured warming rate, 1952-2012
1.2 C/century
Measured warming rate, 1990-2012
1.4 C/century
Measured warming rate, 1860-1880
1.7C/century
Measured warming rate, 1910-1940
1.7 C/century
Measured warming rate, 1976-2001
1.7 C/century
Predicted warming rate in IPCC (1990), 1990-2025
3.0 C/century
Predicted warming rate in IPCC (2007), 2000-2100
3.0 C/century
Predicted warming rate by UEA (2012), 2000-2100
4.0-6.0 C/century
But it is virtually impossible to tell the negotiating delegates any of what I have set out here. They would simply not understand it. Even if they did understand it, they would not care. Objective scientific truth no longer has anything to do with these negotiations. Emotion is all.
A particularly sad example of the mawkish emotionalism that may yet destroy the economies of the West was the impassioned statement by the negotiating delegate from the Philippines to the effect that, after the typhoon that has just killed hundreds of his countrymen, the climate negotiations have taken on a new, life-or-death urgency.
As he left the plenary session, the delegates stood either side of the central aisle and showed their sympathy by applauding him. Sympathy for his country was appropriate; sympathy for his argument was not.
After 16 years with no global warming – and, if he reads this posting, he will know how to check that for himself rather than believing the soi-disant “consensus” – global warming that has not happened cannot have caused Typhoon Bhopa, any more than it could have caused extra-tropical storm Sandy.
It is possible that illegal mining and logging played no small part in triggering the landslide that killed many of those who lost their lives.
Perhaps the Philippines should join the Asian Coastal Co-Operation Initiative. Our policy is that the international community should assist all nations to increase their resilience in the face of the natural disasters that have been and will probably always be part of life on Earth.
That is an objective worthier, more realistic, more affordable, and more achievable than attempting, Canute-like, to halt the allegedly rising seas with a vote to establish a second “commitment period” under the Kyoto Protocol.
Will someone please tell the delegates? Just press the button and talk. You may not be heard, though. Those who are not partying somewhere in the souk will be murmuring into their cellphones.