

Comments by Nils-Axel Morner
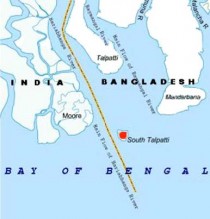
In 1970, the Bay of Bengal was struck by the very powerful Bhola Cyclone. This was a truly disastrous event with a casualty in the order of 500,000 people. This event also caused severe coastal damage. Vast sediment quantities were set in suspension and turbidite flows. At the boarder between India and Bangladesh, these sediment transported down the river accumulated in a mud and sand bar that grew into an island. This newly created island came to be called South Talpatti or New Moore Island.
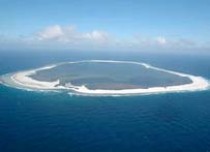
There is nothing strange is this islands come and go by local reasons triggered by sudden events and longer-term dynamic forces. On the 25th of March, it was suddenly announced that the island had disappeared.Many persons, including scientists (for example Sugata Hazra, professor in oceanography at Jadavpur University in Calcutta), took it as an expression of a rapidly rising sea level.
The fact, however, is that it has nothing to do with any global sea level rise, rather local dynamic factors operating in this part of the Bay of Bengal. So, the Island of South Talpatti (New Moor Island) was born in 1970 and killed in 2010; a short life -time of only 40 years. The ultimate cause of its birth was the cyclone damage. The cause of it death is likely to be local dynamic causes operating in this part of the huge delta, and it surely not an effect of a rapid global sea level rise.
Over the last 40 years we record a virtually fully stable eustatic sea level, even in the Sundarban delta of Bangladesh. The disappearance of the island is by no means a sign of the opposite. See PDF.
See story implying it was rising sea levels here.
Guest post by Willis Eschenbach on Watts Up With That
Inspired by this thread on the lack of data in the Arctic Ocean, I looked into how GISS creates data when there is no data.
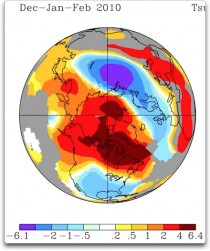
GISS is the Goddard Institute for Space Studies, a part of NASA. The Director of GISS is Dr. James Hansen. Dr. Hansen is an impartial scientist who thinks people who don’t believe in his apocalyptic visions of the future should be put on trial for “high crimes against humanity”. GISS produces a surface temperature record called GISTEMP. Here is their record of the temperature anomaly for Dec-Jan-Feb 2010 :
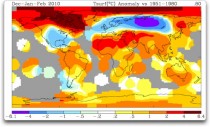
Figure 1. GISS temperature anomalies DJF 2010. Grey areas are where there is no temperature data (enlarged here).
Now, what’s wrong with this picture?
The oddity about the picture is that we are given temperature data where none exists. We have very little temperature data for the Arctic Ocean, for example. Yet the GISS map shows radical heating in the Arctic Ocean. How do they do that?
The procedure is one that is laid out in a 1987 paper by Hansen and Lebedeff In that paper, they note that annual temperature changes are well correlated over a large distance, out to 1200 kilometres (~750 miles).
("Correlation" is a mathematical measure of the similarity of two datasets. It’s value ranges from zero, meaning not similar at all, to plus or minus one, indicating totally similar. A negative value means they are similar, but when one goes up the other goes down.)
Based on Hansen and Lebedeff’s finding of a good correlation (+0.5 or greater) out to 1200 km from a given temperature station, GISS show us the presumed temperature trends within 1200 km of the coastline stations and 1200 km of the island stations. Areas outside of this are shown in gray. This 1200 km. radius allows them to show the “temperature trend” of the entire Arctic Ocean, as shown in Figure 1. This gets around the problem of the very poor coverage in the Arctic Ocean. Here is a small part of the problem, the coverage of the section of the Arctic Ocean north of 80° North:
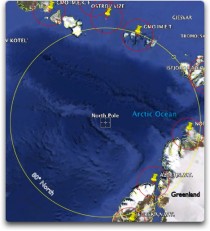
Figure 2. Temperature stations around 80° north. Circles around the stations are 250 km (~ 150 miles) in diameter. Note that the circle at 80°N is about 1200 km in radius, the size out to which Hansen says we can extrapolate temperature trends (enlarged here).
Can we really assume that a single station could be representative of such a large area? Look at Fig.1, despite the lack of data, trends are given for all of the Arctic Ocean. Here is a bigger view, showing the entire Arctic Ocean.
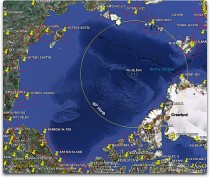
Figure 3. Temperature stations around the Arctic Ocean. Circles around the stations are 250 km (~ 150 miles) in diameter. Note that the area of the Arctic Ocean is about three times the area of the state of Alaska (enlarged here).
What Drs. Hansen and Lebedeff didn’t notice in 1987, and no one seems to have noticed since then, is that there is a big problem with their finding about the correlation of widely separated stations. This is shown by the following graph:
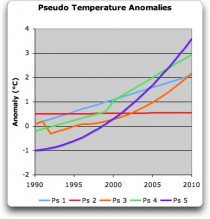
Figure 4. Five pseudo temperature records. Note the differences in the shapes of the records, and the differences in the trends of the records (enlarged here).
Curiously, these pseudo temperature records, despite their obvious differences, are all very similar in one way - correlation. The correlation between each pseudo temperature record and every other pseudo temperature records is above 90%.
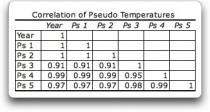
Figure 5. Correlation between the pseudo temperature datasets shown in Fig. 3 (enlarged here).
The inescapable conclusion from this is that high correlations between datasets do not mean that their trends are similar.
OK, I can hear you thinking, “Yea, right, for some imaginary short 20 year pseudo temperature datasets you can find some wild data that will have different trends. But what about real 50-year long temperature datasets like Hansen and Lebedeff used?”
Glad you asked...here are nineteen fifty-year long temperature datasets from Alaska. All of them have a correlation with Anchorage greater than 0.5 (max 0.94, min 0.51, avg .075). These are their trends.
As you can see, the trends range from about one degree in fifty years to nearly three degrees in fifty years. Despite this huge ~ 300% range in trends, all of them have a good correlation (greater than +0.5) with Anchorage. This clearly shows that good correlation between temperature datasets means nothing about their corresponding trends.
Finally, as far as I know, this extrapolation procedure is unique to James Hansen and GISTEMP. It is not used by the other creators of global or regional datasets, such as CRU, NCDC, or USHCN. As Kevin Trenberth stated in the CRU emails regarding the discrepancy between GISTEMP and the other datasets:
My understanding is that the biggest source of this discrepancy [between global temperature datasets] is the way the Arctic is analyzed. We know that the sea ice was at record low values, 22% lower than the previous low in 2005. Some sea temperatures and air temperatures were as much as 7C above normal. But most places there is no conventional data. In NASA [GISTEMP] they extrapolate and build in the high temperatures in the Arctic. In the other records they do not. They use only the data available and the rest is missing.
No data available? No problem, just build in some high temperatures.
Conclusion?
Hansen and Lebedeff were correct that the annual temperature datasets of widely separated temperature stations tend to be well correlated. However, they were incorrect in thinking that this applies to the trends of the well correlated temperature datasets. Their trends may not be similar at all. As a result, extrapolating trends out to 1200 km from a given temperature station is an invalid procedure which does not have any mathematical foundation.
[Update 1] Fred N. pointed out below that GISS shows a polar view of the same data. Note the claimed coverage of the entirety of the Arctic Ocean. Thanks.
(Enlarged here).
Read full post and comments here.
By James Delingpole, UK Telegraph
Climategate exposed the greatest scandal in the history of modern science but you’re never going to hear this from any of the official investigations. Andrew Orlowski at The Register has uncovered why.
Turns out, that there’s this well-funded SPECTRE-like advocacy group called GLOBE (Global Legislators for a Balanced Environment) International which has co-opted leading parliamentarians from the main parties in both the Commons and the Lords into advancing the AGW agenda.
One of those is Lord Oxburgh, recently appointed - on the Royal Society’s recommendation - to lead one of the two official enquiries into Climategate. Mysteriously, Lord Oxburgh has failed to mention GLOBE in his register of interests.
Orlowski reports: GLOBE may be too obscure to merit its own Wikipedia entry, but that belies its wealth and influence. It funds meetings for parliamentarians worldwide with an interest in climate change, and prior to the Copenhagen Summit GLOBE issued guidelines (pdf) for legislators. Little expense is spared: in one year alone, one peer - Lord Michael Jay of Ewelme - enjoyed seven club class flights and hotel accommodation, at GLOBE’s expense. There’s no greater love a Parliamentarian can give to the global warming cause. And in return, Globe lists Oxburgh as one of 23 key legislators.
One insider has described Oxburgh’s appointment to lead this supposedly neutral investigation into Climategate as “like putting Dracula in charge of a blood bank.” Here are just a few more of this scrupulously unbiased fellow’s interests, revealed by Orlowski:
In the House of Lords Register of Lords’ Interests, Oxburgh lists under remunerated directorships his chairmanship of Falck Renewables, and chairmanship of Blue NG, a renewable power company. (Oxburgh holds no shares in Falck Renewables, and serves as a non-exec chairman.) He also declares that he is an advisor to Climate Change Capital, to the Low Carbon Initiative, Evo-Electric, Fujitsu, and an environmental advisor to Deutsche Bank. For a year he was non-exec chairman of Shell.
GLOBE seems especially drawn to the kind of MP who likes sailing close to the wind. Its president is none other than Stephen Byers, recently exposed in the “cash for influence” scandal as offering his services as a lobbyist like a “cab for hire” for a small consideration of just 5,000pounds a day. And its leading lights have also included Elliott Morley, one of the MPs more heavily implicated in the Telegraph’s parliamentary expenses scandal.
As Bishop Hill notes its UK parliamentary group officers also include the redoubtable and incorruptible Labour MP Eric Joyce - “the first MP to claim more than 1m pounds in expenses and on more than one occasion the most expensive MP in the house. He once famously claimed for three oil paintings on expenses “because they looked nice"."
But then, to judge from the research done by Cumbrian Lad at Bishop Hill, GLOBE is very much the kind of body that likes to do things on the sly. Its Memorandum of Incorporation includes this revealing snippet about its purposes: “To provide a forum for ideas and proposals to be floated in confidence and without the attention of an international spotlight”
Bishop Hill reports:
GLOBE’s corporate structure and funding are not clear from its website, but Cumbrian Lad has discovered that it is a private limited company. Interesting that - an organisation of legislators, run as a private company. He has also obtained copies of its accounts and other information from Companies House.
GLOBE was incorporated in 2006, the founding directors all being British legislators - Malcolm Bruce MP (LibDem), Joan Ruddock MP (Lab) and Nick Hurd (Con), with the last directorship being held by Lord Hunt. Since that time, Joan Ruddock has stood down and Lord Oxburgh and Eliot Morley MP (Lab) have been appointed to the board.
The current accounts are all abbreviated, which means there is very little detail about the income and expenditure of the company, but for some reason 2007 was filed in full, revealing an income of 820k pounds, almost double that of the previous year, and all of which was spent on administrative expenses.
And where does this money come from? Its 2008 accounts note: The Directors acknowledge the support of International Organisations, Governments, Parliamentary Bodies and Industry, both financially and politically, with paticular acknowledgement to United Nations, The Global Environment Facility, The World Bank, European Commission, the Governments of Canada and Great Britain, the Senate of Brazil and Globe Japan.
Bishop Hill smells a rat:
My reading of all this would be that GLOBE is a vehicle to enable legislators to avoid the scrutiny of their electorates - the date of incorporation is probably instructive, coming just after the introduction of the Freedom of Information Act. It’s no wonder Lord Oxburgh didn’t want to mention it on his CV.
Here is the link listing the names of all the MPs in its parliamentary group. The ones I find particularly interesting are the Tories on the list. They are:
Gregory Barker
Kenneth Clarke
Lord Fowler
Charles Hendry
Nick Hurd
Graham Stuart
Tim Yeo
If any of these represent your constituency, I urge you not to vote for them. A Conservative who indulges in this kind of slippery green activism is no conservative at all. See story and comments here.