

Australian Broadcasting Corporation
United Nations chief Ban Ki-Moon has announced a respected international body will conduct an independent review of UN climate science after a global warming report was found to have errors.
The Intergovernmental Panel on Climate Change (IPCC) has admitted its 2007 report exaggerated the pace of Himalayan glaciers melting. But Mr Ban says the errors should not affect the conclusion that human activities are changing the climate and that greenhouse gas emissions should be cut urgently.
“The threat posed by climate change is real, and nothing that has been alleged or revealed in the media recently alters the fundamental scientific consensus on climate change,” he said. Mr Ban told reporters that the Amsterdam-based InterAcademy Council (IAC), which groups presidents of 15 leading science academies, will carry out the task “completely independently of the United Nations”.
The IPCC’s chairman, Rajendra Pachauri, says he hopes the inquiry will restore public trust. “In recent months we have seen some criticism,” he said.
“We are receptive and sensitive to that and we are doing something about it. I am very grateful that the secretary-general has very kindly supported this initiative.” Dr Pachauri pledged that an upcoming fifth assessment report by the IPCC would be “stronger and better than anything we have produced in the past”.

The IAC’s co-chairman, Robbert Dijkgraaf, told reporters the panel aims to present its report by the end of next August so that governments can consider it ahead of key climate change meetings late this year. He says the review will focus on what procedures were used. “It will definitely not go over all the data, the vast amount of data in climate science,” he said. “What it will do [is] it will see what the procedures are and how they can be improved. So looking forward, how can we avoid that certain types of errors are made.” See post here.
By Joseph D’Aleo
Our recent SPPI paper covered the many issues with the data including station dropout, missing data, bad siting (largely the result of the modernization), instrument biases, and then the adjustments which dozens of peer review papers show are important and many show could account for up to 50% of the claimed warming since 1900. See this response to NOAA and the EPA that includes that here.
The station dropout issue is not new. I wrote about it in the 1990s in the first generation Intellicast blog and this story in 2001 by former NOAA, NASA scientist and later chief scientist at Raytheon, Dr. Doug Hoyt put it this way “support for this idea comes from the fact that 135 stations in the USSR ceased observing at the end of 1989. Subsequently there appeared to be a warming in the USSR but this warming is not supported by pressure observations. Thus, it appears half or more of the reported global warming from ground observations is arising from this change in station coverage. It is possible that as much as 0.2 C of the 0.25 C warming for 1979-1999 can be explained by this change in stations, although more study is required to refine this number.”
PEER REVIEW SUPPORT FOR SURFACE DATA ISSUES
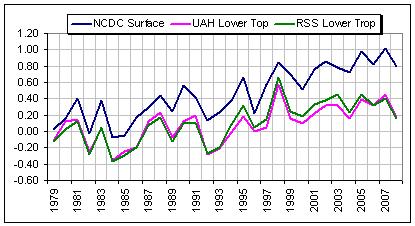
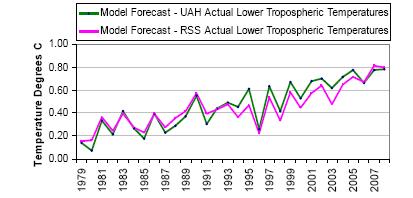
When the satellites were first launched, their temperature readings were in better agreement with the surface station data. There has been increasing divergence over time which can be seen below (derived from Klotzbach, et al 2009). In the first plot, we see the temperature anomalies as computed from the satellites and assessed by UAH and RSS and the station based land surface anomalies from NOAA/(NCDC). That increased divergence is clear from the figure below (enlarged here).

The Klotzbach paper finds that the divergence between surface and lower-tropospheric trends is consistent with evidence of a warm bias in the surface temperature record but not in the satellite data (below, enlarged here).
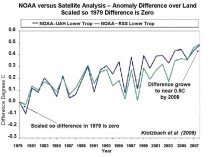
NOAA annual land temperatures minus annual UAH lower troposphere (blue line) and NOAA annual land temperatures minus annual RSS lower troposphere (green line) differences over the period from 1979 to 2008
Klotzbach et. al. described an ‘amplification’ factor for the lower troposphere as suggested by Santer et al (2005) and Santer et al (2008) due to greenhouse gas trapping relative to the warming at the surface. Santer refers to the effect as “tropospheric amplification of surface warming”. This effect is a characteristic of all of the models used in the UNIPCC and the USGRCP “ensemble” of models by Karl, et.al. (2006) which was the source for Karl et al (2009) which in turn was relied upon by EPA in its recent Endangerment Finding.( Federal Register / Vol. 74, No. 239 / Tuesday, December 15, 2009 / Rules and Regulations at 66510 )
As John Christy describes it “The amplification factor is a direct calculation from model simulations that show over 30 year periods that the upper air warms at a faster rate than the surface - generally 1.2 times faster for global averages. This is the so-called “lapse rate feedback” in which the lapse rate seeks to move toward the moist adiabat as the surface temperature rises. In models, the convective adjustment is quite rigid, so this vertical response in models is forced to happen. The real world is much less rigid and has ways to allow heat to escape rather than be retained as models show.” This latter effect has been documented by Chou and Lindzen (2005) and Lindzen and Choi (2009) .
The amplification factor was calculated from the mean and median of the 19 GCMs that were in the CCSP SAP 1.1 report (Karl et al, 2006). A fuller discussion of how the amplification factor was calculated is available in the Klotzbach paper here.
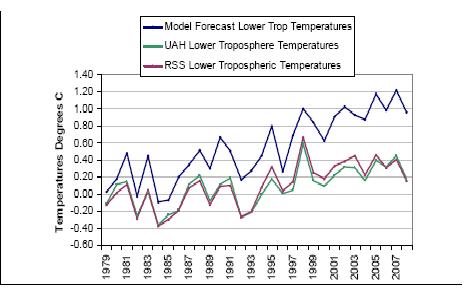
The ensemble model forecast curve (upper curve) in figure (below, enlarged here). was calculated by multiplying the NOAA NCDC surface temperature for each year by the amplification factor, since this would yield the model projected tropospheric temperature. The lower curves are the actual UAH and RSS lower tropospheric satellite temperatures.
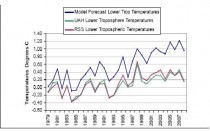
The total divergence of the observed NOAA temperature and satellite temperature difference from the model forecast trends is depicted in the figure (below, enlarged here).

These figures strongly suggest that instead of atmospheric warming from greenhouse effects dominating, surface based warming due to factors such as urbanization and land use changes are driving the observed changes. Since these surface changes are not adjusted for, neither trends from the surface networks nor forecasts from the models can be considered reliable.
This is why the NOAA and NASA press releases should be ignored. The surface based data sets have become seriously flawed and they and the climate models can no longer be trusted for climate trend assessment.
By Marlo Lewis
That’s the topic of this week’s National Journal energy blog. In my contribution, I argue that EPA has been playing a mischievous game that endangers democracy, and that Sen. Lisa Murkowski’s legislation to veto the agency’s endangerment finding would remove this threat.
In a February 22 letter to Sen. Jay Rockefeller (D-WV), EPA Administrator Lisa Jackson warns that enactment of the Murkowski legislation would scuttle the joint EPA/National Highway Traffic Safety Administration (NHTSA) greenhouse gas/fuel economy rulemaking, which in turn would compel the struggling auto industry to operate under a “patchwork quilt” of state-level fuel-economy regulations.
Ms. Jackson neglects to mention that the patchwork threat exists only because she, reversing Bush EPA Administrator Stephen Johnson’s decision, granted California a waiver to implement its own GHG/fuel economy program. Had Jackson reaffirmed Johnson’s denial, there would be no danger of a patchwork, hence no ostensible need for the joint EPA/NHTSA rulemaking to avert it.
As my blog post explains, EPA should not have approved the waiver in the first place. The California GHG/fuel economy program violates the Energy Policy and Conservation Act, which prohibits states from adopting laws or regulations “related to” fuel economy. Worse, the waiver creates a reverse right of preemption whereby states may nullify federal law within their borders - an affront to the Supremacy Clause.
Specifically, the waiver would allow California, and other states opting into the California program, to nullify within their boundaries the reformed national fuel economy program that Congress enacted in the 2007 Energy Independence and Security Act (EISA). That leads straight to a patchwork of state-by-state compliance regimes inimical to a healthy auto industry.
The game EPA is playing is a classic case of bureaucratic self-dealing.
First, EPA endangers the U.S. auto industry by authorizing states to flout federal law and the Constitution. Then, EPA proposes to avert disaster via a rulemaking that just happens to put EPA in the driver’s seat in regulating fuel economy - a power Congress never delegated to EPA when it enacted and amended the Clean Air Act.
Nor is that all. The joint GHG/fuel economy regulation will compel EPA to regulate CO2 from stationary sources - another power Congress never delegated to EPA. By expanding its control over the transport sector, EPA will then have to expand its control over manufacturing, power generation, and much of the commercial and residential sectors, too, because all emit CO2.
In addition, the motor vehicle GHG rule sets the stage for EPA to “tailor,” that is amend, the Clean Air Act so that the agency can delay imposing pre-construction and operating permit requirements on small business, which would surely ignite a political backlash.
So thanks to the endangerment finding, EPA not only gets to play in NHTSA’s fuel-economy sandbox, and extend its tentacles throughout the economy, it also gets to play lawmaker, violating the separation of powers.
In light of all the new powers EPA now expects to wield, it is hardly surprising that EPA never made the strong case against Clean Air Act regulation of CO2 in Massachusetts v. EPA. Here’s what EPA should have argued:
EPA cannot regulate GHG emissions from new motor vehicles under Sec. 202 of the Clean Air Act without regulating CO2 under the Act as a whole.
Applying the Act as a whole to CO2 leads ineluctably to “absurd results” that contravene congressional intent. Therefore, Congress could not have intended for EPA to regulate GHG emissions under Sec. 202.
Did EPA throw the fight in the 11th round? I dunno, but losing the Massachusetts case was surely sweet victory to those in the agency who long to regulate America into a “clean energy future”. The Massachusetts decision laid the groundwork for EPA to deal itself into a position to bypass the people’s elected representatives, impose its will on the auto industry, and, in time, dictate national climate and energy policy.
What happens if Congress enacts Sen. Murkowski’s resolution, nixes the endangerment finding, and mothballs the GHG/fuel economy rule? The authority to make law and national policy returns to where the framers of the Constitution intended - the people’s elected representatives. See more here.