

By P Gosselin on January 14, 2011
This newest tree ring study completely refutes Mann’s bogus hockey stick. That question is now forever resolved.
Der Spiegel reports on a new study put out by Science where scientists gathered data from a large set of tree rings from the Alps and used them to reconstruct 2500 years of climate in fine detail. The scientists were able to reconstruct past climate with unprecedented precision and found some significant results.
The press here is acting like these results are new. But to skeptics, it only confirms what they’ve been saying all along.
It turns out that Hannibal indeed most likely did cross the Alps with elephants way back in the year 218 BC, at a time when Europe was in a warm optimum. The study shows that weather and climate events triggered human and cultural shifts and events like wars, famine, disease - or prosperity and growth, depending on whether it was warm or cold.
Der Spiegel writes:
From 9000 pieces of wood from old post and beam homes and trees, scientists Ulf Buntgen of the Swiss WSL Environmental Research Institute and Jan Esperof the University of Mainz read off the climate story - a unique global historical archive was created.”
Der Spiegel presents the most important results, which I myself think are not a surprise. The bulk of the Der Spiegel piece focuses on the hunger and misery precipitated by the climatic cold periods throughout the 2500-year period. One really gets a sense of how temperatures in Europe by no means followed the hockey stick shape proposed by Mann, and went from cold to warm, and vice versa. Numerous other proxies show the same applies globally.
Disease, war, famine and societal collapse in cool, raw times
2500 years ago Europe was gripped by a cold period and temperatures were 2C below today’s levels. Wars raged and societies collapsed. In the 4th century AD, after the Roman Warm Period, the climate again went downhill. It got cold and dry in central and southern Europe. The Huns invaded, and the Roman Empire collapsed. The temperature continued to drop through the 6th, 7th and 8th centuries - and with catastrophic consequences. Der Spiegel writes:
In the famine year of 784, one third of Europe’s population died. ‘It was a cool summer’, says Büntgen’s sober diagnosis, looking at the data. ‘With the worsening climate, not only did harvests in Europe go bad, but livestock also shriveled away’, reports historian Berninger.”
These cool times continued into the 10th century. Crops continued to fail, famine, unrest, war, disease and misery spread - all because of the cold climate.
Finally, by the 11th century, the climate turned the corner and warm times started up again (all naturally, without man-made CO2). Europe prospered again, cathedrals were built and society advanced until the 14th century.
In the early 14th century, climate-related hunger and famine began to spread again. From 1346 to 1352, half of Europe’s population was killed off by the Black Plague. As the temperature dropped, starvation and misery continued, all blamed on witches, who were burned. Sound familiar?
Europe had plunged into madness. The 30-year war raged across Germany from 1618 to 1648. At this point Europe was in the middle of the Little Ice Age.
Der Spiegel writes:
In 1709 the weather in Europe rendered one of the worst natural catastrophes Europe: In the grisly cold of 1709, rivers in Portugal froze, palm trees were buried in snow. All over Europe rivers had frozen fish, livestock froze in the stables.”
Prosperity and the emergence of empires in warm periods
Heydays, the Roman Empire and the German Empire coincided with warm times. For example, by 300 BC, the climate again got warmer, and with rains. It got so warm in fact, that the Alps became passable. The Roman Empire emerged- all helped along by the climate. Harvests were bountiful, and England had vineyards and made wine. The MWP was similarly warm, read above. There’s ample evidence showing that the Roman Period and the MWP were warmer than today.
Weather extremes were greater in the past than today
Büntgen and Esper’s ring studies also show that rainfall amounts in Central Europe fluctuated much more year-to-year in ancient times and in the Dark Ages than in recent times, and also weather extremes were greater. In the year 1135, very little rain fell and the Danube River almost dried up. Regensburg used the opportunity to build its landmrk Steinernen bridge. The historical records also show a number of great floods, storms and periods of drought during Europe’s history.
That was climate and it was all natural. It was not caused by witches and bad behaviour. This study clearly shows that warm times are good, cold times are bad, and that the past had more extremes than today. Not only is it more nails for the hockey stick’s coffin, but also nails for the AGW theory.
See post and comment back here.
By regionalstates
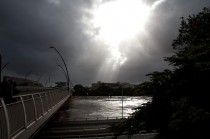
How SEQ Water failed “Flood Mitigation 101”. (13/01/11)
It is surprising how some journalists couldn’t pick a story if it was humping their leg.
On the morning of 12th January, the day before the flood peak that inundated the Brisbane CBD and much of Ipswich, Brian Williams of Brisbane’s Courier Mail, in a masterpiece of misreporting by omission, reported that releases from Wivenhoe Dam were to be reduced from an overnight peak of 645,000 megalitres/day to 205,000 ML/day with the stated aim of “allowing the Bremer River and Lockyer River to subside, thereby easing floods on Brisbane downstream.”
“Wivenhoe Dam levels had dropped just 1 per cent from the previous night, reflecting the massive volumes of water flowing into the storage from its 7020 km2 catchment.” That 1% drop was from a dam capacity of 191% and is an oblique way of saying that the massive flood surge buffer had been pushed close to its limits and they now had no choice but to dump the same amount of water that was flowing into the dam.
What wasn’t mentioned was the fact that for more than a week prior to this large release, only 170,000 ML/day was being released as the storage capacity was allowed to rise to 191% from two weeks of heavy rains. And this meant the carefully designed flood buffer, having been taken to its limits, could no longer function as a buffer. The city was entirely at the mercy of the elements and it would only have taken another 37mm of rain in the catchment to hit the limits.
And as it takes 36 hours for water to flow from Wivenhoe to the CBD then it is absolutely clear that the flood peak of Wednesday night and Thursday morning was a direct result of the previous night’s forced release of the total inflow from the catchment. And this was only necessary because SEQ Water had spent two weeks releasing much less water than was being captured, into a river that was still well below minor flood level.
The article went on to report that releases would go back up to 301,000 ML/day in a few days to reduce the flood buffer volume and that this level of release was, “unlikely to cause a second significant rise in the river.”
What wasn’t mentioned in relation to the reduction from the overnight peak of 645,000 megalitres/day to 205,000 ML/day, with the stated aim of “allowing the Bremer River and Lockyer River to subside, thereby easing floods on Brisbane downstream,” was the fact that the earlier large forced release did the direct opposite. It prevented the Bremer and Lockyer Rivers from subsiding and exacerbated the flooding of Brisbane downstream.
By reducing releases to only 205,000 ML/Day after the peak discharge, SEQ Water is essentially admitting that the peak discharge impaired the flow from the Bremer and Lockyer Rivers by about 100,000 ML/day over that 36 hour period, which they then had to remedy with a lower Wivenhoe release.
At this point those who did not come down in the last shower might ask, “so why didn’t they release 300,000ML/day before the buffer was fully extended?” If they had done so there would not have been any need for a larger forced release at all.
Limited Wivenhoe releases on Monday and Tuesday were justified because the flash flooding in the Bremmer and Lockyer Valleys needed somewhere to go. But that doesn’t explain the low releases right through the previous week to Sunday the 9th January. Larger pre-releases in the order of 300,000 ML/day would have maintained sufficient buffer to ensure that no flood peak occurred at all. The river would have kept on flowing at minor flooding level right through this period.
What sort of people, in Queensland of all places, in a strong La Nina wet season, would not start serious dam releases when they were already at capacity, with saturated catchments, in the first week of December? Surely, pre-releases would be more prudent than post-releases in such circumstances?
We need a full inquiry into why this dam managed by SEQ Water, and others managed by Sunwater, were managed in a way that actually produced the kind of flood it was designed to prevent.
[Update: 13/01/11 4.53pm, The spin is on in full. Television reports are now wrongly reporting that the drop back from the temporary high release volume was instrumental in preventing a worse flood peak.]
Story here. Pictures before and after here.
Flooding historically in Queensland has occurred in La Ninas in cold PDO years, conditions occuring this year. A similar major flood occurred in 1974, a strong La Nina winter in the 1947-1977 cold PDO phase.
A similar major flood occurred in 1974, a strong La Nina winter.
Precipitation anomalies in the 1974 flood year through February 11 enlarged here.
2010 precipitation anomalies through January 11 enlarged here.
In fact if you composite all La Nina years with cold PDO you get this Queensland wet signal (November to March).
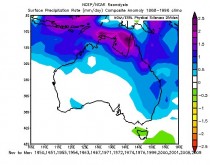
Enlarged here.
Update: a study in Nature magazine from late 2010 that says global warming is driving the drought in Oz by reducing moisture in the air. And of course, following the floods, they’re all rushing to blame them on increased moisture in the air caused by global warming. See more here. H/T Haunting the Library
UPDATE: See in this blood boiling piece how Kevin Trenberth will be giving another address at the AMS annual meeting. His comments were preposted at the AMS website. Excerpts:
2. THE DENIERS
But their critics are another matter entirely, and their false claims have not been scrutinized or criticized anything like enough! Perhaps climategate comes from the somewhat inept response of climate scientists to criticisms from various sources. The climate change deniers have very successfully caused major diversions from the much needed debate about what to do about climate change and how to implement it. It is important that climate scientists learn how to counter the distracting strategies of deniers. Debating them about the science is not an approach that is recommended. In a debate it is impossible to counter lies, and caveated statements show up poorly against loudly proclaimed confident statements that often have little or no basis. Scientific facts are not open to debate and opinion because they are evidence and/or physically based. Moreover a debate actually gives alternative views credibility. On the other hand there is a lot of scope for debate about exactly what to do about the findings.
3. THE MEDIA
The media have been complicit in this disinformation campaign of the deniers. Climate varies slowly and so the message remains similar, year after year - something not exciting for journalists as it is not “news”.
As commenter JIMBO correctly noted: “3. THE MEDIA
The media have been complicit in this disinformation campaign of the deniers.”
LOL. He should have said: “The media have been complicit in this disinformation campaign of the Warmists.”
“The comment was naive and sent before he understood the process and before any lead author meetings were held.”
From: Phil Jones
To: “Michael E. Mann”
Subject: HIGHLY CONFIDENTIAL
Date: Thu Jul 8 16:30:16 2004
“I can’t see either of these papers being in the next IPCC report. Kevin and I will keep them out somehow - even if we have to redefine what the peer-review literature is !
Cheers
Phil”
Doesn’t sound like naive to me when he used the words “HIGHLY CONFIDENTIAL”.
The only deniers in this whole sad saga are the Thermists. Over a decade of flat temps does nothing to prick their curiosity about the validity of AGW. Add 10 years of cooling and they still won’t budge.
Read more about Trenberth’s activism here. Please comment back to him at the email address or Executive Director of the AMS Keith Seitter (kseitter@ametsoc.org) your opinion on their advocacy position and skeptic bashing.
Read the new Climate Audit post Trenberth’s Bile here.
Excerpt: Trenberth described his recommended tactic in a Climategate email as follows:
“So my feeble suggestion is to indeed cast aspersions on their motives and throw in some counter rhetoric. Labeling them as lazy with nothing better to do seems like a good thing to do.”
-----------
By Norman Rogers
Can scientists become “Deadly Ninjas of Science Communication”? That was proposed by Chris Mooney, author of The Republican War Against Science,” and a member of the board of directors of the American Geophysical Union. Mooney advocated this idea in a presentation at the Union’s December 13-17 fall meeting in San Francisco.
Mooney is concerned that global warming skeptics are getting the upper hand in the ongoing debate. Mooney has an unquestioning belief that disaster will overtake the world if we don’t mend our CO2-emitting ways. Many other speakers at the meeting, like Mooney, suggested that if scientists improved their communications skills, the skeptics could be defeated.
At the same fall meeting four years ago, Al Gore spoke to ten thousand assembled scientists. The scientists treated him like a rock star. Why would the scientists love Al Gore? His movie, An Inconvenient Truth, was full of scientific errors. But this is about not biting the hand that feeds you. When Al Gore spreads global warming hysteria, financial and political support for climate science increases. Scientists become guests on TV shows instead of lab drones.
But a dark cloud is gathering over climate science. Public fear of global warming is declining. Most of the activist scientists gathered in San Francisco were blind to the possibility that there is any defect in their scary product. It must be that forces of darkness (perhaps Republicans or coal companies) are financing skeptics. Apparently the skeptics, cleverly disguised as grassroots activists, have an uncanny knack for propaganda.
A few years ago, Exxon, a world-class provider of CO2 emissions, would have been top dog among the forces of darkness. But now Exxon is the sole “titanium” sponsor of the meeting, ranked above the platinum, gold, silver, and bronze sponsors. Apparently Exxon gave the Union so much money that they had to create a new category, and the logic of the nobility of the metals in the periodic table be damned. Exxon purchased an indulgence from the church of global warming, probably at a price that is Exxon chump change.
Susan Hassol, a professional climate change communicator, gave the scientists in San Francisco a long list of words that scientists should never use when communicating with the public. For example, to climate scientists, a positive feedback to global warming is bad, because a positive feedback would increase global warming. But to the man in the street, a positive feedback is good, as when your boss gives you positive feedback.
One of the most famous propagandists of global warming, professor Michael Mann, gave a bitter presentation. Mann is famous for creating the hockey stick curve, a graph that purported to show that the climate was stable for a thousand years until CO2 emissions in the 20th century made the temperature shoot up like the blade of a hockey stick. The hockey stick graph went viral and was published everywhere as absolutely positive scientific proof of man-caused global warming. A retired expert on mining, Steve McIntyre, working out of his modest Toronto house, thought the graph was suspicious and decided to investigate. Amateur scientist McIntyre demolished the hockey stick, along with Mann’s reputation. Mann’s presentation in San Francisco depicted him as a victim of dark forces. Some of his slides included a picture of Sarah Palin in the upper-left corner, probably to galvanize the left-leaning audience.
Steve Easterbrook, a professor and software expert, reported on his investigation of computer climate models. The entire edifice of global warming alarmism rests on a foundation of computer climate models used to make predictions about the future climate. Easterbrook visited four different laboratories where models are created. He basically said that these huge computer programs that have a million lines of computer code are kludges that would have to be completely rewritten to be up to modern software standards. It would take fifty programmers working for twenty years at a cost of $350 million to rewrite one of these software dinosaurs.
However, there is little reason to suppose that if the models were rewritten, they would be much better. As the brilliant and perhaps overly candid government scientist Kevin Trenberth said, “none of the climate states in the models correspond even remotely to the current observed climate. In particular, the state of the oceans, sea ice, and soil moisture has no relationship to the observed state at any recent time[.]” It is an embarrassing fact that the major models disagree with each other by more than two-to-one about the magnitude of future global warming.
It was apparent that scientists have little experience with propaganda. Rather than trying to do it themselves, they need to take a lesson from Al Gore and bring in the big guns from Hollywood and Madison Avenue. Or maybe they should stick to science and stop trying to convince us that doom is around the corner unless we reconfigure the world economy to their specifications. See post on American thinker here.
The author is a senior policy advisor at the Heartland Institute and maintains a website at www.climateviews.com.