

By Indur M. Goklany
Background
Based on 2000-08 data, extreme weather events are responsible for about 0.05% of all global deaths (31,700 deaths vs. 58.8 million, annually). That is, despite the media attention to such events, extreme weather events have a minor impact on global public health.
Long term (1900-2008) data show that average annual deaths and death rates from all such events declined by 93% and 98%, respectively, since cresting in the 1920s (Figure 1). These declines occurred despite a vast increase in the populations at risk and more complete coverage of extreme weather events (Figure 2).
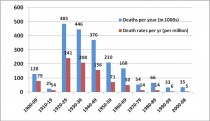
Figure 1: Enlarged here. Global Death and Death Rates Due to Extreme Weather Events, 1900-2008. Source: Goklany (2009), based on EM-DAT (2009), McEvedy and Jones (1978), and WRI (2009).
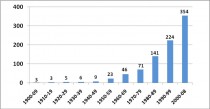
Figure 2: Enlarged here. Average Number of Extreme Weather Events per Year by Decade, 1900-2008. Source: Goklany (2009), based on EM-DAT (2009).
Deaths and death rates from droughts were responsible for the majority (58%) of all deaths due to extreme weather events from 1900-2008. They also peaked in the 1920s. Since then, they have been reduced by 99.97% and 99.99%, respectively (Figure 3).
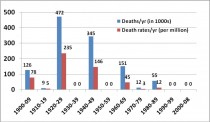
Figure 3: Enlarged here. Droughts: Global Deaths & Death Rates, 1900-2008. Source: Goklany (2009), based on EM-DAT (2009), McEvedy and Jones (1978), and WRI (2009).
For floods, responsible for another 34% of aggregate deaths, deaths and death rates have declined by 98.7%-99.6% since the 1930s (Figure 1).
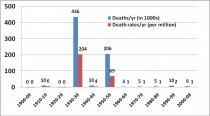
Figure 4: Enlarged here. Floods: Global Deaths and Death Rates, 1900-2008. Source: Goklany (2009), based on EM-DAT (2009), McEvedy and Jones (1978), and WRI (2009).
For storms (including hurricanes, cyclones, tornados, typhoons), responsible for 7% of extreme weather event deaths from 1900–2008, deaths and death rates declined by 47.0%-70.4% since the 1970s (Figure 4).
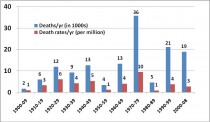
Figure 5: Enlarged here. Storms (including hurricanes, cyclones, tornados, typhoons): Global Deaths and Death Rates, 1900-2008. Source: Goklany (2009), based on EM-DAT (2009), McEvedy and Jones (1978), and WRI (2009).
These trends indicate that the total risk of death from all extreme weather events has actually declined despite claims that the number and intensity of extreme weather events has increased. The decline in deaths from extreme weather events occurred despite an increase in deaths from all causes, indicating that the world is coping with the former much better than it is with far more significant sources of deaths and disease. What accounts for the reduction in the death toll from extreme weather events?
First, the decline in the death toll from droughts, in particular, is that global food production has never been higher than it is today (Goklany 1998, 2007). This is largely due to improved seeds, fertilizers, pesticides, irrigation, and farm machinery. This entire suite of technologies also enabled the Green Revolution. But fertilizers and pesticides are manufactured from fossil fuels, and energy is necessary to run irrigation pumps and machinery. Without them, the benefits of improved seeds would be for naught. And in today’s world, like it or not, energy for the most part is synonymous with fossil fuels.
The resulting increase in yields and food production helped reduce food prices worldwide which reduced hunger by making food more affordable (Goklany 2007). Additional CO2 in the atmosphere has also contributed to higher yields and food production (IPCC 2001: 254–257, 285) because it provides carbon, the basic building block of life, and also increases the efficiency with which plants use water helping offset declines in water availability, if any.
Another factor critical to reining food prices and reducing hunger worldwide is trade within and between countries which enables food surpluses to be moved to food deficit areas (Goklany 1995, 1998). But it takes fossil fuels to move food around in the quantities and the speed necessary for such trade to be an integral part of the global food system, as it indeed is. Moreover, fossil fuel dependant technologies such as refrigeration, rapid transport, and plastic packaging, ensure that more of the crop that is produced is actually eaten by the consumer. That is, they increase the overall efficiency of the food production system, which helps lower food prices and contain hunger worldwide.
The second important factor is better disaster preparedness, and more rapid response and delivery of humanitarian aid when disaster strikes. Timely preparations and response are major factors that have contributed to the reduction in death and disease that traditionally were caused by or accompanied disasters from extreme weather events (Goklany 2007b). Their success hinges on the availability of fossil fuels to move people, food, medicine and critical humanitarian supplies before and after events strike. Economic development also allowed the US (and other developed countries) to offer humanitarian aid to developing countries in times of famine, drought, floods, cyclones, and other natural disasters, weather related or not. Such aid, too, would have been virtually impossible to deliver in large quantities or in a timely fashion absent fossil fuel fired transportation.
These improvements, which occurred despite increases in the populations at risk, can be attributed largely to the combination of greater economic development and technological change. Together they enable society to protect against - and cope with - adversity in general, and extreme weather events in particular (IPCC 1991; Goklany 1995, 2007).
The role of economic development in reducing the death toll from natural disasters is confirmed by analyses undertaken by Kahn (2005) and van der Vink et al. (2007). Kahn’s analysis of natural disasters for 73 nations from 1980-2002 found that an average nation with a population of 100 million and GDP per capita of $2,000 would in 1990 have experienced 944 deaths from natural disaster, however, had GDP per capita been raised to $14,000, its death toll would have fallen to 180 per year, an 81% decline (p. 280). Although both studies covered weather and non-weather related disasters, their findings should be generally applicable to all types of natural disasters, whether weather related (or not). Both also found that nations that were less democratic and scored lower on measures of good governance suffered a higher death toll. Kahn also concluded that greater income inequality led to higher death tolls.
These findings are generally consistent with recent experience on natural disasters. For instance, while no two disasters are alike in terms of risk and population exposure, it is notable that an estimated 222,600 people died in the 7.0 magnitude Haiti earthquake in January 2010, while the death toll from the much-stronger 8.8 magnitude Chilean earthquake that occurred the following month killed fewer than 600 people (EM-DAT 2010). Similarly, in 2008, Cyclone Nargis, with a maximum intensity of 115 knots, killed 138,400 in Myanmar while Cyclone Sidr - maximum intensity, 140 knots - killed 4,240 in Bangladesh (JWTC 2007, 2008; EM-DAT 2010).
Finally, over the long term, despite population increases, cumulative mortality from extreme weather events has declined globally, even as total (all-cause) mortality continues to increase. That is, humanity is coping better with extreme weather events than with far more important health and safety problems.
Resources spent to reduce global warming are better spent elsewhere
Currently many advocate spending trillions of dollars to reduce anthropogenic greenhouse gases, in part to forestall hypothetical future increases in mortality from global warming induced increases in extreme weather events. Spending even a fraction of such sums on the numerous higher priority health and safety problems plaguing humanity would provide greater returns for human well-being (Goklany 2009a, 2009b). No less important, efforts to reduce greenhouse gas emissions would slow, if not retard, economic development and/or make fossil fuels scarcer and more expensive thereby militating against the very factors that have reduced deaths and death rates from extreme weather events.
Summary
Whether the magnitude or frequency of extreme weather events has increased because of global warming is not evident from long term data on deaths and death rates from extreme weather events. In any case this issue is secondary to the fact that casualties from all such events have been reduced by over an order of magnitude in the past decades. These reductions are due in large part to factors that contribute to greenhouse gas emissions.
Reducing these emissions through efforts to make fossil fuel energy scarcer and more expensive could, therefore, be counterproductive in humanity’s efforts to limit death and disease from not only such events but also other, far more significant sources of adversity.
About the author
Dr. Indur M. Goklany is a member of the GWPF Academic Advisory Council. He is an author and a researcher who has been associated with the Intergovernmental Panel on Climate Change since its inception in 1988 as an author, expert reviewer, and U.S. delegate to that organization.
New Zealand Coalition
The High Court has been asked to invalidate the New Zealand official temperature record (NZTR) as promoted by the Crown Research Institute, NIWA. These records are the historical base of NIWA’s scientific advice to central and local government on issues relating to climate change. NIWA maintains temperature archives for the past century, and also projects them forward for the next century.
The statement of claim filed on behalf of the New Zealand Climate Science Education Trust (NZCSET) asks the court for three rulings:
A: to set aside NIWA’s decisions to rely upon its Seven Station Series (7SS) and Eleven Station Series (11SS), and to find the current NZTR to be invalid
B: to prevent NIWA from using the current NZTR (or information originally derived from it) for the purpose of advice to any governmental authority or to the public
C: to require NIWA to produce a full and accurate NZTR.
‘’Twentieth-century temperature records are now being challenged all around the world” said Bryan Leyland, spokesman for the NZCSET. “But I think we are the first country where the issues are to be placed squarely before an independent judicial forum.”
“Many scientists believe that, although the earth has been in a natural warming phase for the past 150 years, it has not heated as much as Government archives claim. The precise trend figure is extremely important, as it forms the sole basis of the claim that human activities are the dominant cause of the warming.
“The New Zealand Met Service record shows no warming during the last century, but NIWA has adopted a series of invariably downward adjustments in the period prior to World War 2. Because these move the old temperature records downwards, the 7SS NZTR shows a huge bounce-back of over 1°C in the first half of the century” said Mr Leyland. “Although this is out of line with dozens of other records, and has been the subject of sustained questioning by both the New Zealand Climate Science Coalition and the ACT party, NIWA refuses to accept that there are serious problems with the adjustments. In fact, no one has been able to explain exactly how they were arrived at.”
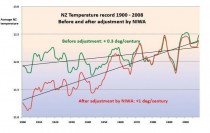
Enlarged here.
The Court proceedings also allege bias and unethical conduct on the part of NIWA’s National Climate Centre. These are based partly on NIWA allegedly delegating the NZTR decision to a former employee, James Salinger, knowing that he had a vested interest in an untested theory put forward in his own 1981 thesis. NIWA also knew that the data and calculations for that theory had been lost, and, thus could not be replicated.
Another core criticism is NIWA’s constant reliance on an eleven-station series it produced last December. The flaws in this paper have been highlighted many times, including at
http://www.quadrant.org.au/blogs/doomed-planet/2010/06/nz-climate-crisis-gets-worse
“We find it hard to believe NIWA management just failed to notice that all the warming in the ‘eleven-station’ series was caused by the fact that it starts off with only three stations in 1931. From 1945 onwards there are between 9 and 11 stations” said Mr Leyland, “It’s astonishing how the increasing number of stations leads to greater warming, more alarm, and increased research grants.”
The Court will be asked to rule that NIWA has refused to repudiate the current NZTR in order to avoid political embarrassment, and feared loss of public confidence in the objectivity of its scientists. The proceedings were filed and served this week, and NIWA has up to a month to respond.
If successful. will be the precedent to go after the other data centers for their advocacy and deriliction of duty.
By Nils-Axel Morner
Icecap Note:
Last week another alarmist story appeared in the Guardian quoting Richard Alley, professor at the once great Penn State University in which it reported on the natural calving of a large chink of the Petermann glacier in Greenland. They noted “Greenland shed its largest chunk of ice in nearly half a century last week, and faces an even grimmer future, according to Richard Alley, a geosciences professor at Pennsylvania State University.
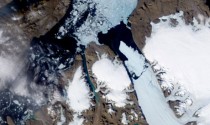
“Sometime in the next decade we may pass that tipping point which would put us warmer than temperatures that Greenland can survive,” Alley told a briefing in Congress, adding that a rise in the range of 2-7 C would mean the obliteration of Greenland’s ice sheet.”
We asked a real expert on sea level, Nils-Axel Morner to comment. Here is what he had to say:
No “huge rise in sea level” to foresee: Observation rules out modelling
Recently, “a panel of leading geoscientists told the US Congress” that sea level is likely to rise by 7 metres within this century. What nonsense, we must say. Not only, is this against observational facts, it is also against physics.
At the Last Ice, the huge ice caps over Europe and North America had their southern margins way down at mid latitudes (at Hamburg in Europe and at New York in North America). When climate changed, the ice melted at a very rapid rate. At Stockholm, for example, the ice margin was displaced northwards at a rate of about 300 m per year. Indeed, an enormous speed. Still, global sea level did not rise more than about 10 mm per year or 1 metre in a century. This rate sets the absolutely ultimate physically frame of any possible sea level rise today. Any claim exceeding this value must be classified as shear nonsense. It is as simple as that.
The Greenland Ice Cap did not melt during the postglacial hypsithermal (some 5000 to 8000 years ago), when temperature was about 2.5 C higher than today. Nor did it melt during the Last Interglacial when temperature was about 4C higher than today. As to time, it would take more than a millennium (with full thermal forcing) to melt the ice masses stored there.
The panel also talk about a possible “tipping point”. Well, the only event of that type we can be fairly sure about, seems to be the approaching turn from a Solar Maximum (just passed) to a Solar Minimum (calculated at around 2040).
The view presented by the panel is another sad expression of IPCC propaganda. What they say is not founded in geoscientific knowledge and physical laws. The World is far too full of real problems that call for immediate consideration to waste time on wild exaggerations.
Nils-Axel Morner
(Sea level specialist from Sweden)
Paleogeophysics & Geodynamics
morner@pog.nu
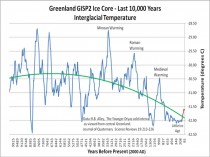
ICECAP NOTE: In actual fact, Alley’s own chart should tell you we do not have a problem in Greenland. In fact, if anything, the data may be suggesting a movement towards a new ice age.
Enlarged here.
Also as Ken Haapala of SEPP notes in TWTW this week The referenced article also points out that according to ice core borings, in the past 10,000 years Greenland has been as much as 2.5C warmer than today. Also perplexing is that the ice cores show the current temperature is almost minus 31C. A warming of 7C would bring it to minus 24C, hardly the melting point of ice.
See PDF.
UPDATE: A new paper published yesterday in the Journal of Geophysical Research - Oceans, confirms other studies of tide gauge records which show that there has been no statistically significant acceleration in sea level rise over the past 100+ years, in contrast to statements of the IPCC and Al Gore. Sea levels have been rising naturally since the end of the last major ice age 20,000 years ago, and the rate of rise began to decelerate about 8,000 years ago:
JOURNAL OF GEOPHYSICAL RESEARCH, VOL. 115, C08013, 15 PP., 2010: Reconstruction of regional mean sea level anomalies from tide gauges using neural networks. Authors: Manfred Wenzel, Jens Schroter
The 20th century regional and global sea level variations are estimated based on long-term tide gauge records. For this the neural network technique is utilized that connects the coastal sea level with the regional and global mean via a nonlinear empirical relationship. Two major difficulties are overcome this way: the vertical movement of tide gauges over time and the problem of what weighting function to choose for each individual tide gauge record. Neural networks are also used to fill data gaps in the tide gauge records, which is a prerequisite for our analysis technique. A suite of different gap-filling strategies is tested which provides information about stability and variance of the results. The global mean sea level for the period January 1900 to December 2006 is estimated to rise at a rate of 1.56 +/- 0.25 mm/yr which is reasonably consistent with earlier estimates, but we do not find significant acceleration. The regional mean sea level of the single ocean basins show mixed long-term behavior.
While most of the basins show a sea level rise of varying strength there is an indication for a mean sea level fall in the southern Indian Ocean. Also for the the tropical Indian and the South Atlantic no significant trend can be detected. Nevertheless, the South Atlantic as well as the tropical Atlantic are the only basins that show significant acceleration. On shorter timescales, but longer than the annual cycle, the basins sea level are dominated by oscillations with periods of about 50-75 years and of about 25 years. Consequently, we find high (lagged) correlations between the single basins.
Note: The 1.56 mm/yr non-accelerating rate of sea level rise would result in sea levels 6 inches higher than the present in 100 years. The oscillations noted in this study correspond to the typical full and half-cycle lengths of the natural Pacific Decadal Oscillation and the natural 60-year climate cycle. The Pacific Decadal Oscillation warm phase has been shown to produce a marked temporary rise in global mean sea levels. H/T Benny Peiser CCNet
-----------------
See Marc Morano’s long fact filled letter to another PSU professor (and ethics professor named Brown) here.
Note from Climate Depot’s Executive Editor Marc Morano to Penn State Ethics Prof. Donald A. Brown. (Dab57@psu.edu)
Dear Professor Brown:
You have recently been making the news with some very unique and serious claims regarding man-made global warming.
You have made the laughable claim that Senate’s failure to pass cap-and-trade the “worst ethical scandal...and a moral lapse of epic proportions.”
Sadly, this claim alone proves that your understanding of science and economics is what is truly the “worst ethical scandal” here.
How would passing a climate bill that was ‘scientifically meaningless’ improve ethics or morality or the climate? See: Even Obama’s EPA admits cap-and-trade bill ‘will not impact world CO2 levels’
You spend most of your “science” argument trying to convince the public of dangerous man-made global warming by noting that the Earth has been warming.
Wow. So in your simplistic scientific mind Warming = Human caused. Sorry Professor that is not a very deep and well thought out argument.
ICECAP Note: Marc goes on to quote paper after paper, report after report, fact after fact that makes Brown’s position laughable and yet another embarassment Penn State University. Soon the only one left with any credibility will be Joe Paterno.
--------------
Joe Bastardi Unloads On Penn State Corruption - Feels Betrayed
By P Gosselin
Anyone who reads this blog knows that meteorologist Joe Bastardi is one of my favorites. Yesterday he wrote a scathing piece at his European blog about his alma mater Penn State for the way it whitewashed the Michael Mann affair, and other things.
Joe Bastardi is a graduate of Penn State, receiving a degree in Meteorology and is a leading Accuweather meteorologist. His seasonal forecasts almost always far outperform those of “climate scientists”. It’s because Joe knows what he’s talking about, the “climate scientists” don’t. A Penn State investigation of Michael Mann, author of the infamous hockey stick graph, led to his exoneration, much to the protest of the scientific community. Many called the investigation a whitewash. Bastardi agrees. At his blog he writes:
“Though I have a degree from the once proud and great meteorology department, it was EARNED during its glory day, when we graduated 2/3rds of the worlds meteorologists, and were the envy of other schools. That was yesterday, and yesterdays gone.” and says:
Penn State has lost its way.
“I will no longer refer to myself as a Penn State grad, nor promote the university in my appearances.”
That’s pretty heavy. And if you still don’t think Joe is ashamed of Penn State, read on:
“One cannot imagine the betrayal I feel at the hands of this university. AND THAT SAYS IT ALL.”
“The fact is the university I busted my tail for, and defended all these years, is complicit in not only advancing an agenda driven matter in the name of “science” but also trying to suppress freedom of independent, rational thinking. Its that simple.”,/i>
Joe is not alone. Many share his opinion. He writes:
”And believe me, there are many.. legion, that graduated PSU through the 90s that feel the same way I do.”
Joe will no longer remaim silent, and that’s good. We need more figures like Joe to speak out and express a dissent that is more necessary now than ever.
I also feel a little bit that way about my own alma mater, the University of Arizona, where one of Mann’s colleagues is a professor - but thankfully not at the College of Engineering and Mines, where I studied and got my Bachelor’s in Mechanical Engineering. I can imagine that this has got to be really tough for Joe to do. Write to Joe to express your support: bastardi@accuweather.com. I think he’ll appreciate it.