

By Joseph D’Aleo, CCM, weatherbell.com
A new study led by the Georgia Institute of Technology attempted to support a relationship reported in recent years (Overland) between melting ice in the Arctic regions and widespread cold outbreaks in the Northern Hemisphere. “We think the recent snowy winters could be caused by the retreating Arctic ice altering atmospheric circulation patterns by weakening westerly winds, increasing the amplitude of the jet stream and increasing the amount of moisture in the atmosphere,” explained Jiping Liu, a senior research scientist in the School of Earth and Atmospheric Sciences at Georgia Tech. “These pattern changes enhance blocking patterns that favor more frequent movement of cold air masses to middle and lower latitudes, leading to increased heavy snowfall in Europe and the Northeast and Midwest regions of the United States.”
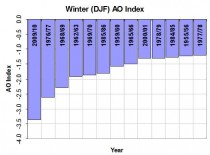
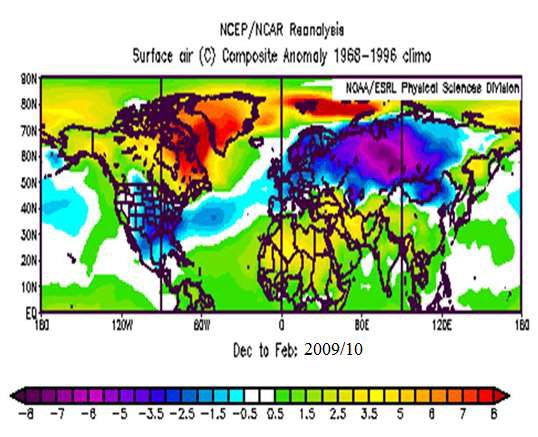
They used the two extreme winters of 2009/10 and 2010/11 across the Northern Hemisphere as evidence to support this relationship. Extreme northern hemisphere winters with frigid cold and deep snows do occur, often in clusters and historically we will show have related to changing large scale circulation patterns. They dominated in the Mini and Little Ice Ages.

Enlarged.
Since they have occurred in the past, one has to look at natural factors and natural circulations.
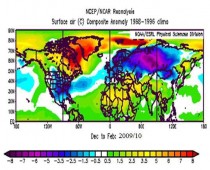
Both winters were characterized by a strong negative North Atlantic and Arctic Oscillations. These ‘wildcards’ are well known by forecasters to override or amplify the patterns associated with factors like ENSO.
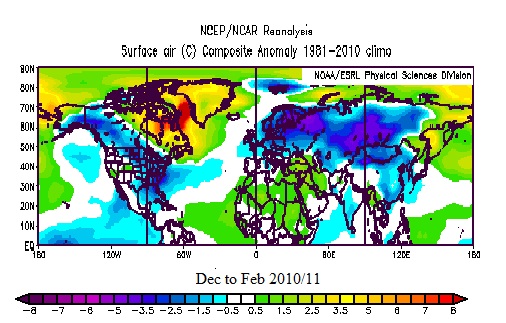
Indeed the winter of 2009/10 was a moderately strong El Nino and the winter of 2010/11 a very strong La Nina (by some measures the second strongest in the last century). Yet the patterns associated with the two winters was nearly identical. And very much in line with a negative NAO/AO.
Enlarged.
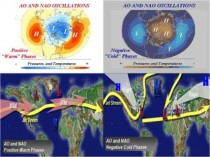
In the positive stage of the AO and NAO as we saw this November, December and first part of January, a tight polar vortex leads to westerly winds into North America from the Pacific and from the Atlantic into Europe. Mild conditions prevail as they did (and continue in the US) this year.
The negative NAO/AO on the other hand leads to polar high pressure forcing cold air to mid latitudes. In North America the cold air is forced south.
In Europe, the high latitude “blocking” high pressure allows frigid Siberian air west. Indeed both North America and Europe were hard hit with cold from the blocking in 2009/10 and 2010/11 despite the strong El Nino in one year and La Nina in the second.
Enlarged.
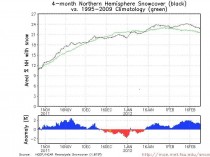
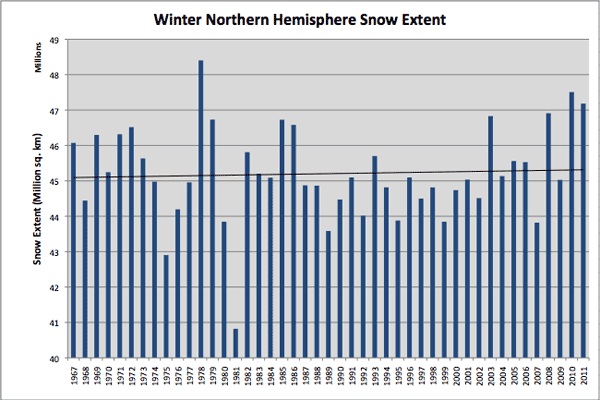
The two winters across the hemisphere ranked #2 (2009/10) and #3 among the winters of greatest winter snow extent behind only the legendary 1977/78 and just ahead of 2007/08 and 2002/03. Thus 4 of the top 5 snowiest years on record have occurred in the last decade.

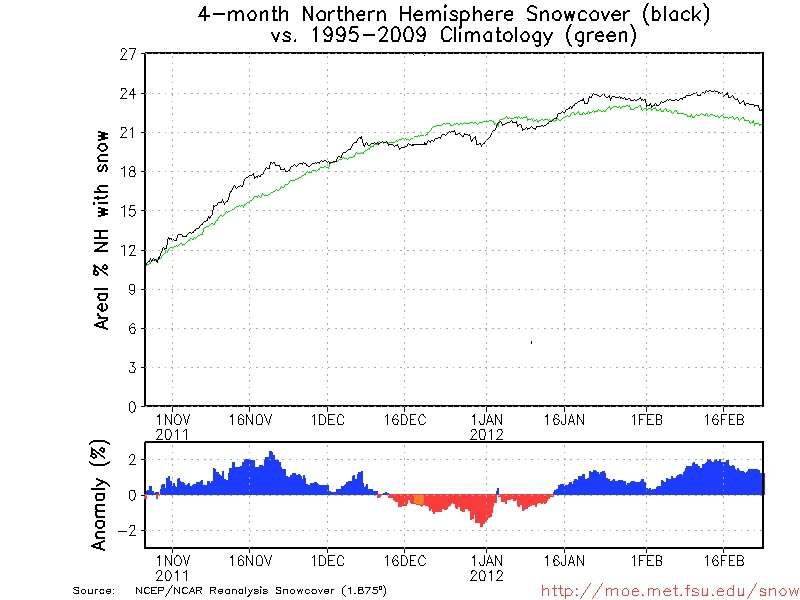
Even with the lack of snow in the lower 48 states this year, hemispheric snowcover is ABOVE normal again.
Enlarged.
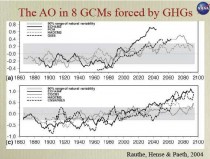
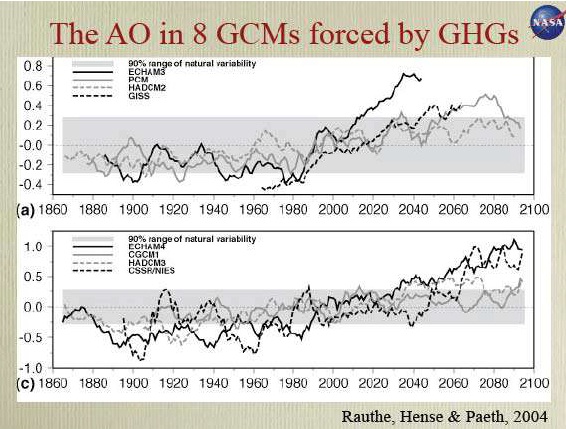
Until the scurrying around to find an excuse for the cold and snow when the forecast was for decreasing cold and snow in middle latitudes as late as 2007, they settled on diminished arctic ice forcing a negative AO/NAO. This was despite the fact that the climate models predicted with warming, an increased AO.
Enlarged.
SUMMER ARCTIC TEMPERTURES, BLOCKING AND COLD WINTERS
As for the idea that CO2 through arctic ice reduction and a warm arctic was responsible for the blocking, we looked at the standardized NAO winter values for winters since 1950. (CPC)
Winter NAO
2010 -2.12
1963 -1.94
1964 -1.85
1969 -1.69
1979 -1.62
1977 -1.43
1960 -1.43
1955 -1.27
1978 -1.23
1985 -1.16
1966 -1.13
1971 -1.06
1965 -1.03
2011 -0.99
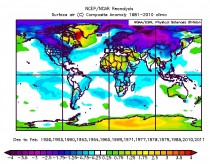
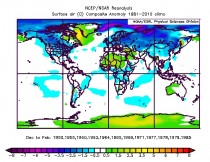
December to February NAO (STD)
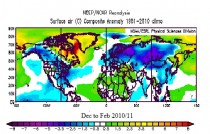
You can see from the composite of these very blocky years, the pattern is virtually identical to that of 2009/10, 2010/11 in December to February. To show an ‘independent’ data set, I eliminated 2009/10 and 2010/11 in the second chart - with little change in the results.
Enlarged.
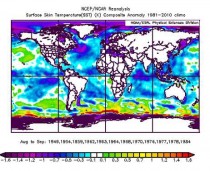
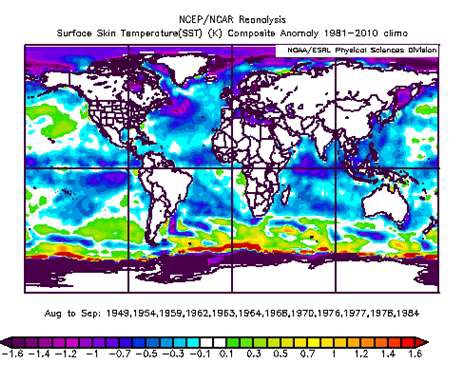
What about arctic water temperatures in August and September of those years. Was the arctic warm in those identical years leading to the blocky following winters? NO! Not according to NCEP reanalysis. It was cold in the late summer and early fall throughout the arctic.
NATURAL CAUSES
There are few natural causes discussed in the peer review literature relating to high latitude blocking. The two that appeared to play a role the last two cold winters were the high latitude volcanoes and very low solar activity.
HIGH LATITUDE VOLCANOES
Climatologists may disagree on how much the recent global warming is natural or manmade but there is general agreement that volcanism constitutes a wildcard in climate, producing significant global scale cooling for at least a few years following a major eruption. However, there are some interesting seasonal and regional variations of the effects.
Oman and Robock (2005) and others have shown that though major volcanic eruptions seem to have their greatest cooling effect in the summer months, the location of the volcano determines whether the winters are colder or warmer over large parts of North America and Eurasia. According to their modeling, tropical region volcanoes like El Chichon and Pinatubo actually produce a warming in winter due to a tendency for a more positive North Atlantic Oscillation (NAO) and Arctic Oscillation (AO).
They found high latitude volcanoes like Katmai (Alaska in 1912) instead favored the negative phase of the Arctic and North Atlantic Oscillations and cold winters. In the negative phase, the jet stream winds buckled and forced cold air south from Canada into the eastern United States and west from Siberia into Europe. They also favored a cooling of middle and higher latitudes the year round of that atmosphere and a weakening of the summer monsoon in India.
Several high latitude volcanoes have erupted in recent years- Kasatochi in Alaska in 2008, Mt. Redoubt in Alaska and Sarychev in Russia in 2009 and Eyjafjallajökull in Iceland in 2010 and Grimsvotn in 2011.
In addition to the strong blocking observed in 2009/10 and early in 2010/11, the Indian monsoon season was erratic in 2009 and again in 2011.
SOLAR CYCLES
Also important to the NAO/AO is low solar activity. Though solar irradiance varies slightly over the 11 year cycle, radiation at longer UV wavelengths are known to increase by several (6-8% or more) percent with still larger changes (factor of two or more) at extremely short UV and X-ray wavelengths (Baldwin and Dunkerton, JAS 2004).
Energetic flares increase the UV radiation by 16%. Ozone in the stratosphere absorbs this excess energy and this heat has been shown to propagate downward and affect the general circulation in the troposphere. Shindell (1999) used a climate model that included ozone chemistry to reproduce this warming during high flux (high UV) years. Labitzke and Van Loon (1988) and later Labitzke in numerous papers has shown that high flux (which correlates very well with UV) produces a warming in low and middle latitudes in winter in the stratosphere with subsequent dynamical and radiative coupling to the troposphere. The researchers show that at solar minimum, a weakened polar circulation (negative AO/NAO) was more likely when the Quasi Biennial Oscillation was easterly (as in 2009/10).
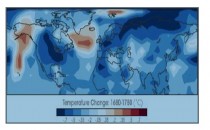
Shindell used this ozone chemistry based modeling to demonstrate how the lack of UV might have contributed to the cold of the Maunder Minimum. Their model showed when the sun was quiet in 1680, it was much colder than when it became active again one hundred years later (see figure below). “During this period, very few sunspots appeared on the surface of the Sun, and the overall brightness of the Sun decreased slightly. Already in the midst of a colder-than-average period called the Little Ice Age, Europe and North America went into a deep freeze: alpine glaciers extended over valley farmland; sea ice crept south from the Arctic; and the famous canals in the Netherlands froze regularly - an event that is rare today.” (
Writing in Environmental Research Letters (2010), Mike Lockwood et al. have verified that solar activity does seem to have a direct correlation with Earth’s climate by influencing North Atlantic blocking (NAO) as Shindell has shown. The reason that the scope of the study is limited to that area, or at most Europe, is that it is one of the few regions that there is a reliable, continuous temperature record going back to the Little Ice Age.
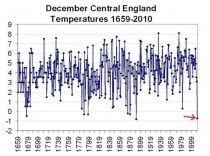
They noted further “solar activity during the current sunspot minimum has fallen to levels unknown since the start of the 20th century. The Maunder minimum (about 1650–1700) was a prolonged episode of low solar activity which coincided with more severe winters in the United Kingdom and continental Europe. Motivated by recent relatively cold winters in the UK, we investigate the possible connection with solar activity. We identify regionally anomalous cold winters by detrending the Central England temperature (CET) record using reconstructions of the northern hemisphere mean temperature.
We show that cold winter excursions from the hemispheric trend occur more commonly in the UK during low solar activity, consistent with the solar influence on the occurrence of persistent blocking events in the eastern Atlantic. We stress that this is a regional and seasonal effect relating to European winters and not a global effect. Average solar activity has declined rapidly since 1985 and cosmogenic isotopes suggest an 8% chance of a return to Maunder minimum conditions within the next 50 years (Lockwood 2010 Proc. R. Soc. A 466 303–29): the results presented here indicate that, despite hemispheric warming, the UK and Europe could experience more cold winters than during recent decades.”
The last extended solar minimum was the deepest and longest in over a century.
The 2009/10 winter with a record negative arctic oscillation and persistent negative NAO was the coldest in the UK and the southeastern United States since 1977/78, coldest in Scotland since 1962/63, coldest ever recorded in parts of Siberia. Coldest weather since 1971/72 was reported in parts of North China. December 2010 was the second coldest December in the CET since 1659 in the Little Ice Age.
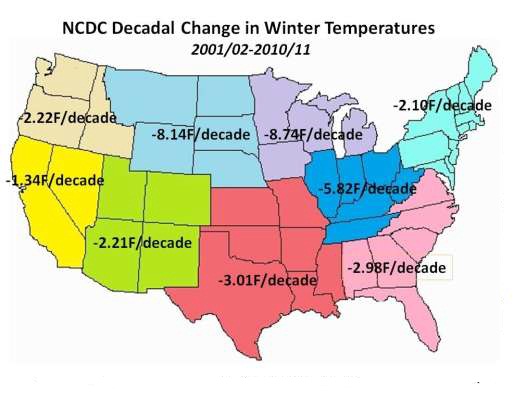
The decadal changes in the United States are impressive. These numbers will drop after this top 10 warmest rebound winter for the lower 48 states.
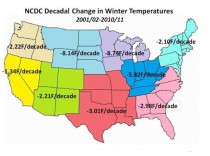
Enlarged.
It seems a steady stream of the tenets of the WG movement has been failing in recent years - 15 years of non warming, slowing and even falling sea levels, no increases in the ocean heat content, colder winters and increasing hemispheric snows, the missing hot spot in the tropics mid troposphere, a troposphere warming much slower than the surface when models suggest the opposite, increasing (7 out last 10) ENSO events being La Nina when we were promised a permanent El Nino, record high polar bear populations, recovering Kilimanjaro ice and no Himalayan ice loss, and on and on (I created a listy of 30 without even trying hard). In every case, papers that attempt to make these changes ‘consistent’ with global warming are rushed through peer (‘pal’) review and the all too compliant media are quick to promote them to save the ‘cause’.
When they lose these turning points they turn to trying to hype the never ending stream of extreme weather as evidence of climate disruption. The extremes cluster for the same natural reasons (last year’s extremes can be blamed on the second strongest La Nina in the last century in 2010/11). Many of us who have spent decades looking at data and natural causes for these weather changes or regimes and virtually always can find them. The only constant in nature is that weather and climate will change.
Having taught a course at Georgia Tech and worked on my doctorate there while Director of Meteorology at The Weather Channel, I have an attachment for Georgia Tech’s program and have enormous respect for Judith Curry who maintains an open mind and wonderfully balanced blog on climate.
REFERENCES:
Baldwin, M.P., Dunkerton, T.J.: (2004) The solar cycle and stratospheric-tropsospheric dynamical coupling, JAS 2004
Labitzke, K., The global signal of the 11-year sunspot cycle in the stratosphere: Differences between solar maxima and minima, Meteorol. Zeitschift, 10, 83-90, 2001.
Lockwood, M., Harrison, R.G., Woollings T., and Solanki, S.K., (2010) Are cold winters in Europe associated with low solar activity? Environ. Res. Lett. 5 (April-June 2010) 024001
Oman, L., A. Robock, G. Stenchikov, G. A. Schmidt, and R. Ruedy (2005), Climatic response to high-latitude volcanic eruptions, J. Geophys. Res., 110,
Overland, J. E., and M. Wang, 2010: Large-scale atmospheric circulation changes associated with the recent loss of Arctic sea ice. Tellus, 62A, 1.9.
Rauthe, M., Hense, A. and Paeth, H. (2004), A model intercomparison study of climate change-signals in extratropical circulation. International Journal of Climatology, 24: 643-662
Shindell, D.T., D. Rind, N. Balachandran, J. Lean, and P. Lonergan, Solar cycle variability, ozone, and climate, Science, 284, 305–308, 1999a.