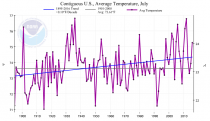
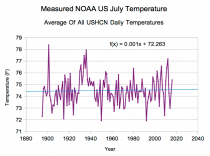
NOAA shows July temperatures increasing at 1.0F per century since 1895, with 2012 tied with 1936 as the hottest July.
Enlarged
Climate at a Glance | National Centers for Environmental Information (NCEI)
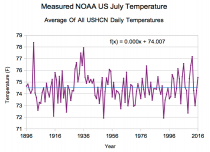
The actual raw temperature data they use to generate their graph, shows one tenth as much warming from 1895 to 2016, with 1901, 1936 and 1934 as the hottest years.
If 1895 is removed, there is no warming at all.
NOAA creates this warming by massively cooling the past. They got rid of the hot 1901 by cooling it 2.13 degrees. The cooled 1936 by by 1.13 degrees and cooled 1934 by 1.11 degrees. That is what it took to elevate 2012 to the hottest July.
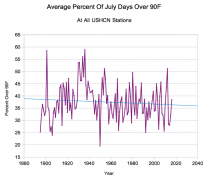
A good measure of how fraudulent the NOAA adjustments are, is the percent of days over 90 degrees. July 1936, 1901, 1934, 1931, 1930 and 1954 all had more days over 90 degrees than 2012 did, yet NOAA shows 2012 as the hottest. The frequency of 90 degree days in the US has declined since the start of records in 1895. July 2016 (NASA’s hottest July ever) was almost exactly average since 1895.
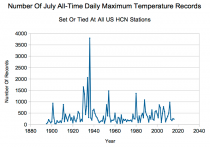
Another very good measure of how fraudulent the NOAA graph is, is the number of July daily maximum temperature records. The 1930’s were much hotter than any recent years.
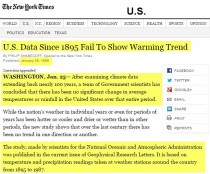
The claimed warming trend in the US is completely fake, and is altered by people at NOAA who are being paid to push the global warming agenda. Before they were paid to push anthropogenic warming, the very same people at NOAA (i.e. Tom Karl) knew that there was no US warming.
Enlarged
U.S. Data Since 1895 Fail To Show Warming Trend - NYTimes.com
The US makes up less than 10% of the land surface, but contains the majority of the high quality long term temperature monitoring stations for this planet. The global surface temperature record is a farce, which is why the US data is so important.


_thumb.png)
